
Singapore’s property has always been a popular investment vehicle for locals and foreigners alike. The Asian “insatiable hunger for bricks”, metropolitan culture, stable political and economic system of Singapore has drawn in investors over the years. Since suffering a c.25% drop in the property price index during the Global Financial Crisis (GFC), property prices and sales volume recovered remarkably in the 2 years from 2009 before a slew of cooling measures were implemented by the Government. Over a five-year horizon from 1Q11 (around the start of a slew of cooling measures), current residential property price index has returned to near the level it was at since 1Q11 (See Figure 20).
How do we view this?
We highlight that the recent uptick in sales volume over the last 2 quarters was due to two factors: various marketing schemes by developers, and the continued sales momentum in selected Outside Central Region (OCR) launches that was supported by low interest rates. However, sales volumes remain way below the heyday seen before the GFC or during 2010-2011 after the recovery. We expect the government’s continued clampdown on foreigner influx, increasing indebtedness in household balance sheets and more favourable foreign property markets to continue to impact interest and affordability in local property.
The implementation of the various property cooling measures has drastically dried up sales volume. We do not expect the lifting of the cooling measures until at least 2H17, in light of the gradual and manageable fall in home prices so far, especially with the relative strength in prices of OCR properties (See Figure 18). In light of this, we do not see major catalysts in sight for a big uptick in sales volume.
We believe we have yet to see the bottom for Singapore’s property prices. Nonetheless, we are cognisant of the fact that many developers are diversifying their income streams from outside of Singapore. We advise clients to perform bottom-up analysis on the various developers and prefer developers with exposure outside of Singapore.
Public Housing in Singapore
During a routine parliament sitting in March 2010, then-Minister for National Development, Mr. Mah Bow Tan addressed some public grouses on the state of Singapore’s public housing market. Amongst the grouses were the high number of unsuccessful applications for (Build-To-Order) BTO flats for first-time married couples, and the escalating prices of resale HDB flats led by increasing Cash over Valuations (COVs) paid.
Record low supply of new HDB flats over five years from 2006-2010
Unsurprisingly, the rise in the number of grouses on the ground coincided with the period which saw the lowest number of new HDB flats built over a five-year period since HDB’s forming in 1960 (see Figure 1). From 2006-2010, we saw an average annual supply of 5,987 flats.
Figure 1: Average annual supply and demand for HDB flats
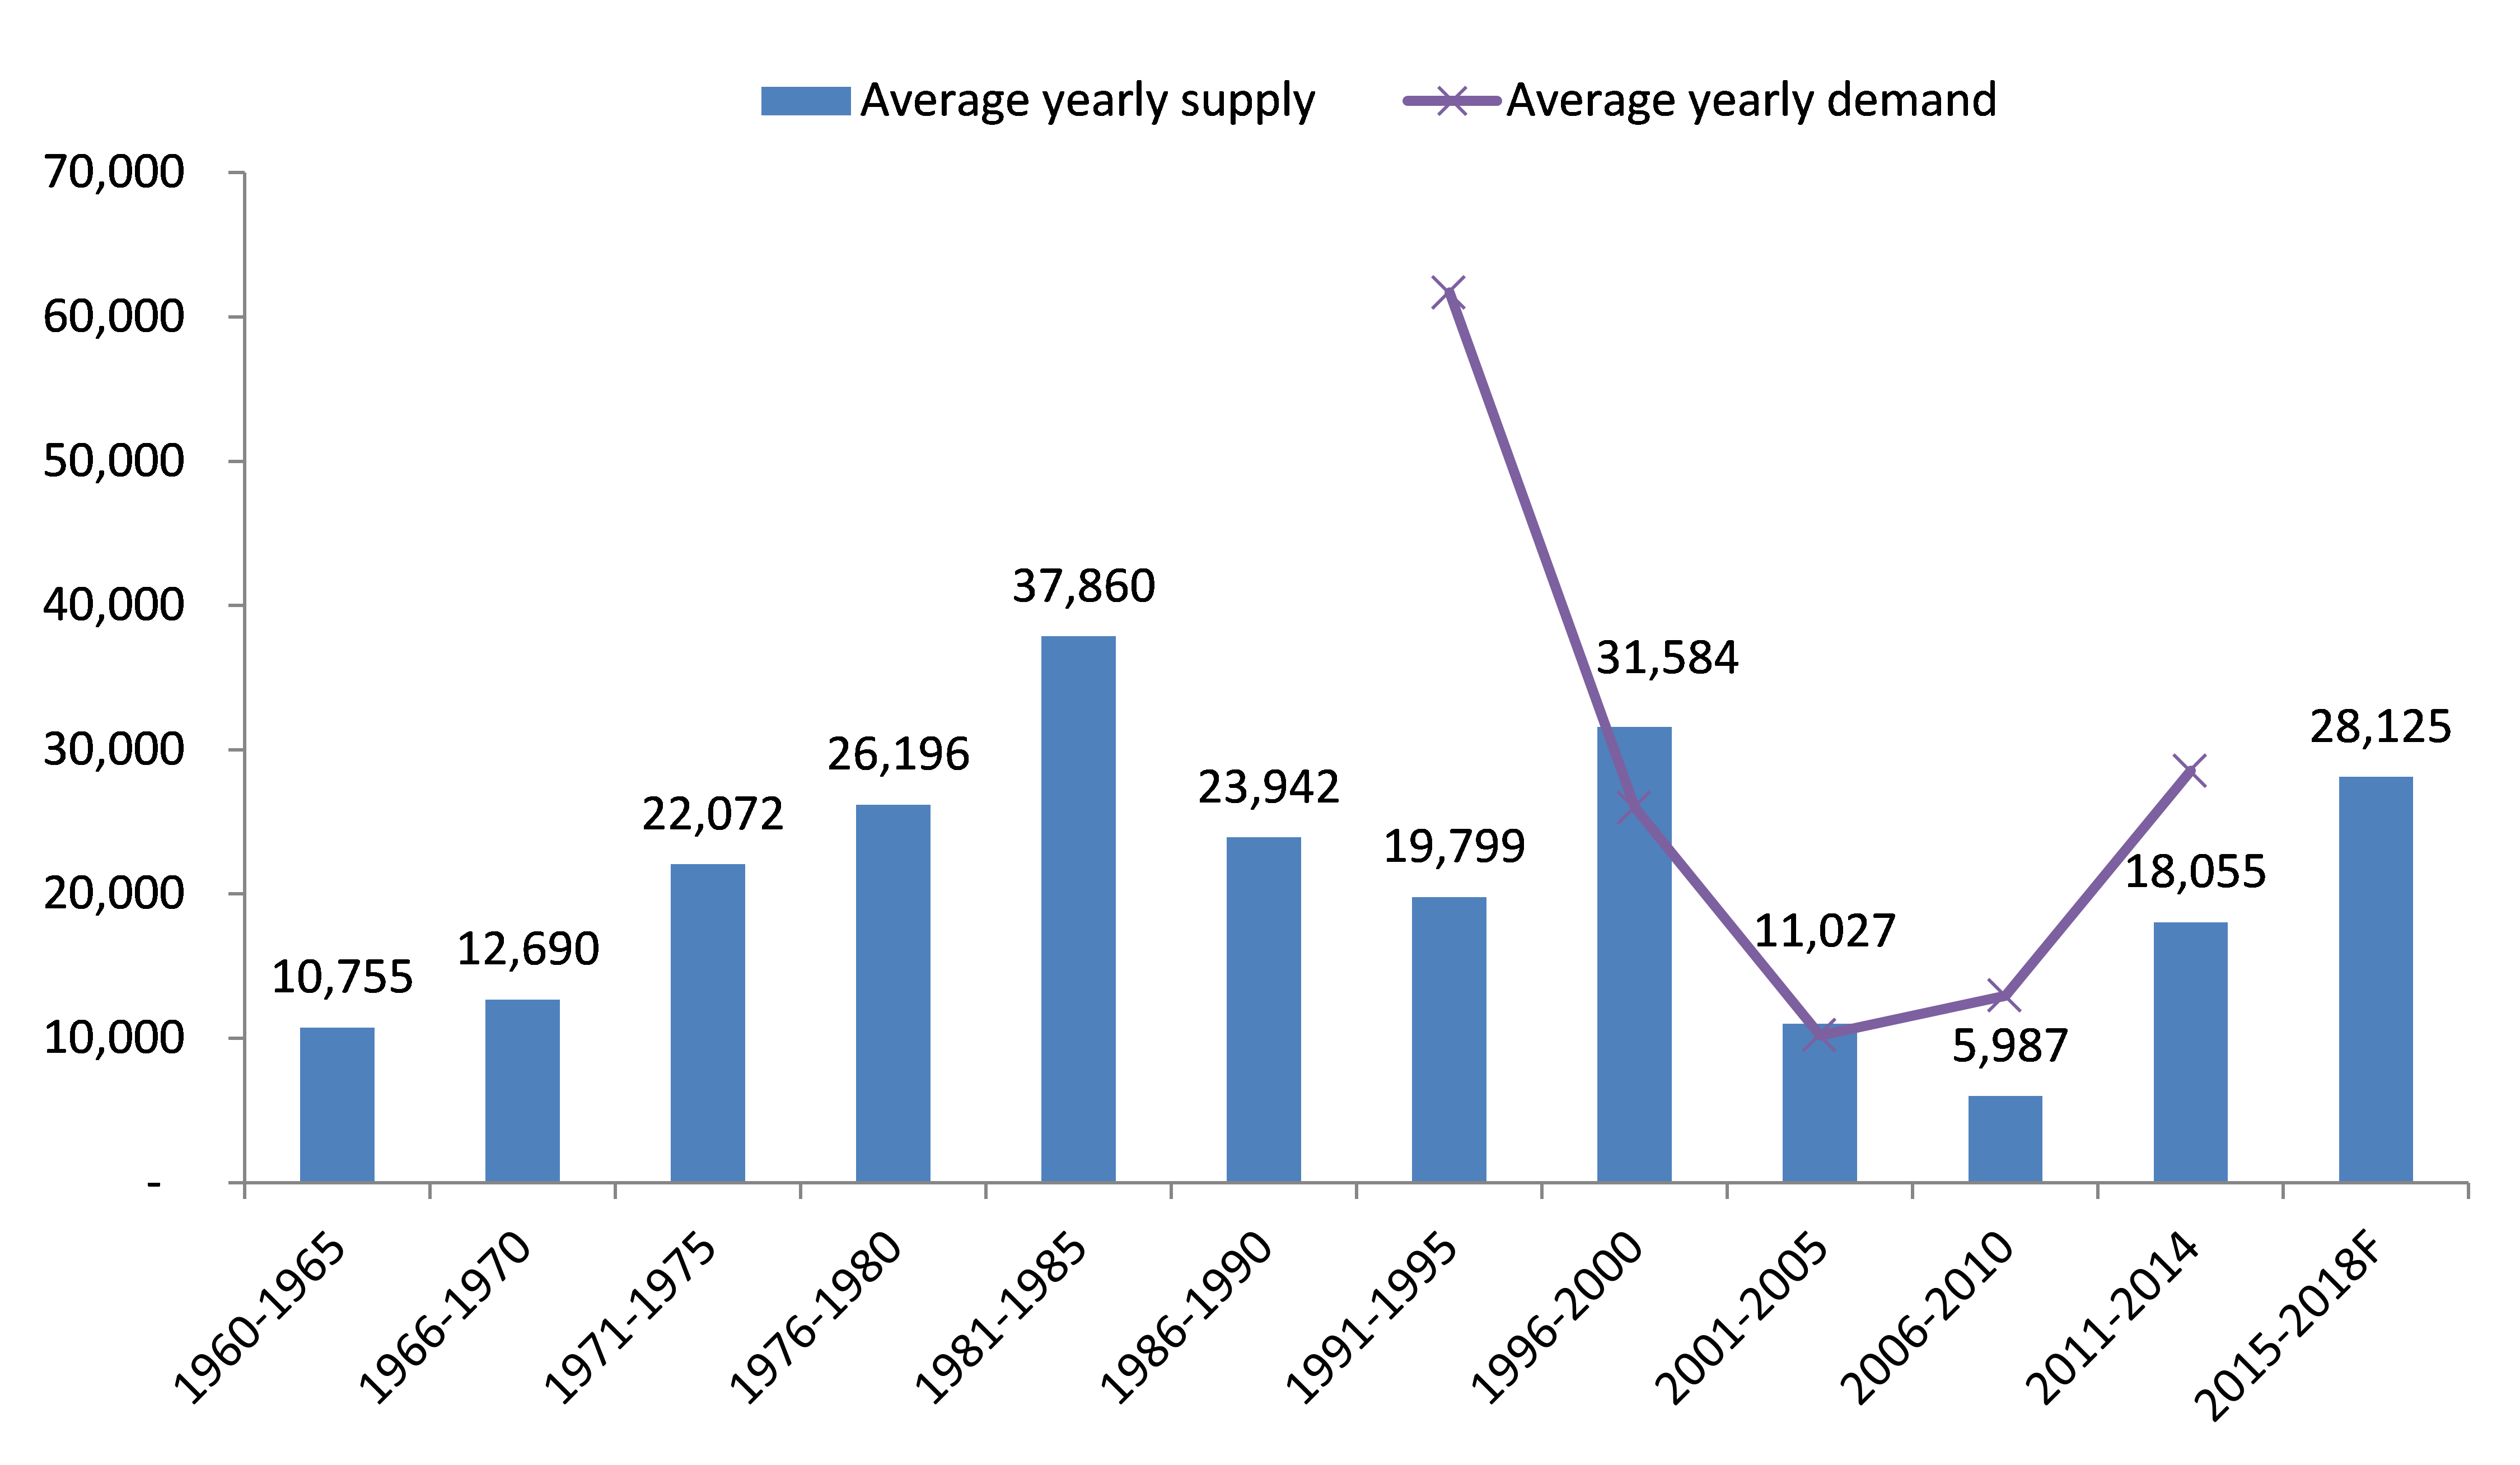
Source: HDB, Phillip Securities Research (Singapore)
Forecasted supply until 2018 expected to be sufficient to meet demand
After lagging total demand (estimated by total bookings for public housing) over the past 10 years, average annual supply of HDB flats is expected to be ramped up to c.28,125 from 2015 to 2018. Total bookings, could potentially misstate real demand, due to reasons such as supply-led bookings, or double counting of re-bookings in a particular year after a previous failed allocation. We look at the total number of marriages in a single year for a better gauge of how much demand could potentially be, from what we believe would be the biggest group of demand generators for HDB flats. According to the HDB, an estimated 82% of Singapore’s residents live in HDB flats. Extending this ratio to the number of marriages per year (28,322 in 2015), we expect demand for new public housing per year catering to this group of resident population to be closer to the 20,000 range.
Figure 2: Total number of marriages in a year, Singapore
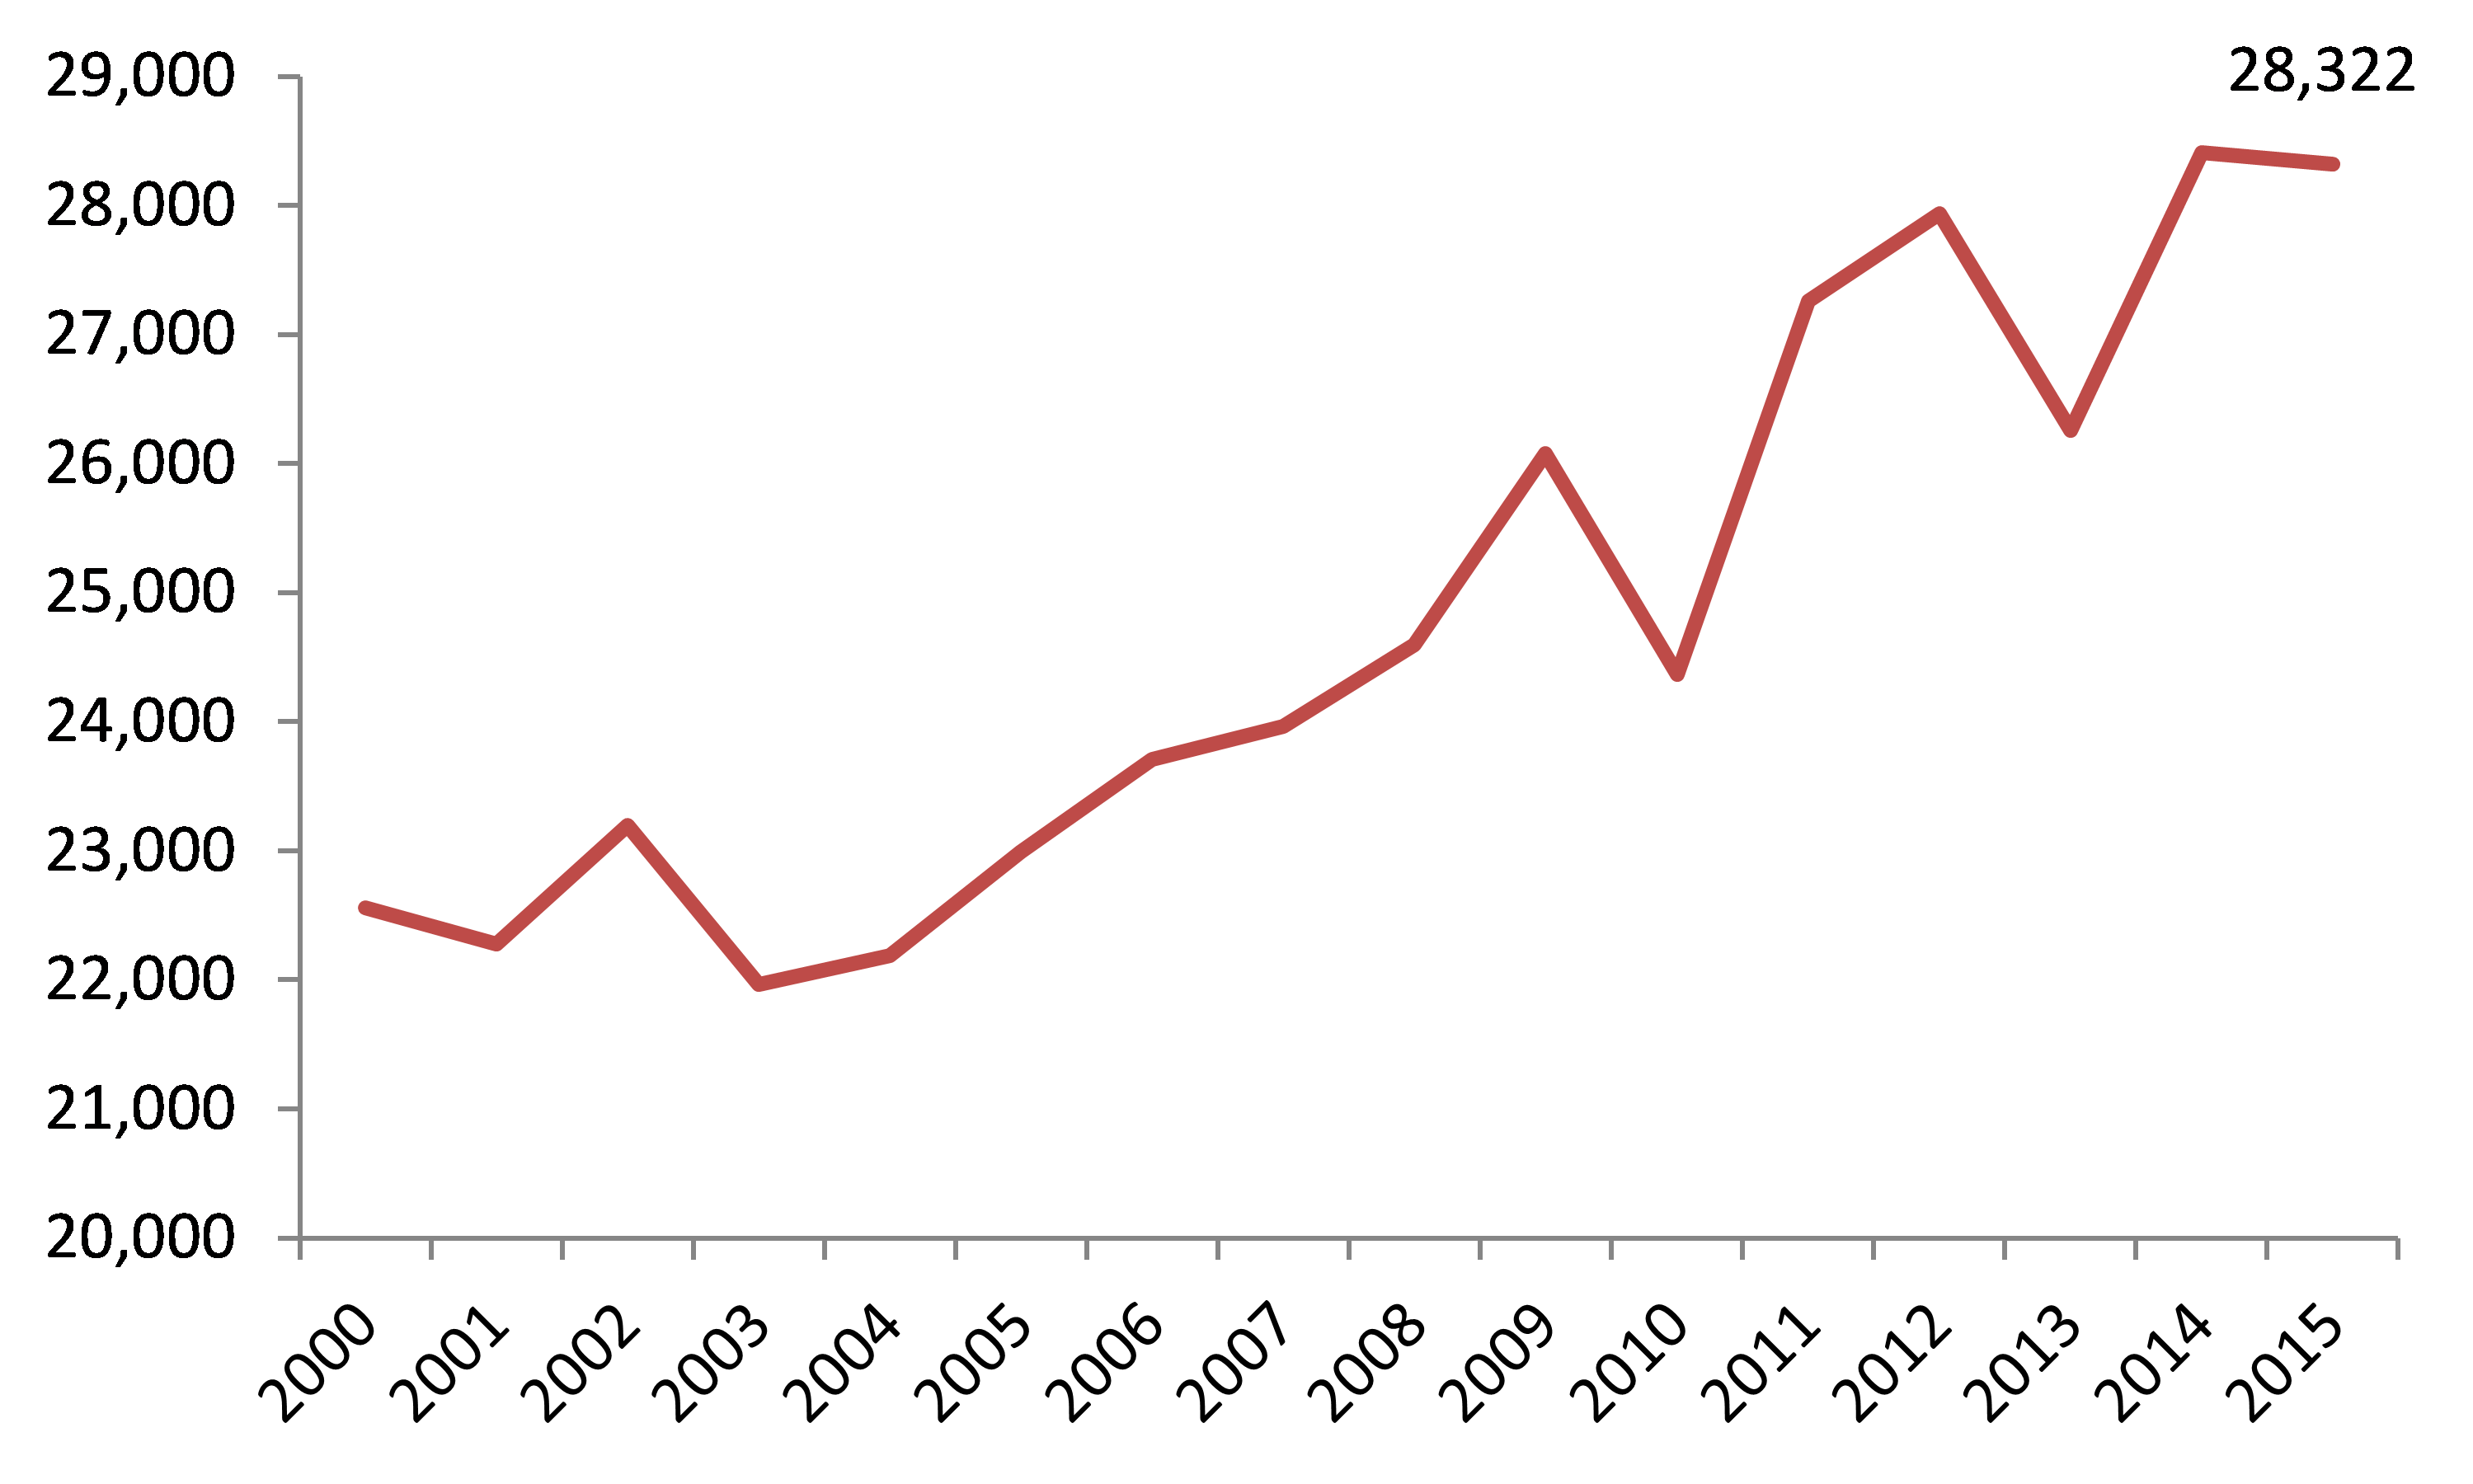
Source: Department of Statistics, Phillip Securities Research (Singapore)
The Ministry for National Development (MND) has projected for some 112,000 new HDB flats to enter the market from 2015-2018. This translates to an average annual supply of 28,000 units of public housing until 2018, which represents a period that will see the highest number of flats being built annually since the late 1990s.
Developers with upcoming/existing Executive Condominiums (EC) launches could see slower take up rates as home buyers are presented with a greater number of options, especially from launches in mature HDB estates.
Executive Condominiums
After being phased out from 2008 in favour of the Design, Build and Sell Scheme (DBSS), the EC scheme was re-introduced in 2010, to be launched in parallel with DBSS flats. DBSS land sales was eventually suspended in 2011. Since its re-introduction in 2010, the supply of ECs has been gradually ramped up, in conjunction with the increase in supply of BTO (cancelled because it is on page 2 already) flats. With an occupancy rate of 86.2% as at 2Q16, 2,943 units stood unoccupied and unsold, representing a high since the EC scheme was reintroduced in 2010. This is also slightly more than the average annual number of units sold at 2690, since 2010.
Limited land sales for ECs to limit supply from 2017
Further to the already launched projects, as of 2Q16, three remaining land parcels slated for EC purposes are expected to be launched in 2017/1H18, which by our estimates, would increase supply by an additional c.1,500 units. Total market supply including launched but unsold units currently stand at c.4,000 units. This is about 1.5 times the average annual number of units sold since 2010. With only these 3 remaining plots of land (as mentioned below) yet to be launched until 1H18, a slowdown in supply till then should help developers to gradually clear their existing inventory of EC units without needing to incur any Additional Buyer’s Stamp Duty (ABSD) charges (despite the expected ramp up in HDB flat supply over the next few years). More importantly, we do not foresee the need for them to significantly reduce prices in order to clear inventory before any ABSD deadlines
Figure 3: Remaining land parcels in Singapore slated for building of ECs
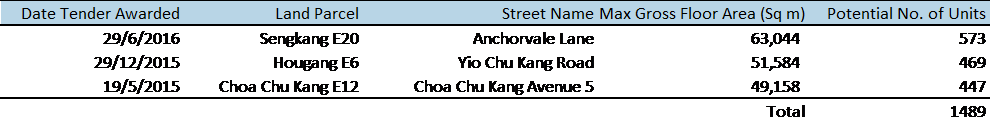
Source: HDB, Phillip Securities Research (Singapore)
Please download the full report to read further.
Important Information
This report is prepared and/or distributed by Phillip Securities Research Pte Ltd ("Phillip Securities Research"), which is a holder of a financial adviser’s licence under the Financial Advisers Act, Chapter 110 in Singapore.
By receiving or reading this report, you agree to be bound by the terms and limitations set out below. Any failure to comply with these terms and limitations may constitute a violation of law. This report has been provided to you for personal use only and shall not be reproduced, distributed or published by you in whole or in part, for any purpose. If you have received this report by mistake, please delete or destroy it, and notify the sender immediately.
The information and any analysis, forecasts, projections, expectations and opinions (collectively, the “Research”) contained in this report has been obtained from public sources which Phillip Securities Research believes to be reliable. However, Phillip Securities Research does not make any representation or warranty, express or implied that such information or Research is accurate, complete or appropriate or should be relied upon as such. Any such information or Research contained in this report is subject to change, and Phillip Securities Research shall not have any responsibility to maintain or update the information or Research made available or to supply any corrections, updates or releases in connection therewith.
Any opinions, forecasts, assumptions, estimates, valuations and prices contained in this report are as of the date indicated and are subject to change at any time without prior notice. Past performance of any product referred to in this report is not indicative of future results.
This report does not constitute, and should not be used as a substitute for, tax, legal or investment advice. This report should not be relied upon exclusively or as authoritative, without further being subject to the recipient’s own independent verification and exercise of judgment. The fact that this report has been made available constitutes neither a recommendation to enter into a particular transaction, nor a representation that any product described in this report is suitable or appropriate for the recipient. Recipients should be aware that many of the products, which may be described in this report involve significant risks and may not be suitable for all investors, and that any decision to enter into transactions involving such products should not be made, unless all such risks are understood and an independent determination has been made that such transactions would be appropriate. Any discussion of the risks contained herein with respect to any product should not be considered to be a disclosure of all risks or a complete discussion of such risks.
Nothing in this report shall be construed to be an offer or solicitation for the purchase or sale of any product. Any decision to purchase any product mentioned in this report should take into account existing public information, including any registered prospectus in respect of such product.
Phillip Securities Research, or persons associated with or connected to Phillip Securities Research, including but not limited to its officers, directors, employees or persons involved in the issuance of this report, may provide an array of financial services to a large number of corporations in Singapore and worldwide, including but not limited to commercial / investment banking activities (including sponsorship, financial advisory or underwriting activities), brokerage or securities trading activities. Phillip Securities Research, or persons associated with or connected to Phillip Securities Research, including but not limited to its officers, directors, employees or persons involved in the issuance of this report, may have participated in or invested in transactions with the issuer(s) of the securities mentioned in this report, and may have performed services for or solicited business from such issuers. Additionally, Phillip Securities Research, or persons associated with or connected to Phillip Securities Research, including but not limited to its officers, directors, employees or persons involved in the issuance of this report, may have provided advice or investment services to such companies and investments or related investments, as may be mentioned in this report.
Phillip Securities Research or persons associated with or connected to Phillip Securities Research, including but not limited to its officers, directors, employees or persons involved in the issuance of this report may, from time to time maintain a long or short position in securities referred to herein, or in related futures or options, purchase or sell, make a market in, or engage in any other transaction involving such securities, and earn brokerage or other compensation in respect of the foregoing. Investments will be denominated in various currencies including US dollars and Euro and thus will be subject to any fluctuation in exchange rates between US dollars and Euro or foreign currencies and the currency of your own jurisdiction. Such fluctuations may have an adverse effect on the value, price or income return of the investment.
To the extent permitted by law, Phillip Securities Research, or persons associated with or connected to Phillip Securities Research, including but not limited to its officers, directors, employees or persons involved in the issuance of this report, may at any time engage in any of the above activities as set out above or otherwise hold an interest, whether material or not, in respect of companies and investments or related investments, which may be mentioned in this report. Accordingly, information may be available to Phillip Securities Research, or persons associated with or connected to Phillip Securities Research, including but not limited to its officers, directors, employees or persons involved in the issuance of this report, which is not reflected in this report, and Phillip Securities Research, or persons associated with or connected to Phillip Securities Research, including but not limited to its officers, directors, employees or persons involved in the issuance of this report, may, to the extent permitted by law, have acted upon or used the information prior to or immediately following its publication. Phillip Securities Research, or persons associated with or connected to Phillip Securities Research, including but not limited its officers, directors, employees or persons involved in the issuance of this report, may have issued other material that is inconsistent with, or reach different conclusions from, the contents of this report.
The information, tools and material presented herein are not directed, intended for distribution to or use by, any person or entity in any jurisdiction or country where such distribution, publication, availability or use would be contrary to the applicable law or regulation or which would subject Phillip Securities Research to any registration or licensing or other requirement, or penalty for contravention of such requirements within such jurisdiction.
This report is intended for general circulation only and does not take into account the specific investment objectives, financial situation or particular needs of any particular person. The products mentioned in this report may not be suitable for all investors and a person receiving or reading this report should seek advice from a professional and financial adviser regarding the legal, business, financial, tax and other aspects including the suitability of such products, taking into account the specific investment objectives, financial situation or particular needs of that person, before making a commitment to invest in any of such products.
This report is not intended for distribution, publication to or use by any person in any jurisdiction outside of Singapore or any other jurisdiction as Phillip Securities Research may determine in its absolute discretion.
IMPORTANT DISCLOSURES FOR INCLUDED RESEARCH ANALYSES OR REPORTS OF FOREIGN RESEARCH HOUSE
Where the report contains research analyses or reports from a foreign research house, please note: