
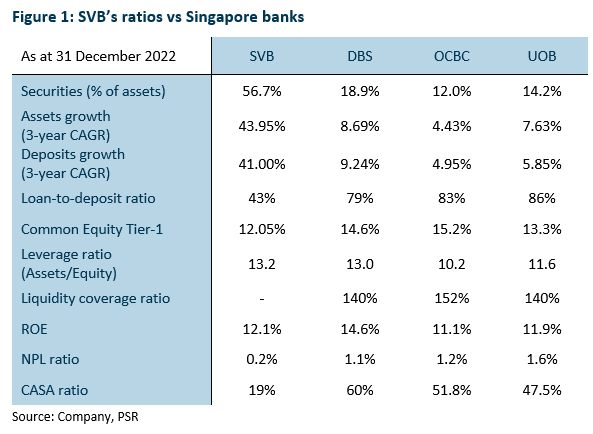
Large concentration on securities, majority in “held-to-maturity” securities
As at FY22, SVB had 57% of its assets in securities, with the majority in government backed securities. As the interest rates started to rise, bond prices fell sharply causing a decline in SVB’s securities portfolio. When purchasing securities, US banks are able to decide up-front whether they intend to hold them to maturity, and can designate these securities as “held-to-maturity” (HTM) or “available-for-sale” (AFS) assets. The key difference being that AFS assets are marked-to-market. As at 31 Dec 2022, SVB had US$15.2bn of unrealised losses on their HTM securities, which makes up ~93% of their total equity.
In comparison, the three local Singapore banks only hold securities amounting to ~15% of total assets. While Singapore banks also faced bond losses, there were less significant as majority of assets were variable rate loans where they could pass on the higher interest rates.
Assets and deposits growth spiked, but LDR and CASA ratio remained low
SVB’s asset grew at a CAGR of 44% over 3 years while deposits grew at 41% over the same period, due to the rise in venture capital funding during the pandemic and many of SVB’s customers becoming flush with cash. However, with loan demand weak, SVB channelled the majority of these fresh deposits into securities portfolios or kept as cash. As interest rates started to rise in 2H22, losses on the securities portfolios started to appear.
Singapore banks differ in this aspect, asset and deposit grew over the last 3 years but at a much lower pace with both assets and deposits growing at a CAGR of 6.9% and 6.7% over 3 years. The focus was kept on loans growth with the loan-to-deposit ratio kept high at ~83%, and CASA ratio at ~53%. With the rise in interest rates, Singapore banks were able to pass on the higher funding costs directly to their customers as majority of the loans were on a floating rate and the remaining fixed rate loans could be repriced.
Lack of Liquidity Coverage Ratio requirement
As a rule of thumb, interest rate risk is usually overseen by regulators through the Liquidity Coverage Ratio (LCR) and banks are required to hold enough high-quality liquid assets which can be sold during such a scenario. However, in SVB’s case, they were never subjected to the Federal Reserve’s LCR requirement as they did not have at least US$75bn in nonbank assets. This meant that when SVB’s customers started to pull out deposits, they were unable to withstand the deposit outflows.
In Singapore, all three local banks are required by MAS to meet the minimum LCR requirements of 100% for both all-currency and SGD. The Singapore banks currently have a LCR of ~144% as at 31 Dec 2022. This means that they would be able to withstand a surge in deposit outflows in a worst-case scenario.
Capital and leverage ratios similar to Singapore banks
Interestingly SVB’s Common Equity Tier-1 (CET1) ratio of 12.05% is similar to that of Singapore banks at ~14.4%. SVB’s leverage ratio of 13.2x is also higher than Singapore banks’ leverage ratio of ~11.6x.
Investment Action
Maintain OVERWEIGHT. We remain positive on Singapore banks. Bank dividend yields are attractive at 5.7% with possible upside surprise due to excess capital ratios and push towards higher ROEs. Singapore banks differ from SVB as majority of assets are in loans and higher interest rates can be passed on to customers.
Important Information
This report is prepared and/or distributed by Phillip Securities Research Pte Ltd ("Phillip Securities Research"), which is a holder of a financial adviser’s licence under the Financial Advisers Act, Chapter 110 in Singapore.
By receiving or reading this report, you agree to be bound by the terms and limitations set out below. Any failure to comply with these terms and limitations may constitute a violation of law. This report has been provided to you for personal use only and shall not be reproduced, distributed or published by you in whole or in part, for any purpose. If you have received this report by mistake, please delete or destroy it, and notify the sender immediately.
The information and any analysis, forecasts, projections, expectations and opinions (collectively, the “Research”) contained in this report has been obtained from public sources which Phillip Securities Research believes to be reliable. However, Phillip Securities Research does not make any representation or warranty, express or implied that such information or Research is accurate, complete or appropriate or should be relied upon as such. Any such information or Research contained in this report is subject to change, and Phillip Securities Research shall not have any responsibility to maintain or update the information or Research made available or to supply any corrections, updates or releases in connection therewith.
Any opinions, forecasts, assumptions, estimates, valuations and prices contained in this report are as of the date indicated and are subject to change at any time without prior notice. Past performance of any product referred to in this report is not indicative of future results.
This report does not constitute, and should not be used as a substitute for, tax, legal or investment advice. This report should not be relied upon exclusively or as authoritative, without further being subject to the recipient’s own independent verification and exercise of judgment. The fact that this report has been made available constitutes neither a recommendation to enter into a particular transaction, nor a representation that any product described in this report is suitable or appropriate for the recipient. Recipients should be aware that many of the products, which may be described in this report involve significant risks and may not be suitable for all investors, and that any decision to enter into transactions involving such products should not be made, unless all such risks are understood and an independent determination has been made that such transactions would be appropriate. Any discussion of the risks contained herein with respect to any product should not be considered to be a disclosure of all risks or a complete discussion of such risks.
Nothing in this report shall be construed to be an offer or solicitation for the purchase or sale of any product. Any decision to purchase any product mentioned in this report should take into account existing public information, including any registered prospectus in respect of such product.
Phillip Securities Research, or persons associated with or connected to Phillip Securities Research, including but not limited to its officers, directors, employees or persons involved in the issuance of this report, may provide an array of financial services to a large number of corporations in Singapore and worldwide, including but not limited to commercial / investment banking activities (including sponsorship, financial advisory or underwriting activities), brokerage or securities trading activities. Phillip Securities Research, or persons associated with or connected to Phillip Securities Research, including but not limited to its officers, directors, employees or persons involved in the issuance of this report, may have participated in or invested in transactions with the issuer(s) of the securities mentioned in this report, and may have performed services for or solicited business from such issuers. Additionally, Phillip Securities Research, or persons associated with or connected to Phillip Securities Research, including but not limited to its officers, directors, employees or persons involved in the issuance of this report, may have provided advice or investment services to such companies and investments or related investments, as may be mentioned in this report.
Phillip Securities Research or persons associated with or connected to Phillip Securities Research, including but not limited to its officers, directors, employees or persons involved in the issuance of this report may, from time to time maintain a long or short position in securities referred to herein, or in related futures or options, purchase or sell, make a market in, or engage in any other transaction involving such securities, and earn brokerage or other compensation in respect of the foregoing. Investments will be denominated in various currencies including US dollars and Euro and thus will be subject to any fluctuation in exchange rates between US dollars and Euro or foreign currencies and the currency of your own jurisdiction. Such fluctuations may have an adverse effect on the value, price or income return of the investment.
To the extent permitted by law, Phillip Securities Research, or persons associated with or connected to Phillip Securities Research, including but not limited to its officers, directors, employees or persons involved in the issuance of this report, may at any time engage in any of the above activities as set out above or otherwise hold an interest, whether material or not, in respect of companies and investments or related investments, which may be mentioned in this report. Accordingly, information may be available to Phillip Securities Research, or persons associated with or connected to Phillip Securities Research, including but not limited to its officers, directors, employees or persons involved in the issuance of this report, which is not reflected in this report, and Phillip Securities Research, or persons associated with or connected to Phillip Securities Research, including but not limited to its officers, directors, employees or persons involved in the issuance of this report, may, to the extent permitted by law, have acted upon or used the information prior to or immediately following its publication. Phillip Securities Research, or persons associated with or connected to Phillip Securities Research, including but not limited its officers, directors, employees or persons involved in the issuance of this report, may have issued other material that is inconsistent with, or reach different conclusions from, the contents of this report.
The information, tools and material presented herein are not directed, intended for distribution to or use by, any person or entity in any jurisdiction or country where such distribution, publication, availability or use would be contrary to the applicable law or regulation or which would subject Phillip Securities Research to any registration or licensing or other requirement, or penalty for contravention of such requirements within such jurisdiction.
This report is intended for general circulation only and does not take into account the specific investment objectives, financial situation or particular needs of any particular person. The products mentioned in this report may not be suitable for all investors and a person receiving or reading this report should seek advice from a professional and financial adviser regarding the legal, business, financial, tax and other aspects including the suitability of such products, taking into account the specific investment objectives, financial situation or particular needs of that person, before making a commitment to invest in any of such products.
This report is not intended for distribution, publication to or use by any person in any jurisdiction outside of Singapore or any other jurisdiction as Phillip Securities Research may determine in its absolute discretion.
IMPORTANT DISCLOSURES FOR INCLUDED RESEARCH ANALYSES OR REPORTS OF FOREIGN RESEARCH HOUSE
Where the report contains research analyses or reports from a foreign research house, please note:

Glenn covers the Banking and Finance sector. He has had 3 years of experience as a Credit Analyst in a Bank, where he prepared credit proposals by conducting consistent critical analysis on the business, market, country and financial information. Glenn graduated with a Bachelor of Business Management from the University of Queensland with a double major in International Business and Human Resources.
