
Investment Thesis
Slow oil market recovery amid a lacklustre near-term outlook. In retrospect, oil price plunged from over US$100/bbl since mid of 2014 and trended downward for the whole 2015. The deterioration continued to Jan 2016 and logged a 12-year low at just under US$30/bbl. Thereafter, the oil price has recovered to the current level at around US$50/bbl. Fundamentally, the supply glut still exists and is expected to ease only by end of 2017.
Currently, the offshore and marine sector is facing a cyclical downturn, awaiting to revive in 2017 or 2018
Investment Actions
We initiate on SMM with a “Sell” rating and a target price of SG$1.16 based on 12.2x FY16E P/E, which implies a downside of 21.9%.
Company Background
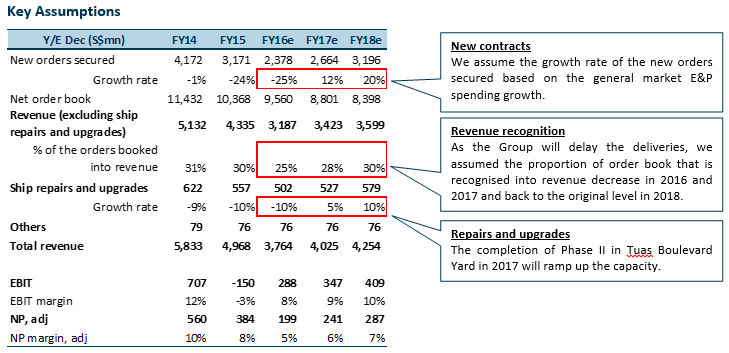
To enhance its market position in the O&M industry, the Group constantly undergoes transformation. With the establishment of the Tuas Boulevard Yard to cater for ship building, repairmen, and upgrades, coupled with the further investment in near-shore floating production terminals, the Group could capture the upward momentum of natural gas demand.
Company Background
Investment Thesis
In retrospect, oil price plunged from over US$100/bbl since mid of 2014, and trended downward for the whole 2015. The deterioration continued into Jan 2016, when it found a new low at under US$30/bbl, a level not seen since November 2003. Thereafter, the oil price has bucked the trend, recovering to the current level at around US$50/bbl.
Essentially, oil price is determined by the forces of supply and demand, and is very sensitive to any imbalances. The violent price swing was attributed to other factors, such as sluggish world economic growth, disagreement of energy policies within energy exporting countries, and growing trend for alternative energy (increasing efforts to expand the application of non-fossil energy). Nonetheless, it all boiled down to the supply glut caused by US shale-oil production which has significantly impacted the overall oil market.
According to the OPEC Monthly Oil Market Report (MOMR) 2016, the world oil demand in 2016 is estimated to be 94.18mb/d with 1.2% YoY growth. Deducting the supply amount of 62.69mb/d from non-OPEC and OPEC NGLs, the shortage is estimated to be 31.49mb/d. However, OPEC failed to reach the consensus to limit the output between the range of 31.8mb/d to 32.5mb/d in early June 2016. With the current output level has been above the limit range, maintaining at around 32.8mb/d, the OPEC supply in 2016 will be more than the shortage, causing the glut to persist until year end. Similarly, Energy Information Administration’s (EIA) short-term energy outlook (STEO) published in June, also projected the excess oil supply to remain in 2017, referring to Figure 2.
Figure 1. Supply/demand balance for 2016, mb/d
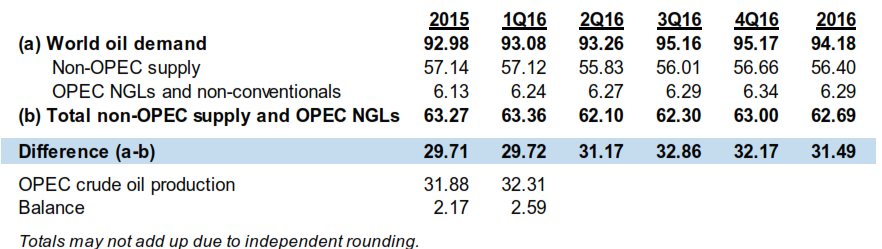
Source: MOMR June
Figure 2. World liquid fuels production and consumption balance
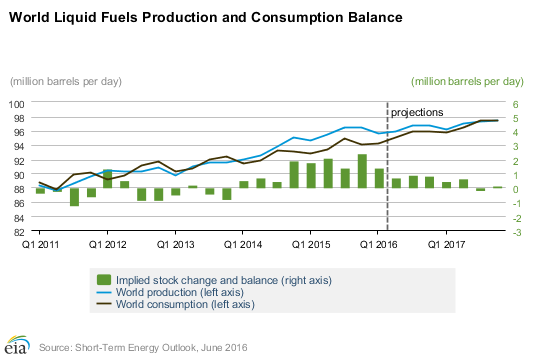
The narrowing spread offers some tentative hope to the global oil market recovery. Based on the forecast, total world oil production is estimated to be 96.23mb/d and 97.02mb/d respectively. Correspondingly, the respective world oil consumption in 2016 and 2017 is estimated to be 95.26mb/d and 96.73mb/d, leaving 0.97mb/d and 0.29mb/d spread in this year and the following.
In a nutshell, though oil supply and demand balance is expected to improve by next year end, but as long as the surplus oil supply prevails, oil price still has a long way to go before reverting to its peak level seen in 2007-08 and 2010-14, where oil price was consistently above US$90/bbl. According to the guidance from World Bank and IMF, oil price will sustain within the band of US$56/bbl to US$67/bbl by 2018, referring to Figure 3.
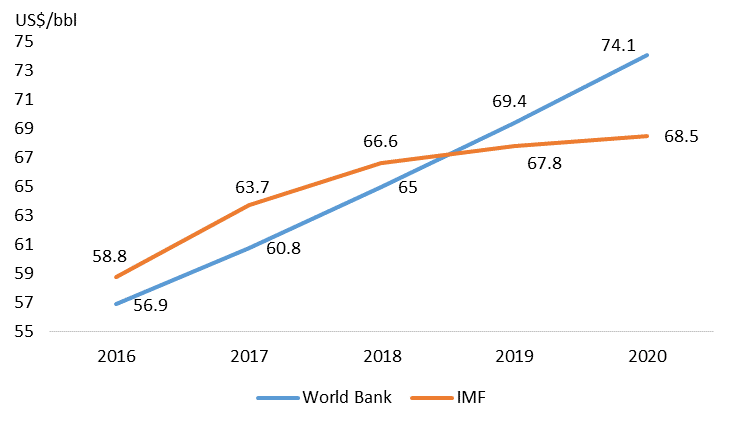
Source: World Bank, IMF, PSR
2. Currently, the offshore and marine sector is still facing a cyclical downturn, impending to revive only in 2017 or 2018
Generally, there are two subsectors in O&M industry: 1) offshore wind energy, and 2) offshore oil and gas. The former is the relatively novel sector with advanced technology requirement, which is engaged in recyclable wind resources. According to Global Wind Energy Council, as of 2015, the installed capacity from offshore wind sector reached 12.107MW, taking up only 3% of global wind capacity, implying more room for it to develop. On the other hand, the offshore oil and gas remains the major player in power production – hence, we will focus more on analysing this subsector.
The oil price plunge set a gloomy tone on O&M market, particularly the upstream sectors. Not only it weighed on the profit margins of oil producers (e.g. Shell, ExxonMobil and BP), it also deteriorated the prospect of oil field services and equipment providers (e.g. Transocean, Seadrill, and Diamond offshore) – due to sluggish new demand growth, as well as the existing orders postpone and default. Since the unexpected oil rout, most orders or development strategies that were made at the peak of the cycle have now become obsolete. Furthermore, given their capital- and labour-intensive nature, it is difficult for companies to make timely adjustments to deal with the volatile oil market. Therefore, it may take years for the O&M market to recover.
Referring to Figure 4, we compared the world’s total rig count (released by Baker Huges) with the crude oil price trend from 2011 to year to date. The highly positive correlation is conspicuous. Prior to oil market downturn, the oil price remained at US$80/bbl and above, while the average number of operating rigs worldwide was more than 3,300. However, we see a paradigm shift when oil price went into a free fall – rig count maintained at a stable level with 6 months lag. This evidenced the industry’s slow adjustment to low oil price environment.
The cutback of rig count only started to occur when oil price had already dipped by 50% from its high at over US$100/bbl to around US$50/bbl. Right after a slight rebound in 1Q15, the oil price continued to drop further. Similarly, rig counts started to decrease with 3 months lag.
Figure 4. World rig counts and oil price trend
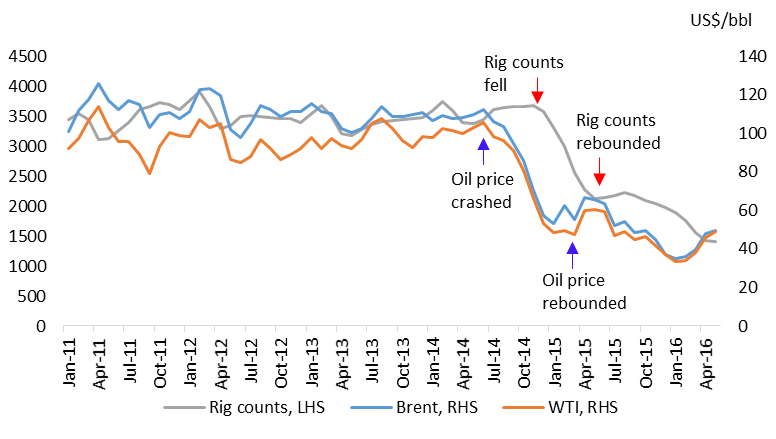
Source: Baker Hughes, PSR
Another sign showing a lacklustre outlook is the facility’s utilisation rate. As shown in Figure 5 and 6, the respective utilisation rate of semisubmersible, drillship, and jack-up have dropped to new lows as of May 2016, due to soft demand. The continuing low utilisation rate could trigger more delays in newbuild delivery, as well as more order and contract cancellations.
Only when the oil price stabilises at a profitable level for those drillers, and they are operating at close to full capacity simultaneously, then a new uptrend of orders and deliveries could be formed.
Figure 5 & 6. Supply, Demand, and Utilisation
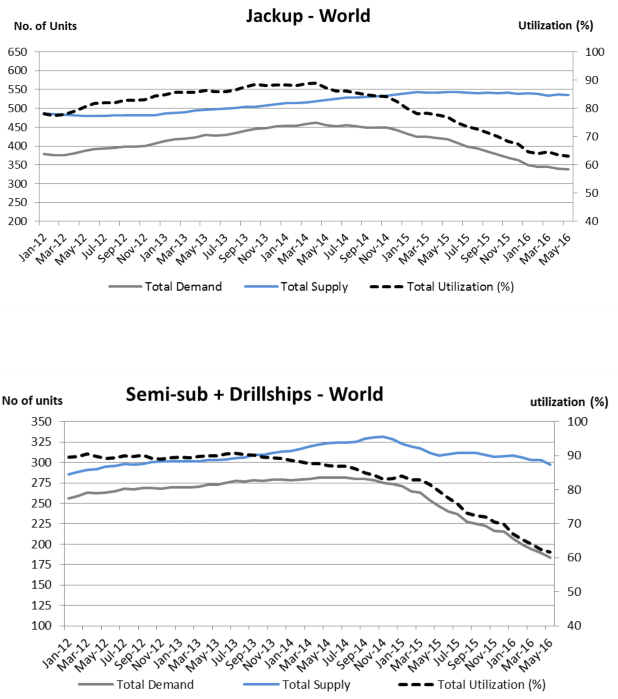
Source: Offshore Summary May 2016, Lorentzen & Stemoco
Referring to Figure 7, the amount of upstream exploration and production (E&P) spending has been increasing over a decade before it reached its peak at US$202bn in 2014. The budget reduction is estimated to continue in 2016. However, the 2017 investment scale in offshore E&P is projected to return to the same level as seen in 2015, and continue to grow afterwards, based on the expectation that the spread between supply and demand will narrow. In other words, 2016 is the year that the investment cycle would hit the trough, and to bottom out in 2017.
Figure 7. Offshore E&P spending by region
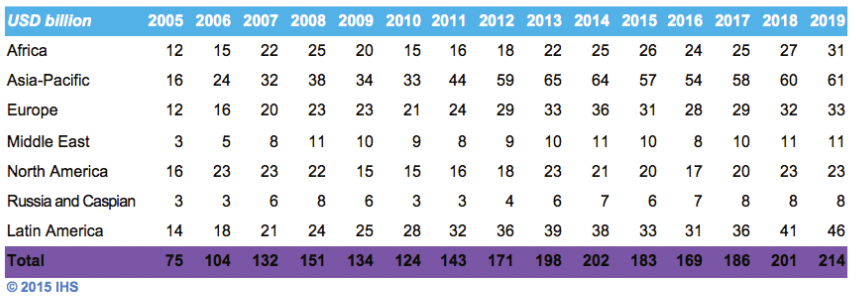
Source: IHS
According to McKinsey Energy Insights, the sectoral medium-term outlook from 2017 to 2025 is positive. It cited a major trend of new generation of higher specification rigs displacing old lower specification rigs. Currently, 50% of the total jack-up rig fleet is over 30 years old, which is beyond its average life. As older rigs retire gradually, the market is being balanced accordingly. Based on the estimation, there will be over 120 new jack-ups delivering into the market with 1% growth annually to 2025. As for the deepwater segment, according to Doulas-Westwood (DW), the total capex over the period of 2016 to 2020 is estimated to be US$137bn with -6% CAGR. The contraction is expected to continue till 2018, before begin to increase gradually in 2019.
To draw a conclusion, the market will continue to be pressured by the low oil price environment in near-term, but it should benefit from the oil rig displacements in the medium- and long-term.
Floating production systems comprise of floating, production, storage, and offloading vessels (FPSO), floating liquefied natural gas vessels (FLNG), mobile offshore production unit (MOPU), and so forth. The advantages of these units are flexibility and cost-effective comparing to those fixed drilling platforms.
According to Energy Maritime Associates (EMA), 17 contracts of floating production systems with a total value of US$7bn were awarded in 2015. There were 6 orders from LNG-related units, and it was the first time that the number exceeded those of FPSOs, which was only 4 orders, representing the 20 years historically lowest level. Meanwhile, 26 units were idle without contracts, and they would be scrapped, redeployed, and delayed, referring to Figure 8.
Figure 8. FPS System Awarded from 1997 to 2015
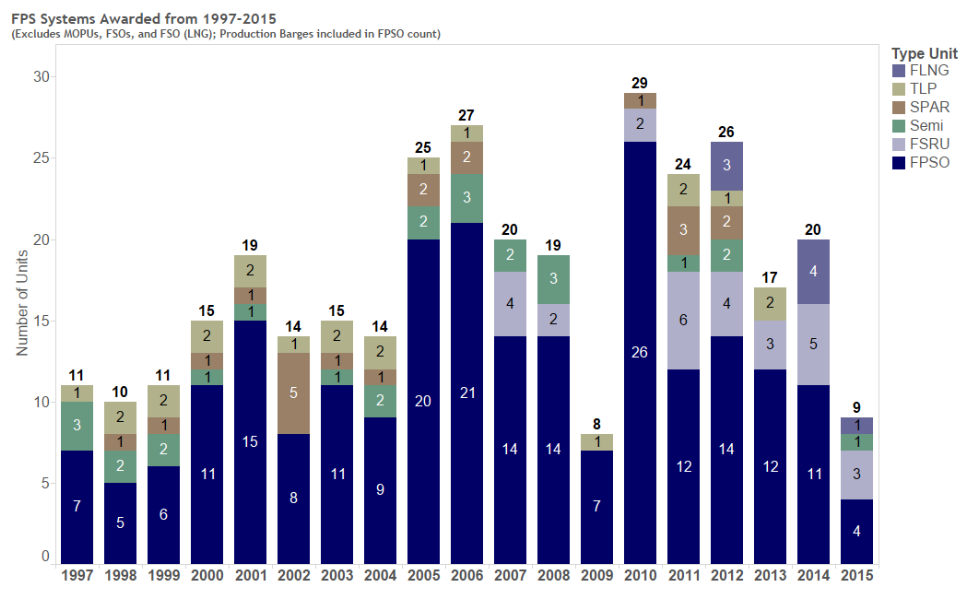
Source: EMA
In 1Q16, EMA reported that no order has been placed since Jul 2015, and 9 more units were idle without the contract since last year end. Based on its estimation, 27 floating production units are about to be off from operation over the next 12 to 20 months. Since the E&P activities has been muted, the segment will be on a survival mode for the market players. However, EMA assumes that 28 new projects could be awarded by 2017.
Referring to Figure 9, according to Douglas-Westwood, between 2016 and 2020, the global expenditure on installations is expected to reach US$58bn, and capex on FSPOs will account for 79% of the total capex.
In addition, McKinsey Energy Insights expects more than 200 new floaters to operate by 2025 with 5% growth per annum from 2017 to 2025. In other words, the market could bottom out in 2017, favouring the operators to deploy newbuilds in lower costs.
Figure 9. Expenditure on FPS units
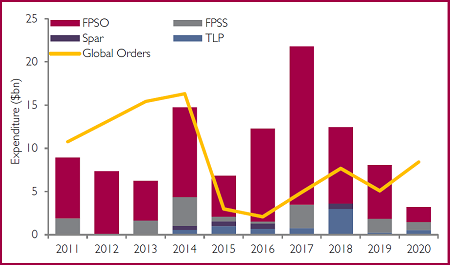
Source: Douglas-Westwood
Different from commodity shipping vessels, OSVs mainly provide specialised E&P services such as drilling, pipeline establishment, storage, and so forth. There are three main types of OSVs, namely anchor handling tug supply (AHTS), construction support vessel (CSV), and platform supply vessel (PSV).
As previously discussed, subject to the weak global E&P activities, the mismatch between supply and demand among OSV markets enlarged since mid-2014. Referring to Figure 10, prior to Jul 2014, the gap between supply and demand of OCV vessel days maintained at around 7,500, and the utilisation rate hovered within 60% to 70%. Considering the oil price (Brent) was at US$100/bbl during that period, we assume that this is the relatively balanced market status. However, as of May 2016, the gap was enlarged, arriving at 17,000 days, with the utilisation rate dropped below 50%.
Figure 10. OCV Activity
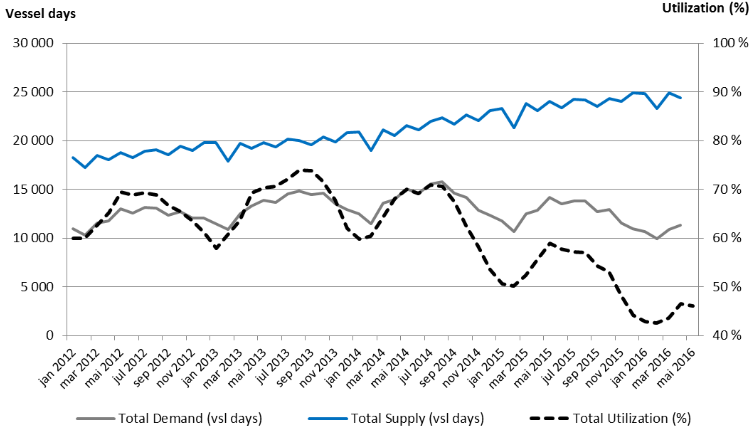
Source: Offshore Summary May 2016, Lorentzen & Stemoco
Similarly, oversupply issue has also affected the PSV and AHTS segment, referring to Figure 11. Total supply of PSV and AHTS has been increasing until last year end, but the demand didn’t keep pace with the supply since it peaked at mid of 2014. As a result, the utilisation rate dipped to a new low below 50% as well. Over the 8 years track record, we think that the global effective demand for PSA and AHTS is around 1,000, and given the average normalised utilisation rate ranges from 60% to 70%, the corresponding balanced supply should be around 1,600 to 1,700.
Figure 11. PSV and AHTS Activity
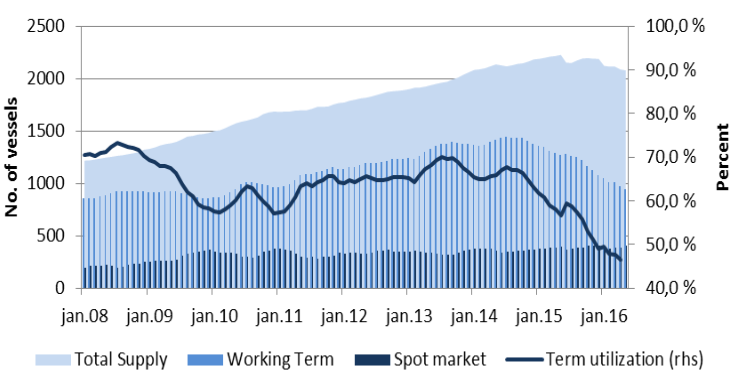
Source: Offshore Summary May 2016, Lorentzen & Stemoco
Clarkson Research 2016 mentioned that there were 476 units of PSV and AHTS in the order book to be delivered, and the insufficient demand cannot meet such a level of supply within OSV market in the coming 5 years. Therefore, the operators have to go through a longer than expected challenging period and endure a slow recovery.
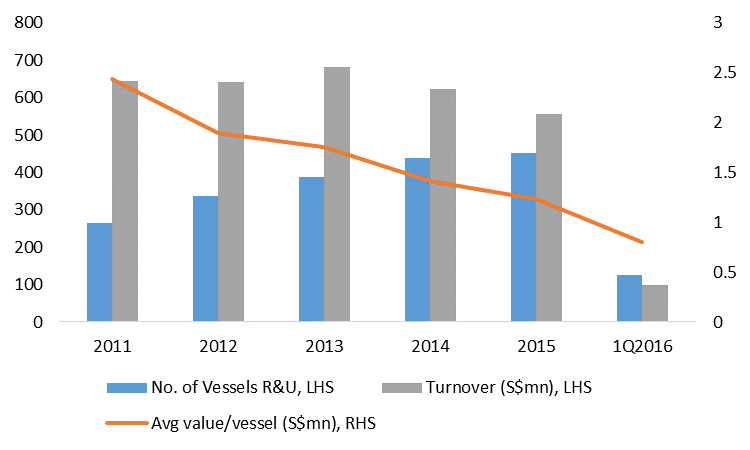
According to the Maritime and Port Authority of Singapore (MPA), the number of vessels call for repair has been decreasing since it peaked in 2010, and it dropped to 4,141, the 9-year low, in 2015. Going forward into 2016, the number totalled at 1,538, dropping by 22% YoY in the first 4 months, referring to Figure 12. We estimate that the number of ships calls for repair could further decrease by 20% YoY. As far as the weights of the repaired ships, referring to Figure 13, the tonnage did not show the obvious downtrend. Even during the past 2 years, it remained at more than 40mn gross tonnes (mgt). Therefore, it indicated that Singapore shipyards have been ramping up the capacity for larger sized vessels repair. However, tonnage count in 4M2016 dropped by 25% YoY to 9.3 mgt, due probably to the lower shipping activities that lead to lower demand for ships repair.
Figure 12. Number of vessels call for repair
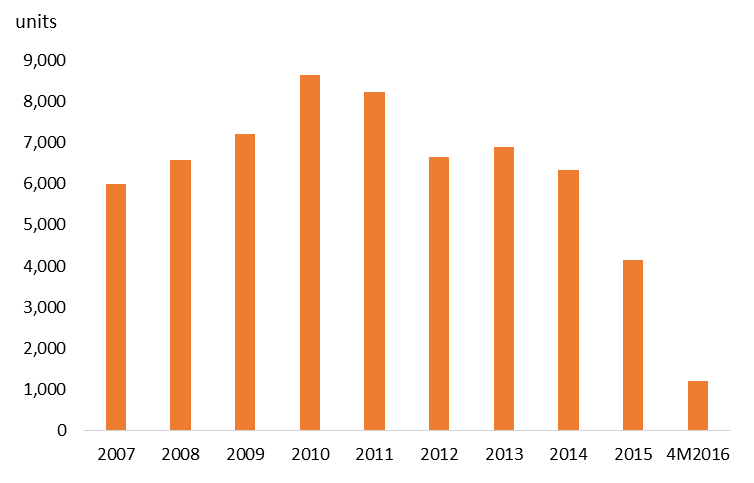
Source: MPA, PSR
Figure 13. Weight of vessels call for repair
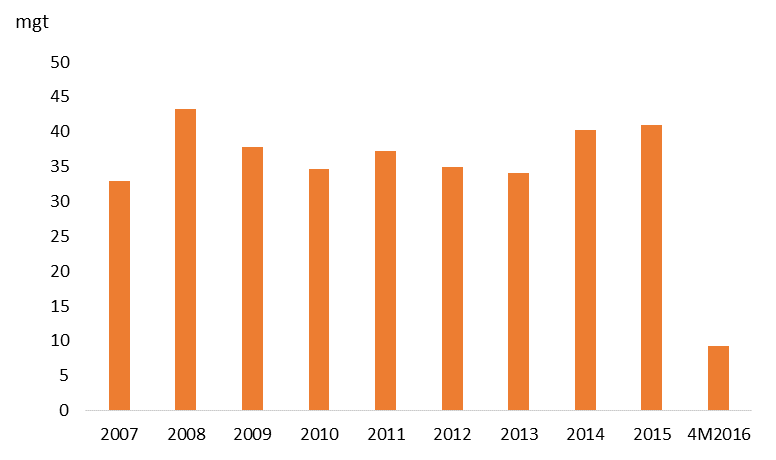
Source: MPA, PSR
Investment Merits
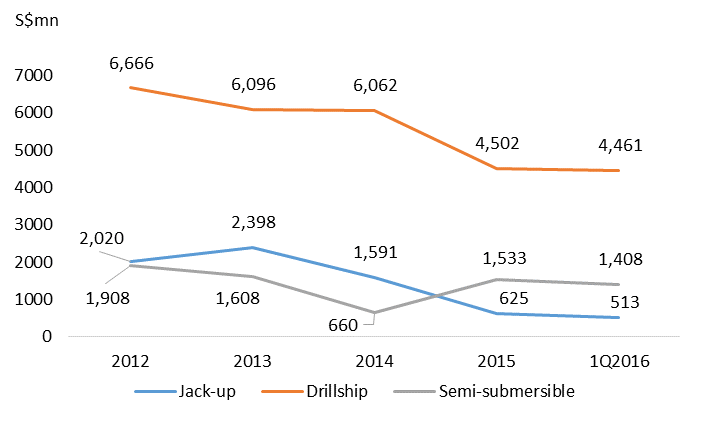
In 2012, SMM entered the new segment, drillship, together with jack-ups and semi-submersibles, diversifying its product mix in the rig building segment. Referring to Figure 14, the number of new contracts secured in a year have been substantially declining over the past four years. Therefore, since the order book is progressively recognised into revenue based on the percentage of project completion w ith lower replenishment of new contracts, the backlog by the year end also dwindled, as shown in Figure 15.
On average, the respective costs of a jack-up and a semi-sub/drillship are US$200mn and US$600mn-US$700mn. As of Dec, around 20% of the order book were on back-ended payment terms, and the rest were subject to 30% of upfront payment terms.
Figure 14. Contracts secured by year
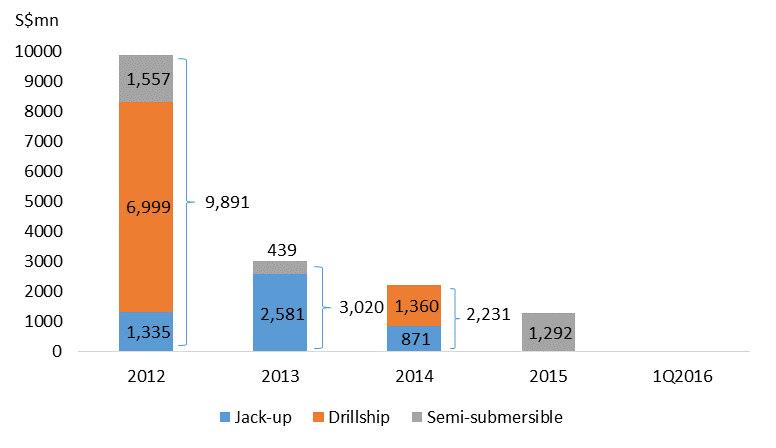
Figure 15. Rig building net order book
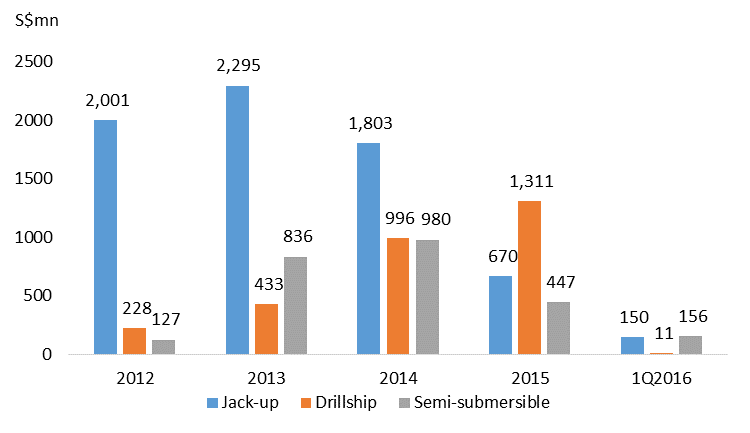
Not only the capex of the newbuilds dropped sharply in the upstream sectors as mentioned previously, but also some oil producers that suffered from solvency issues due to low oil price defaulted on the signed contracts. In Nov 2015, Marco Polo Marine unilaterally terminated the rig orders valued at US$214mn (S$290mn). In 1Q16, there were still 7 drillship units under work-in-progress for Sete Brasil, which filed for bankruptcy in Apr 2016. In the worst scenario that if all these contracted were terminated, the order book would have been cut by US$2.29bn (S$3.2bn). Though SMM had pursued the claim against Marco Polo Maine and made impairment and provision of S$329mn related to Sete Brasil’s projects, the everlasting market downturn will trigger more unexpected defaults from the SMM’s counterparties. However, SMM has worked with clients to extend the delivery and payment period in order to relief clients’ pressure. Generally, the time frames to complete the construction of a jack-up and a semi-sub/drillship are up to 24 months and up to 30 months, respectively. The current backlog is expected to be delivered by 2020. As a result, the recognised revenue sank, referring to Figure 16.
Figure 16. Turnover by year
 2. Floaters and offshore platform segments remain resilient
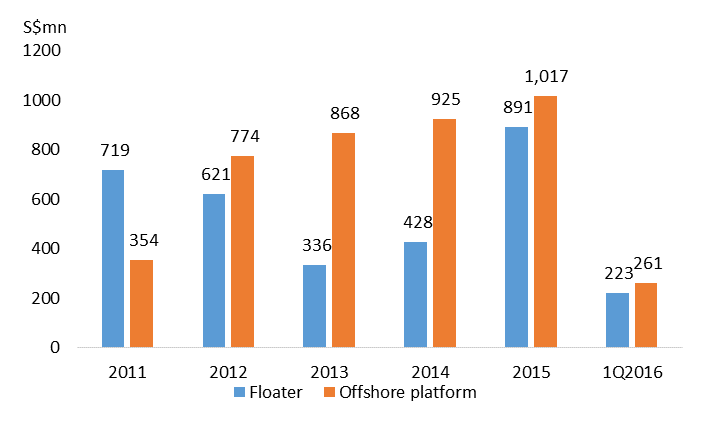
As of 1Q16, the net order book value of floater and offshore platform each accounted for 17% of the total backlog. Referring to Figure 17, the two segments each managed to secure more than S$1bn contracts in every 2 years from 2012 to 2015, which replenished the net order book stably. As shown in Figure 18 and 19, the turnovers of each segment both displayed upswing momentum amid the downtrend of oil price, and the backlog decreased accordingly. As of 1Q16, each segment has 1 project under planning and engineering stage. Given the current net order book level, we estimate that both segments could maintain the stable performance in this and next year without substantial drop even if SMM fails to secure big contracts.
Figure 17. Contracts secured by year
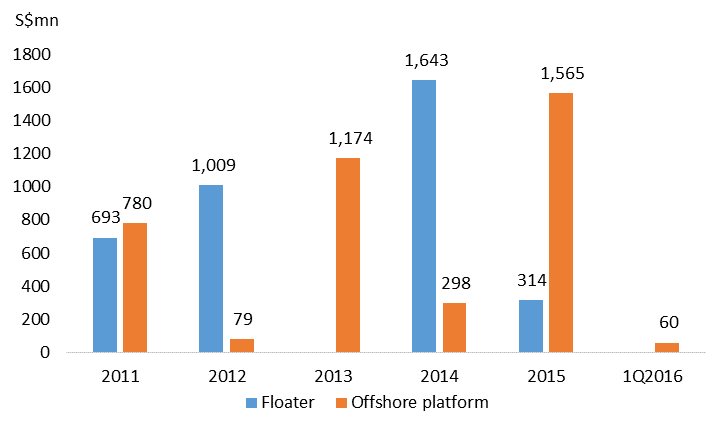
Figure 18. Floater and offshore platform net order book
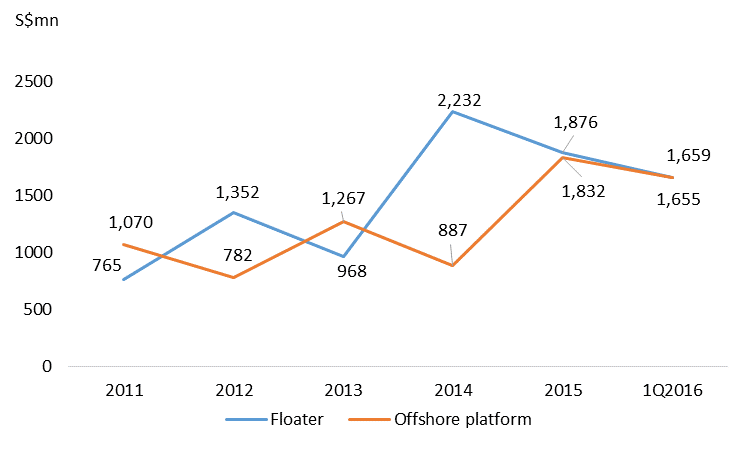
Figure 19. Turnover by year
 3. Ship repairs & upgrades segment is under downward pressure
Referring to Figure 20, the segment revenue stepped down by 8.7% YoY in 2014 and 10.5% YoY in 2015 since its peak in 2013. Though the vessels docked for repair and upgrade kept increasing, the downswing of average revenue earned per unit dragged down the whole segment performance. The situation was due mainly to the increasingly fierce competition not only within ASEAN region but also from Korea and China shipyards. However, the Group is poised for the upside momentum in the LNG repairs and upgrades. In FY15, SMM had 34 LNG related vessels repaired and upgraded, which was the highest number globally.
Figure 20. Vessel repairs and upgrades
(Note: SMM did not disclose the number of vessels repaired and upgraded in 2013, so we made an estimate of the average of numbers of 2012 and 2014)
Source: Company, PSR
How Do We View SMM?
In the face of the challenging environment, SMM is also under difficult operation
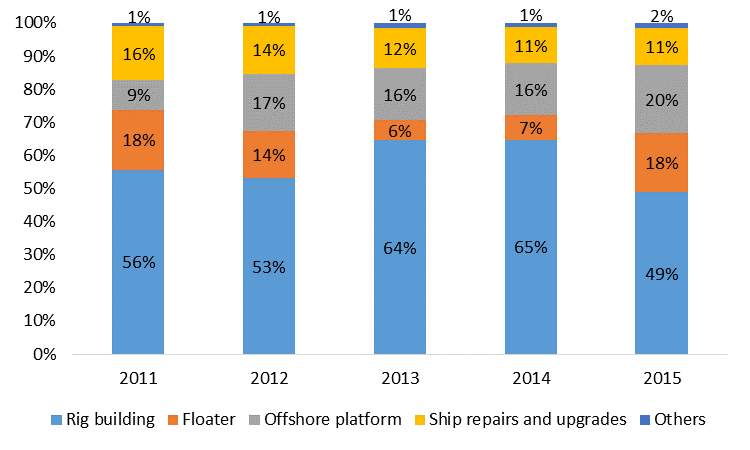
Referring to Figure 21, the product mix over the past five years showed that the main revenue contributor is still rig building segment. Since the upstream E&P capex is freezing, SMM will focus more on the current backlog, enhancing the capability to deliver the projects and collect the rest of the payments. On the condition that the oil price recovers to above US$80 by the end of 2017 and stabilises at such a level, it will signal the end of the trough of the cycle.
With the dynamic balance of oil supply and demand, the offshore oil fields equipment market is also balancing. Moreover, around 50% of the current rigs in the market have worked over 25 years, thus the wave of decommissioning and replacement will bring a market boom in the foreseeable future. Therefore, we think the market is going to form a U-shape curve, but the bottom of the U-curve could last from 3 to 5 years. Accordingly, SMM has a negative outlook in this and next year, but the business should turn better onwards.
Figure 21. Segment breakdown
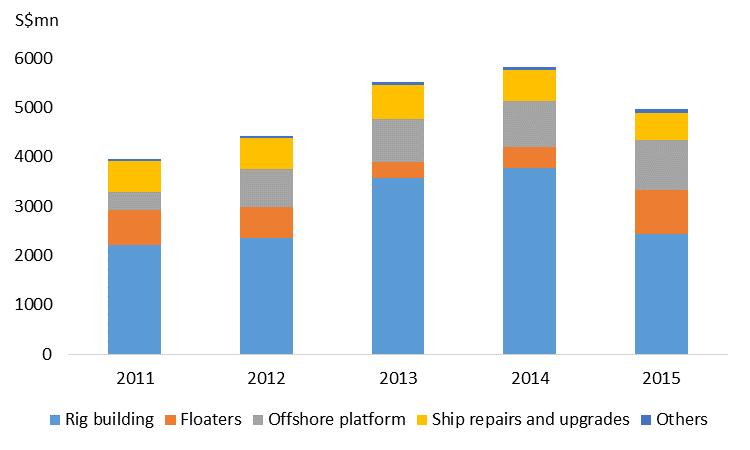
Source: Company, PSR
More stringent cost control is necessary for the survival mode
SMM has adopted various cost reduction and rationalization measures.
Firstly, the Group managed to take steps to match the labour force to the workload of the current order book, including headcount reduction, reallocation, and sub-contractors optimisation.
Secondly, through Sembmarine SSP, a subsidiary specialises in the design, engineering, drilling and delivery solutions, SMM can promote the self-design projects without hiring the third party designer in order to increase the profit margin. In Jun 2016, it acquired 50% interest in KANFA Aragon AS to improve the capability in tailored design and solutions. According to the management, the gross profit margin of self-design can be up to 20%.
Lastly, it strategically established a new highly automated steel fabrication facility on the Phase II marine work of Tuas Boulevard Yard. The facility can streamline the production process, and it reduces the dispatch costs among the building, repairing, and upgrading work.
It’s a good time for M&As
The tide of the bankruptcy of those failed to get through the current tough period has emerged. The valuable assets owned by those builders or operators who are forced out of the market will be up for grab. SMM can leverage the opportunity of seeking for undervalued assets such as PP&E, talents, and technology. Meanwhile, SMM could also divest redundancies to further optimise the corporate structure, as well as replenish cash on hand.
Valuation Methodology
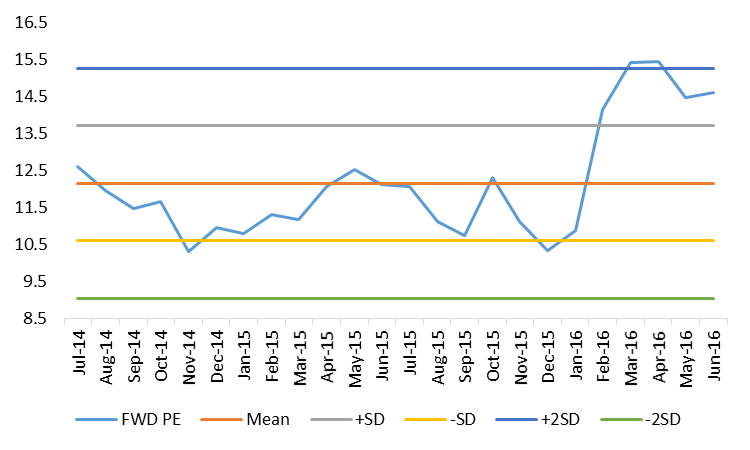
Our primary valuation method is using the simple average of the forward P/E ratio during the oil market crash from Jul 2014 till now. We think that the market sentiment has been factored into the forward P/E since SMM’s price is highly correlated to the oil price, which fluctuated along with the market events closely.
Figure 22. 12-month forward P/E
Source: Bloomberg, PSR
Currently, SMM is trading at a forward 12-month P/E of 14.6x, which is between the range of +1 S.D. and +2 S.D. of its historical mean. We think the average P/E of 12.2x as the base multiple is reasonable because SMM will still see near-term pressure in this year.
We initiate SMM with a Sell rating and a target price is $1.16, based on estimated 9.5 Singapore cents FY16 EPS and a P/E ratio of 12.2x. This implies a downside of 24.9% (including dividends) from the last closing price.
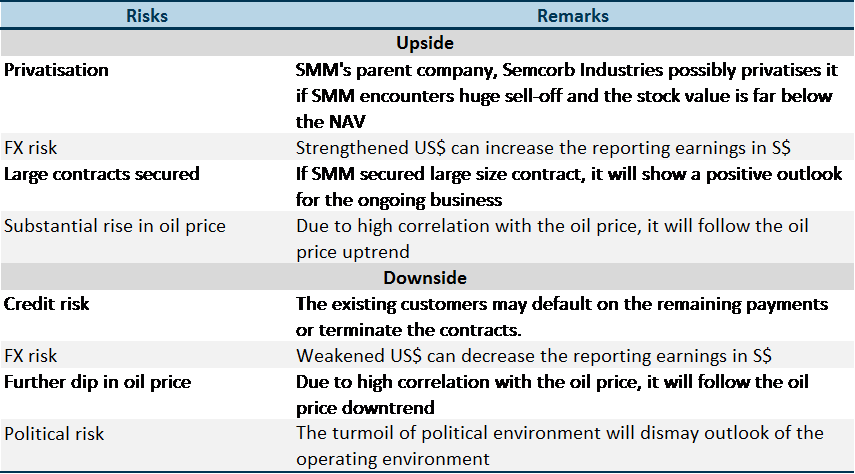
Investment Risks
Here we list the key risks for consideration:
Important Information
This report is prepared and/or distributed by Phillip Securities Research Pte Ltd ("Phillip Securities Research"), which is a holder of a financial adviser’s licence under the Financial Advisers Act, Chapter 110 in Singapore.
By receiving or reading this report, you agree to be bound by the terms and limitations set out below. Any failure to comply with these terms and limitations may constitute a violation of law. This report has been provided to you for personal use only and shall not be reproduced, distributed or published by you in whole or in part, for any purpose. If you have received this report by mistake, please delete or destroy it, and notify the sender immediately.
The information and any analysis, forecasts, projections, expectations and opinions (collectively, the “Research”) contained in this report has been obtained from public sources which Phillip Securities Research believes to be reliable. However, Phillip Securities Research does not make any representation or warranty, express or implied that such information or Research is accurate, complete or appropriate or should be relied upon as such. Any such information or Research contained in this report is subject to change, and Phillip Securities Research shall not have any responsibility to maintain or update the information or Research made available or to supply any corrections, updates or releases in connection therewith.
Any opinions, forecasts, assumptions, estimates, valuations and prices contained in this report are as of the date indicated and are subject to change at any time without prior notice. Past performance of any product referred to in this report is not indicative of future results.
This report does not constitute, and should not be used as a substitute for, tax, legal or investment advice. This report should not be relied upon exclusively or as authoritative, without further being subject to the recipient’s own independent verification and exercise of judgment. The fact that this report has been made available constitutes neither a recommendation to enter into a particular transaction, nor a representation that any product described in this report is suitable or appropriate for the recipient. Recipients should be aware that many of the products, which may be described in this report involve significant risks and may not be suitable for all investors, and that any decision to enter into transactions involving such products should not be made, unless all such risks are understood and an independent determination has been made that such transactions would be appropriate. Any discussion of the risks contained herein with respect to any product should not be considered to be a disclosure of all risks or a complete discussion of such risks.
Nothing in this report shall be construed to be an offer or solicitation for the purchase or sale of any product. Any decision to purchase any product mentioned in this report should take into account existing public information, including any registered prospectus in respect of such product.
Phillip Securities Research, or persons associated with or connected to Phillip Securities Research, including but not limited to its officers, directors, employees or persons involved in the issuance of this report, may provide an array of financial services to a large number of corporations in Singapore and worldwide, including but not limited to commercial / investment banking activities (including sponsorship, financial advisory or underwriting activities), brokerage or securities trading activities. Phillip Securities Research, or persons associated with or connected to Phillip Securities Research, including but not limited to its officers, directors, employees or persons involved in the issuance of this report, may have participated in or invested in transactions with the issuer(s) of the securities mentioned in this report, and may have performed services for or solicited business from such issuers. Additionally, Phillip Securities Research, or persons associated with or connected to Phillip Securities Research, including but not limited to its officers, directors, employees or persons involved in the issuance of this report, may have provided advice or investment services to such companies and investments or related investments, as may be mentioned in this report.
Phillip Securities Research or persons associated with or connected to Phillip Securities Research, including but not limited to its officers, directors, employees or persons involved in the issuance of this report may, from time to time maintain a long or short position in securities referred to herein, or in related futures or options, purchase or sell, make a market in, or engage in any other transaction involving such securities, and earn brokerage or other compensation in respect of the foregoing. Investments will be denominated in various currencies including US dollars and Euro and thus will be subject to any fluctuation in exchange rates between US dollars and Euro or foreign currencies and the currency of your own jurisdiction. Such fluctuations may have an adverse effect on the value, price or income return of the investment.
To the extent permitted by law, Phillip Securities Research, or persons associated with or connected to Phillip Securities Research, including but not limited to its officers, directors, employees or persons involved in the issuance of this report, may at any time engage in any of the above activities as set out above or otherwise hold an interest, whether material or not, in respect of companies and investments or related investments, which may be mentioned in this report. Accordingly, information may be available to Phillip Securities Research, or persons associated with or connected to Phillip Securities Research, including but not limited to its officers, directors, employees or persons involved in the issuance of this report, which is not reflected in this report, and Phillip Securities Research, or persons associated with or connected to Phillip Securities Research, including but not limited to its officers, directors, employees or persons involved in the issuance of this report, may, to the extent permitted by law, have acted upon or used the information prior to or immediately following its publication. Phillip Securities Research, or persons associated with or connected to Phillip Securities Research, including but not limited its officers, directors, employees or persons involved in the issuance of this report, may have issued other material that is inconsistent with, or reach different conclusions from, the contents of this report.
The information, tools and material presented herein are not directed, intended for distribution to or use by, any person or entity in any jurisdiction or country where such distribution, publication, availability or use would be contrary to the applicable law or regulation or which would subject Phillip Securities Research to any registration or licensing or other requirement, or penalty for contravention of such requirements within such jurisdiction.
This report is intended for general circulation only and does not take into account the specific investment objectives, financial situation or particular needs of any particular person. The products mentioned in this report may not be suitable for all investors and a person receiving or reading this report should seek advice from a professional and financial adviser regarding the legal, business, financial, tax and other aspects including the suitability of such products, taking into account the specific investment objectives, financial situation or particular needs of that person, before making a commitment to invest in any of such products.
This report is not intended for distribution, publication to or use by any person in any jurisdiction outside of Singapore or any other jurisdiction as Phillip Securities Research may determine in its absolute discretion.
IMPORTANT DISCLOSURES FOR INCLUDED RESEARCH ANALYSES OR REPORTS OF FOREIGN RESEARCH HOUSE
Where the report contains research analyses or reports from a foreign research house, please note:

Guangzhi graduated from Singapore Management University with a Master degree in Applied Finance and from South China University of Technology with a Bachelor degree in Electronic Commerce.
The current sector coverages include Energy, Utilities, and Mining sectors. He has 3 years experience in equity research in both Hong Kong and Singapore market. He is the mandarin spokesperson for Phillip Securities Research in relation to China-related projects and all mandarin seminars and client events.
