
Company Background
Salesforce (CRM) is one of the key cloud-based enterprise software solutions provider, with a focus on customer relationship management (CRM). The company currently has over 150,000 paid customers globally that depend on its software solutions to manage sales, customer service, marketing, and analytics (Figure 1).
Investment Merits
We initiate coverage with a BUY rating. Our target price is US$258 based on a DCF valuation with a WACC of 6.1% and terminal growth of 4.0%.
REVENUE
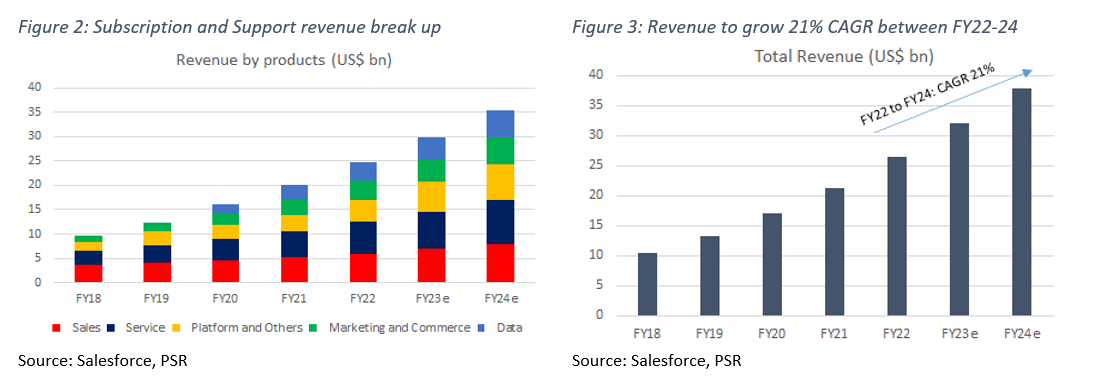
Salesforce has two revenue segments: Subscription and Support (93% of FY22 revenue) and Professional services and others (7%). Subscription and Support revenues include subscription fees paid by clients that use its enterprise cloud computing services (Sales Cloud, Service Cloud, and Marketing and Commerce), software license-related businesses Tableau and MuleSoft, and technical support. Professional services and others include revenue associated with services such as consulting, deployment, training, and implementation.
Total revenue expanded at 26% CAGR in the past five years (Figure 3). Over FY18-22, Salesforce’s Subscription and Support revenues rose at a CAGR of 26% to US$24.7bn in FY22. The growth was due to a volume-driven surge from new business, including new customers, additional subscriptions from existing customers, upgrades, as well as reduced attrition rate for its services.
The Americas (68% of FY22 revenue) is Salesforce’s biggest market (Figure 4), followed by Europe (23%), and Asia Pacific (9%).
MARGINS
Gross margins averaged 74% in the past five years. This was mainly because Salesforce’s revenue is primarily made up of subscriptions, resulting in a continuous purchasing cycle for customers. Operating margin declined from 4% in FY18 to 2% in FY22 due to the sales & marketing push, rising headcount, and investments in technology. We expect operating margins to be 4% in FY23e and 6% in FY24e.
Net margins in FY22 were 6%, down from 19% the previous year. The change is primarily because the company recognized a tax benefit of US$1.5bn on a pretax income of US$2.6bn in FY21. The tax benefit was associated with intra-entity transfer of intangible property.
BALANCE SHEET
Assets: In FY22, cash and cash equivalents decreased by 12% YoY to US$5.5bn. Marketable securities also decreased by US$700mn. Fixed assets for FY21 were US$5.7bn, up from US$1.9bn in FY18, largely due to ongoing CAPEX spending. The company’s current ratio for FY22 is 1.0x.
Liabilities: Current liabilities for FY21 were US$21.8bn, almost US$4.1bn more than FY21. This increase was mainly due to a rise in accrued expenses and unearned revenue. Non-current liabilities saw a jump of US$8.2bn in FY22. Salesforce had a net debt position of US$5.1bn in FY22 (Figure 5). Salesforce’s debt-to-equity ratio remains low at only 0.2x.
CASH-FLOW
Cash-flow from operations has steadily risen at 23% CAGR to US$6bn (Figure 6) from FY18 to FY22. CAPEX stood at US$0.7bn in FY22, rising at 9% CAGR over FY18-22. In FY22, Salesforce generated US$5.3bn in free cash flow. This translates to a 20% free cash flow margin. Salesforce’s ability to generate significant amounts of cash allows it to acquire firms.
Important Information
This report is prepared and/or distributed by Phillip Securities Research Pte Ltd ("Phillip Securities Research"), which is a holder of a financial adviser’s licence under the Financial Advisers Act, Chapter 110 in Singapore.
By receiving or reading this report, you agree to be bound by the terms and limitations set out below. Any failure to comply with these terms and limitations may constitute a violation of law. This report has been provided to you for personal use only and shall not be reproduced, distributed or published by you in whole or in part, for any purpose. If you have received this report by mistake, please delete or destroy it, and notify the sender immediately.
The information and any analysis, forecasts, projections, expectations and opinions (collectively, the “Research”) contained in this report has been obtained from public sources which Phillip Securities Research believes to be reliable. However, Phillip Securities Research does not make any representation or warranty, express or implied that such information or Research is accurate, complete or appropriate or should be relied upon as such. Any such information or Research contained in this report is subject to change, and Phillip Securities Research shall not have any responsibility to maintain or update the information or Research made available or to supply any corrections, updates or releases in connection therewith.
Any opinions, forecasts, assumptions, estimates, valuations and prices contained in this report are as of the date indicated and are subject to change at any time without prior notice. Past performance of any product referred to in this report is not indicative of future results.
This report does not constitute, and should not be used as a substitute for, tax, legal or investment advice. This report should not be relied upon exclusively or as authoritative, without further being subject to the recipient’s own independent verification and exercise of judgment. The fact that this report has been made available constitutes neither a recommendation to enter into a particular transaction, nor a representation that any product described in this report is suitable or appropriate for the recipient. Recipients should be aware that many of the products, which may be described in this report involve significant risks and may not be suitable for all investors, and that any decision to enter into transactions involving such products should not be made, unless all such risks are understood and an independent determination has been made that such transactions would be appropriate. Any discussion of the risks contained herein with respect to any product should not be considered to be a disclosure of all risks or a complete discussion of such risks.
Nothing in this report shall be construed to be an offer or solicitation for the purchase or sale of any product. Any decision to purchase any product mentioned in this report should take into account existing public information, including any registered prospectus in respect of such product.
Phillip Securities Research, or persons associated with or connected to Phillip Securities Research, including but not limited to its officers, directors, employees or persons involved in the issuance of this report, may provide an array of financial services to a large number of corporations in Singapore and worldwide, including but not limited to commercial / investment banking activities (including sponsorship, financial advisory or underwriting activities), brokerage or securities trading activities. Phillip Securities Research, or persons associated with or connected to Phillip Securities Research, including but not limited to its officers, directors, employees or persons involved in the issuance of this report, may have participated in or invested in transactions with the issuer(s) of the securities mentioned in this report, and may have performed services for or solicited business from such issuers. Additionally, Phillip Securities Research, or persons associated with or connected to Phillip Securities Research, including but not limited to its officers, directors, employees or persons involved in the issuance of this report, may have provided advice or investment services to such companies and investments or related investments, as may be mentioned in this report.
Phillip Securities Research or persons associated with or connected to Phillip Securities Research, including but not limited to its officers, directors, employees or persons involved in the issuance of this report may, from time to time maintain a long or short position in securities referred to herein, or in related futures or options, purchase or sell, make a market in, or engage in any other transaction involving such securities, and earn brokerage or other compensation in respect of the foregoing. Investments will be denominated in various currencies including US dollars and Euro and thus will be subject to any fluctuation in exchange rates between US dollars and Euro or foreign currencies and the currency of your own jurisdiction. Such fluctuations may have an adverse effect on the value, price or income return of the investment.
To the extent permitted by law, Phillip Securities Research, or persons associated with or connected to Phillip Securities Research, including but not limited to its officers, directors, employees or persons involved in the issuance of this report, may at any time engage in any of the above activities as set out above or otherwise hold an interest, whether material or not, in respect of companies and investments or related investments, which may be mentioned in this report. Accordingly, information may be available to Phillip Securities Research, or persons associated with or connected to Phillip Securities Research, including but not limited to its officers, directors, employees or persons involved in the issuance of this report, which is not reflected in this report, and Phillip Securities Research, or persons associated with or connected to Phillip Securities Research, including but not limited to its officers, directors, employees or persons involved in the issuance of this report, may, to the extent permitted by law, have acted upon or used the information prior to or immediately following its publication. Phillip Securities Research, or persons associated with or connected to Phillip Securities Research, including but not limited its officers, directors, employees or persons involved in the issuance of this report, may have issued other material that is inconsistent with, or reach different conclusions from, the contents of this report.
The information, tools and material presented herein are not directed, intended for distribution to or use by, any person or entity in any jurisdiction or country where such distribution, publication, availability or use would be contrary to the applicable law or regulation or which would subject Phillip Securities Research to any registration or licensing or other requirement, or penalty for contravention of such requirements within such jurisdiction.
This report is intended for general circulation only and does not take into account the specific investment objectives, financial situation or particular needs of any particular person. The products mentioned in this report may not be suitable for all investors and a person receiving or reading this report should seek advice from a professional and financial adviser regarding the legal, business, financial, tax and other aspects including the suitability of such products, taking into account the specific investment objectives, financial situation or particular needs of that person, before making a commitment to invest in any of such products.
This report is not intended for distribution, publication to or use by any person in any jurisdiction outside of Singapore or any other jurisdiction as Phillip Securities Research may determine in its absolute discretion.
IMPORTANT DISCLOSURES FOR INCLUDED RESEARCH ANALYSES OR REPORTS OF FOREIGN RESEARCH HOUSE
Where the report contains research analyses or reports from a foreign research house, please note:
