
Market: STI was up 5.4% in April. This was led by financials, which now account for around 40% of the index. This makes STI the most leveraged to the financial sector, vs the 15-20% weights for US and European indices. The macro highlight of the month was the crossing of the 3% Rubicon by 10-year US Treasuries. This – or 3.05% to be precise – technically signifies the end of the 35-year bull market. A rise in bond yields can be greeted positively by equity markets when it flags higher growth expectations. The more pertinent issue is not yields but underlying inflation. It is runaway inflation that we believe is the larger worry, where central banks need to aggressively respond. It was positive that despite hitting its 2% inflation target, the Fed said this target (not cap) could run “symmetrically”, which is to say inflation has equal chances of moving in either direction. We still do not believe inflation will rise dramatically when money supply and velocity remain at multi-year lows.
To us, a more worrying is the USD’s unrelenting rally. Its rise could persist as growth differentials narrow, especially after Europe’s speed bump in economic growth. Another reason for USD strength is the interest-rate differential. We simply have one central bank – the Fed – ending QE while the other two – ECB and BOJ – are still running theirs. A rising USD hurts emerging markets, especially countries that borrow in USD without corresponding USD sources of revenue. Countries which face such a precarious mismatch include Brazil and Turkey. Both currencies have shed 8-9% in the past three months. Closer to home, the Indonesian rupiah is under pressure even after currency intervention by the central bank. The other perennial risk of USD strength is a possible resumption of uncontrollable capital outflows from China. This could rekindle devaluation or deflation fears.
In Singapore, electronic stocks were massively sold down. A number of names were down around 25%. The main trigger was an expected peak in the growth rates of smartphones and consumer products such as e-cigarettes and smart lighting. Absent this sector, we are left with financials and property. We think oil & gas is interesting, but its resurrection could come only at a later stage. While oil prices have rebounded, upstream companies are still hesitant to spend. Wall Street has been rewarding those that have displayed their newfound capex discipline.
Recommendation: Our bottom-up STI target of 3,900 (8% upside) is left intact. Banks should take the lead in stock-market performance. We raised target prices for all three following 1Q18 results. We are Overweight on property stocks as take-up of new launches continues to surprise positively. Developers that can launch earlier will be able to lock in outsized gains. REITs and other yield stocks are beginning to look more appealing. Rising interest rates have largely been priced in, the relative strength of the Singapore dollar is attractive while the domestic economy is gathering steam. Singapore announced GDP growth of 4.3% for 1Q18 – a pleasant surprise since this beat the prior quarter’s 3.6% YoY expansion. Next-generation companies with differentiated products/services is another segment we favour. We have started coverage on one, Y Ventures, and look forward to recommending more.
PHILLIP ABSOLUTE 10 – Our top 10 picks for absolute returns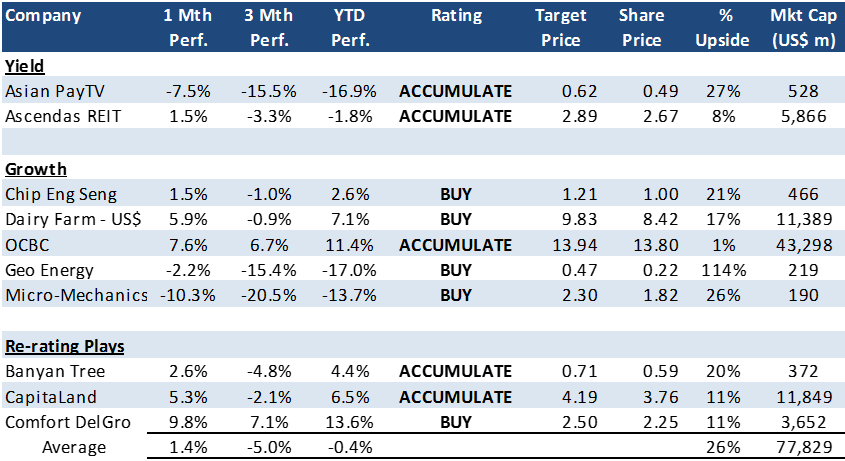
Source: Bloomberg, PSR. Phillip Absolute 10 performance assumes equal weight to every stock in the portfolio. Any change to Phillip portfolio is only conducted at month end. Performance of the portfolio and STI does not take into account gains from dividends.
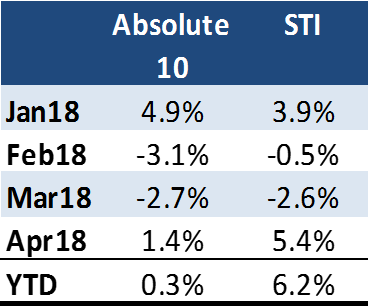
HISTORICAL PERFORMANCE
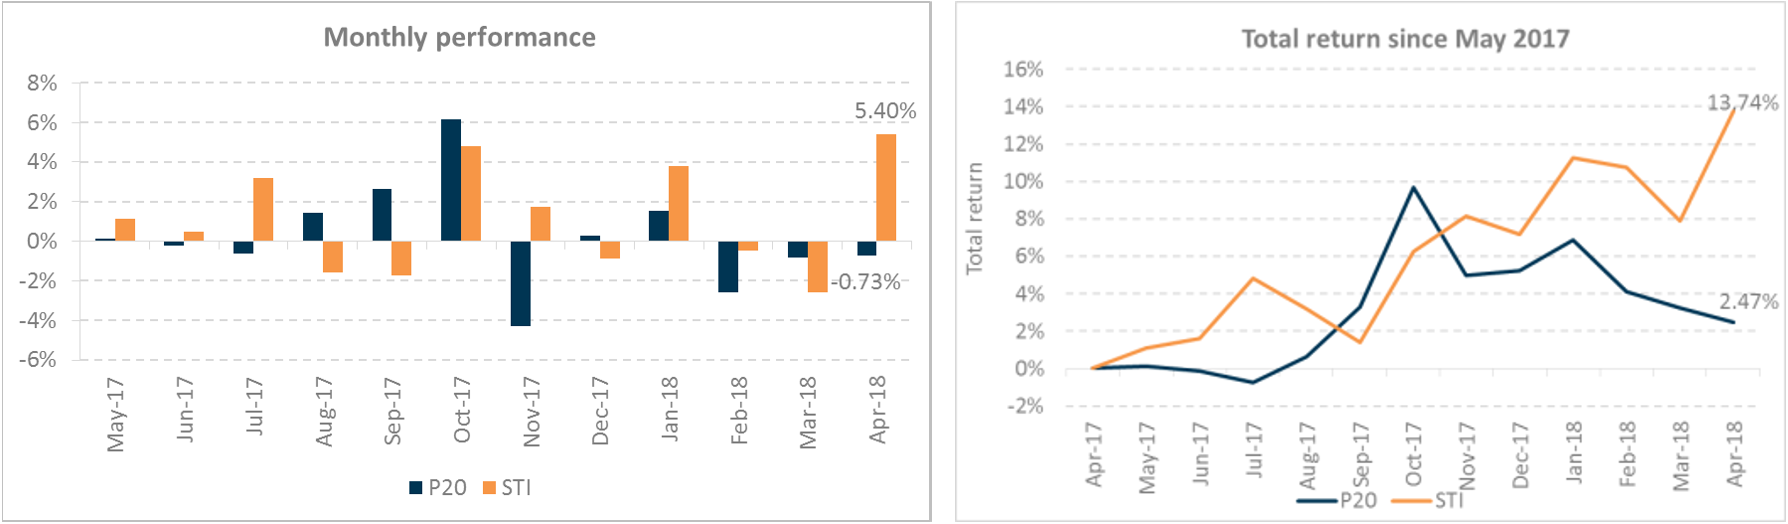
Portfolio Review:
Our inaugural Phillip Absolute 10 Model portfolio began in January. It started well with a rise of 4.9% in January. Banyan Tree and CapitaLand led gains in January. DBS has been a significant contributor to our performance with a gain of 15% for the period of Jan-Feb18. We then switched to OCBC in March due to higher upside to our target price and a beneficiary of higher interest rates (in particular through insurance business). Dragging our YTD performance has been Asia Pay TV and Micro-Mechanics. We still like Asian PayTV for the yield and utility-like nature of the cable business. Micro-Mechanics was caught up in the recent sell-down of all electronics stocks. Our preference for Micro-Mechanics is their ability to carve out a very profitable, 50% plus gross margin, and relatively recurrent business in semiconductor supply chain.
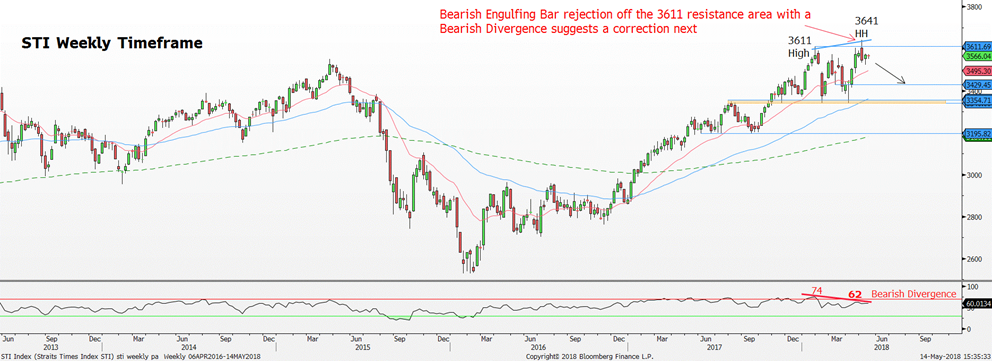
Technical Analysis : Straits Times Index – Bearish Engulfing Bar rejection off the 3611 resistance area
STI Weekly Chart Current Sentiment: Bearish
Source: Bloomberg, Phillip Securities Research Pte Ltd
Red line = 20-period moving average, Blue line = 60-period moving average, Green line = 200 period moving average
April was a remarkable month for the Singapore equity market as the STI was up a whopping +5.4%. To put things into context, the S&P 500 index was up marginally by +0.40% while the Hang Seng Index gained +2.38% in April. All in, with the sharp rise in price action in April, we expect to see some near-term correction in the STI as the current price action is showing some weakness at the 3611 resistance area, which was the January 2018 high. Price did briefly break above the 3611 resistance area in the week ended 04/05/18, but the bullish follow-through was weak. As a result, the STI closed below the 3611 resistance area and actually closed at the week’s low. Thus resulting in the formation of a Bearish Engulfing Bar rejection off the 3611 resistance area in the week ended 04/05/18 signalling for a correction next. Moreover, looking at the Relative Strength Index (RSI) reveals a possible bearish divergence scenario if the 3611 resistance area stays intact shown by the diagonal lines in the chart. In January 2018, the RSI hit an overbought condition high of 74 while the STI formed a high at 3611 points. Fast forward to today, the STI broke a new Higher High (HH) in the week ended 04/05/18 at 3641 points while the RSI formed a Lower High (LH) point at 62 signalling for a bearish divergence. Hence, with the current bearish price action rejection off the 3611 resistance area and a RSI bearish divergence, expect the STI to head into a correction next to test the 3500 psychological round number followed by 3430.
Important Information
This report is prepared and/or distributed by Phillip Securities Research Pte Ltd ("Phillip Securities Research"), which is a holder of a financial adviser’s licence under the Financial Advisers Act, Chapter 110 in Singapore.
By receiving or reading this report, you agree to be bound by the terms and limitations set out below. Any failure to comply with these terms and limitations may constitute a violation of law. This report has been provided to you for personal use only and shall not be reproduced, distributed or published by you in whole or in part, for any purpose. If you have received this report by mistake, please delete or destroy it, and notify the sender immediately.
The information and any analysis, forecasts, projections, expectations and opinions (collectively, the “Research”) contained in this report has been obtained from public sources which Phillip Securities Research believes to be reliable. However, Phillip Securities Research does not make any representation or warranty, express or implied that such information or Research is accurate, complete or appropriate or should be relied upon as such. Any such information or Research contained in this report is subject to change, and Phillip Securities Research shall not have any responsibility to maintain or update the information or Research made available or to supply any corrections, updates or releases in connection therewith.
Any opinions, forecasts, assumptions, estimates, valuations and prices contained in this report are as of the date indicated and are subject to change at any time without prior notice. Past performance of any product referred to in this report is not indicative of future results.
This report does not constitute, and should not be used as a substitute for, tax, legal or investment advice. This report should not be relied upon exclusively or as authoritative, without further being subject to the recipient’s own independent verification and exercise of judgment. The fact that this report has been made available constitutes neither a recommendation to enter into a particular transaction, nor a representation that any product described in this report is suitable or appropriate for the recipient. Recipients should be aware that many of the products, which may be described in this report involve significant risks and may not be suitable for all investors, and that any decision to enter into transactions involving such products should not be made, unless all such risks are understood and an independent determination has been made that such transactions would be appropriate. Any discussion of the risks contained herein with respect to any product should not be considered to be a disclosure of all risks or a complete discussion of such risks.
Nothing in this report shall be construed to be an offer or solicitation for the purchase or sale of any product. Any decision to purchase any product mentioned in this report should take into account existing public information, including any registered prospectus in respect of such product.
Phillip Securities Research, or persons associated with or connected to Phillip Securities Research, including but not limited to its officers, directors, employees or persons involved in the issuance of this report, may provide an array of financial services to a large number of corporations in Singapore and worldwide, including but not limited to commercial / investment banking activities (including sponsorship, financial advisory or underwriting activities), brokerage or securities trading activities. Phillip Securities Research, or persons associated with or connected to Phillip Securities Research, including but not limited to its officers, directors, employees or persons involved in the issuance of this report, may have participated in or invested in transactions with the issuer(s) of the securities mentioned in this report, and may have performed services for or solicited business from such issuers. Additionally, Phillip Securities Research, or persons associated with or connected to Phillip Securities Research, including but not limited to its officers, directors, employees or persons involved in the issuance of this report, may have provided advice or investment services to such companies and investments or related investments, as may be mentioned in this report.
Phillip Securities Research or persons associated with or connected to Phillip Securities Research, including but not limited to its officers, directors, employees or persons involved in the issuance of this report may, from time to time maintain a long or short position in securities referred to herein, or in related futures or options, purchase or sell, make a market in, or engage in any other transaction involving such securities, and earn brokerage or other compensation in respect of the foregoing. Investments will be denominated in various currencies including US dollars and Euro and thus will be subject to any fluctuation in exchange rates between US dollars and Euro or foreign currencies and the currency of your own jurisdiction. Such fluctuations may have an adverse effect on the value, price or income return of the investment.
To the extent permitted by law, Phillip Securities Research, or persons associated with or connected to Phillip Securities Research, including but not limited to its officers, directors, employees or persons involved in the issuance of this report, may at any time engage in any of the above activities as set out above or otherwise hold an interest, whether material or not, in respect of companies and investments or related investments, which may be mentioned in this report. Accordingly, information may be available to Phillip Securities Research, or persons associated with or connected to Phillip Securities Research, including but not limited to its officers, directors, employees or persons involved in the issuance of this report, which is not reflected in this report, and Phillip Securities Research, or persons associated with or connected to Phillip Securities Research, including but not limited to its officers, directors, employees or persons involved in the issuance of this report, may, to the extent permitted by law, have acted upon or used the information prior to or immediately following its publication. Phillip Securities Research, or persons associated with or connected to Phillip Securities Research, including but not limited its officers, directors, employees or persons involved in the issuance of this report, may have issued other material that is inconsistent with, or reach different conclusions from, the contents of this report.
The information, tools and material presented herein are not directed, intended for distribution to or use by, any person or entity in any jurisdiction or country where such distribution, publication, availability or use would be contrary to the applicable law or regulation or which would subject Phillip Securities Research to any registration or licensing or other requirement, or penalty for contravention of such requirements within such jurisdiction.
This report is intended for general circulation only and does not take into account the specific investment objectives, financial situation or particular needs of any particular person. The products mentioned in this report may not be suitable for all investors and a person receiving or reading this report should seek advice from a professional and financial adviser regarding the legal, business, financial, tax and other aspects including the suitability of such products, taking into account the specific investment objectives, financial situation or particular needs of that person, before making a commitment to invest in any of such products.
This report is not intended for distribution, publication to or use by any person in any jurisdiction outside of Singapore or any other jurisdiction as Phillip Securities Research may determine in its absolute discretion.
IMPORTANT DISCLOSURES FOR INCLUDED RESEARCH ANALYSES OR REPORTS OF FOREIGN RESEARCH HOUSE
Where the report contains research analyses or reports from a foreign research house, please note:

Paul has 20 years of experience as a fund manager and sell-side analyst. During his time as fund manager, he has managed multiple funds and mandates including capital guaranteed, dividend income, renewable energy, single country and regionally focused funds.
He graduated from Monash University and had completed both his Chartered Financial Analyst and Australian CPA programme.
