
Historical market performances before and after election day
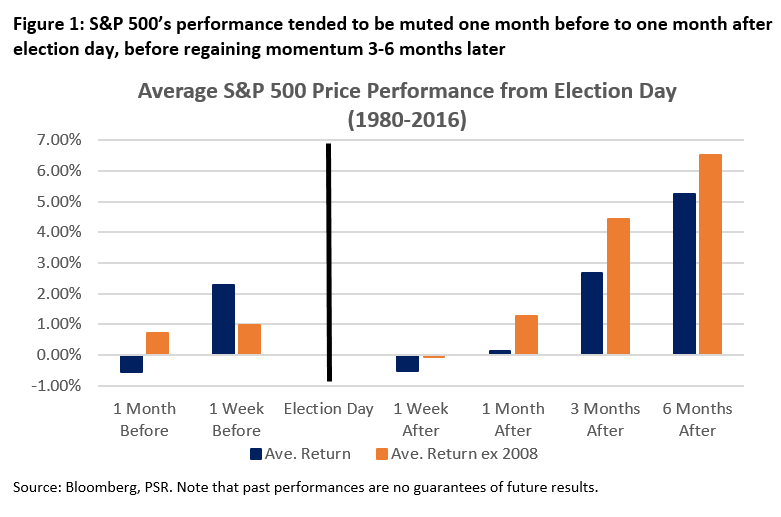
Before election day. In past election years (1980-2016) excluding 2008, the S&P 500 gained 0.73% on average one month before and 0.99% one week before election day (Figure 1). We do not see a repeat this year, considering market turbulence caused by Covid-19 resurgences, delays in fiscal stimulus and risks of a disputed or delayed election outcome. This is the second election since 1980 where we do not see a positive performance for the S&P500 one week into elections.
After election day. Market performances tended to remain fairly muted for several weeks. This might be because results announced on election night are considered unofficial. Certification of the results can take weeks due to the need for verification across the states. In a close race, the certification process is even more crucial and may take longer, causing market volatility. Some investors could opt to stay on the sidelines until the results are finalised. However, if we extend our investment horizon, the market tended to regain momentum after that. Returns for the S&P 500 averaged 4.44% three months after and 6.52% six months after election day (Figure 1).
Recommendation. Due to the surge in mail-in voting this year, there is greater risk of an electoral dispute. Market sentiment may turn risk-off in the near term.
We continue to believe that there will be fiscal stimulus, regardless of who becomes President, though this could be delayed till February 2021. We also remain hopeful of the discovery of a vaccine for Covid-19 by mid-2021, with 11 potential vaccines in Phase 3 trials. This may ease concerns over virus resurgences and restore risk-on sentiment on equities. We remain bullish on the market in 2021.
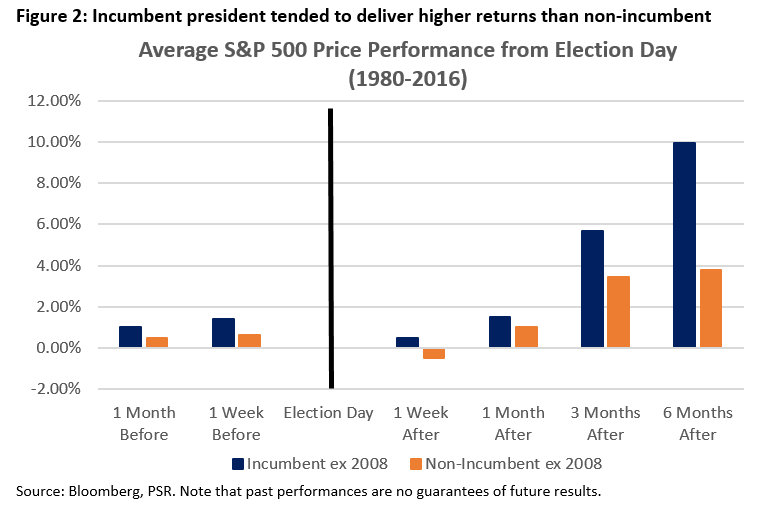
Trump win may drive market higher more than Biden win; investors should, nevertheless, stay invested for the longer term…
In past election years (1980-2016), the S&P 500 delivered higher returns under an incumbent president than a non-incumbent (Figure 2). This implies a Trump win may be better for the market, especially given his tilt towards business-friendly tax cuts and deregulation. Regardless of who wins, however, we believe investors should stay invested. Historically, a non-incumbent win still delivered an average return of 3.47% three months after and 3.77% six months after election day (Figure 2).
Sector performances from election day (1992-2016)
We summarised the historical returns of different sectors in past election years (1992-2016 ex 2008) in Figure 3. We omitted the year 2008 as returns that year were heavily skewed by the global financial crisis.
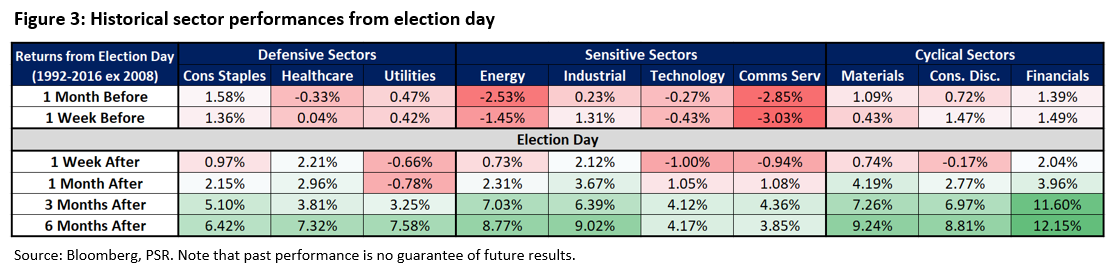
Risk-off possible before election day due to uncertainties. In past election years, defensive sectors tended to outperform sensitive and cyclical sectors. This likely reflected investors’ jitters over election results. Returns across the sectors were generally weak. Sensitive sectors such as energy and communication services tended to underperform.
Markets may remain muted near term. Market performances tended to be muted for several weeks after elections. Stronger-performing sectors included healthcare, industrial and financials.
Bulls stand to gain on longer investment horizon. Investors who adopted a longer-term timeframe of 3-6 months after election day would have benefitted from a bullish turn in sentiment on all sectors. Traditionally, cyclical sectors outperformed, with financials, materials and consumer discretionary being the strongest-performing.
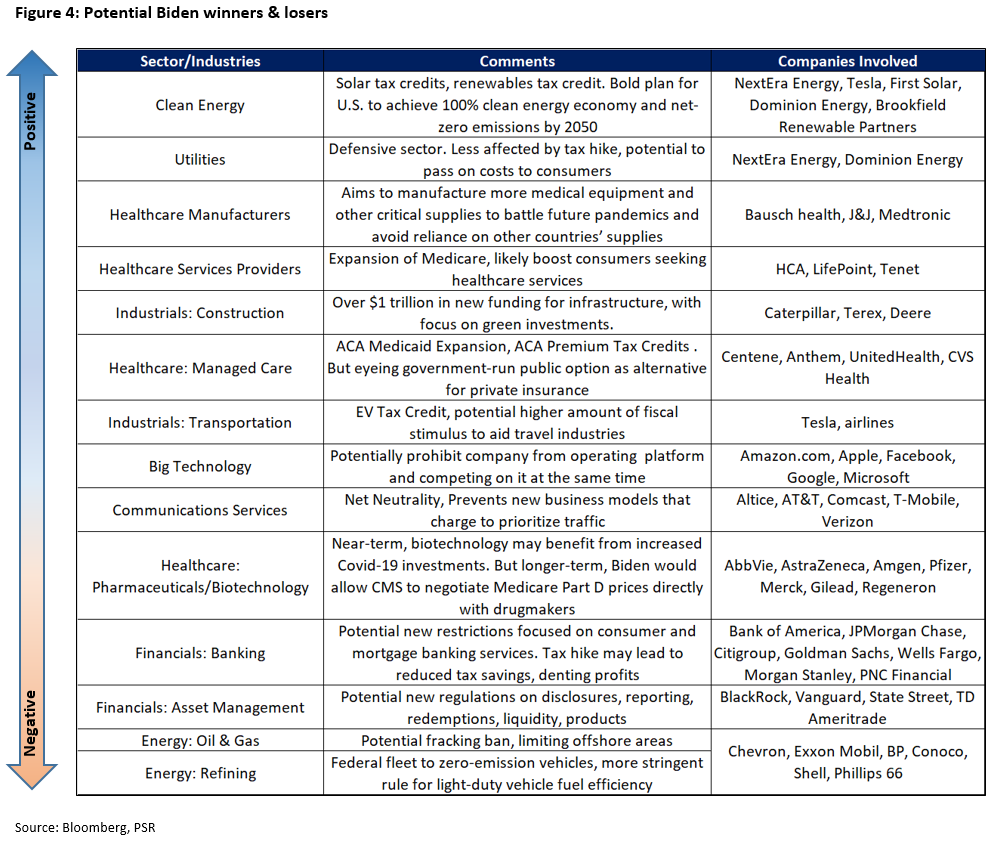
Winners & losers under Biden
Going into election day, we summarise the impact of a Biden win on various sectors and industries in Figure 4. A Trump win is expected to support the status quo and a continuation of policies from his first term.
Important Information
This report is prepared and/or distributed by Phillip Securities Research Pte Ltd ("Phillip Securities Research"), which is a holder of a financial adviser’s licence under the Financial Advisers Act, Chapter 110 in Singapore.
By receiving or reading this report, you agree to be bound by the terms and limitations set out below. Any failure to comply with these terms and limitations may constitute a violation of law. This report has been provided to you for personal use only and shall not be reproduced, distributed or published by you in whole or in part, for any purpose. If you have received this report by mistake, please delete or destroy it, and notify the sender immediately.
The information and any analysis, forecasts, projections, expectations and opinions (collectively, the “Research”) contained in this report has been obtained from public sources which Phillip Securities Research believes to be reliable. However, Phillip Securities Research does not make any representation or warranty, express or implied that such information or Research is accurate, complete or appropriate or should be relied upon as such. Any such information or Research contained in this report is subject to change, and Phillip Securities Research shall not have any responsibility to maintain or update the information or Research made available or to supply any corrections, updates or releases in connection therewith.
Any opinions, forecasts, assumptions, estimates, valuations and prices contained in this report are as of the date indicated and are subject to change at any time without prior notice. Past performance of any product referred to in this report is not indicative of future results.
This report does not constitute, and should not be used as a substitute for, tax, legal or investment advice. This report should not be relied upon exclusively or as authoritative, without further being subject to the recipient’s own independent verification and exercise of judgment. The fact that this report has been made available constitutes neither a recommendation to enter into a particular transaction, nor a representation that any product described in this report is suitable or appropriate for the recipient. Recipients should be aware that many of the products, which may be described in this report involve significant risks and may not be suitable for all investors, and that any decision to enter into transactions involving such products should not be made, unless all such risks are understood and an independent determination has been made that such transactions would be appropriate. Any discussion of the risks contained herein with respect to any product should not be considered to be a disclosure of all risks or a complete discussion of such risks.
Nothing in this report shall be construed to be an offer or solicitation for the purchase or sale of any product. Any decision to purchase any product mentioned in this report should take into account existing public information, including any registered prospectus in respect of such product.
Phillip Securities Research, or persons associated with or connected to Phillip Securities Research, including but not limited to its officers, directors, employees or persons involved in the issuance of this report, may provide an array of financial services to a large number of corporations in Singapore and worldwide, including but not limited to commercial / investment banking activities (including sponsorship, financial advisory or underwriting activities), brokerage or securities trading activities. Phillip Securities Research, or persons associated with or connected to Phillip Securities Research, including but not limited to its officers, directors, employees or persons involved in the issuance of this report, may have participated in or invested in transactions with the issuer(s) of the securities mentioned in this report, and may have performed services for or solicited business from such issuers. Additionally, Phillip Securities Research, or persons associated with or connected to Phillip Securities Research, including but not limited to its officers, directors, employees or persons involved in the issuance of this report, may have provided advice or investment services to such companies and investments or related investments, as may be mentioned in this report.
Phillip Securities Research or persons associated with or connected to Phillip Securities Research, including but not limited to its officers, directors, employees or persons involved in the issuance of this report may, from time to time maintain a long or short position in securities referred to herein, or in related futures or options, purchase or sell, make a market in, or engage in any other transaction involving such securities, and earn brokerage or other compensation in respect of the foregoing. Investments will be denominated in various currencies including US dollars and Euro and thus will be subject to any fluctuation in exchange rates between US dollars and Euro or foreign currencies and the currency of your own jurisdiction. Such fluctuations may have an adverse effect on the value, price or income return of the investment.
To the extent permitted by law, Phillip Securities Research, or persons associated with or connected to Phillip Securities Research, including but not limited to its officers, directors, employees or persons involved in the issuance of this report, may at any time engage in any of the above activities as set out above or otherwise hold an interest, whether material or not, in respect of companies and investments or related investments, which may be mentioned in this report. Accordingly, information may be available to Phillip Securities Research, or persons associated with or connected to Phillip Securities Research, including but not limited to its officers, directors, employees or persons involved in the issuance of this report, which is not reflected in this report, and Phillip Securities Research, or persons associated with or connected to Phillip Securities Research, including but not limited to its officers, directors, employees or persons involved in the issuance of this report, may, to the extent permitted by law, have acted upon or used the information prior to or immediately following its publication. Phillip Securities Research, or persons associated with or connected to Phillip Securities Research, including but not limited its officers, directors, employees or persons involved in the issuance of this report, may have issued other material that is inconsistent with, or reach different conclusions from, the contents of this report.
The information, tools and material presented herein are not directed, intended for distribution to or use by, any person or entity in any jurisdiction or country where such distribution, publication, availability or use would be contrary to the applicable law or regulation or which would subject Phillip Securities Research to any registration or licensing or other requirement, or penalty for contravention of such requirements within such jurisdiction.
This report is intended for general circulation only and does not take into account the specific investment objectives, financial situation or particular needs of any particular person. The products mentioned in this report may not be suitable for all investors and a person receiving or reading this report should seek advice from a professional and financial adviser regarding the legal, business, financial, tax and other aspects including the suitability of such products, taking into account the specific investment objectives, financial situation or particular needs of that person, before making a commitment to invest in any of such products.
This report is not intended for distribution, publication to or use by any person in any jurisdiction outside of Singapore or any other jurisdiction as Phillip Securities Research may determine in its absolute discretion.
IMPORTANT DISCLOSURES FOR INCLUDED RESEARCH ANALYSES OR REPORTS OF FOREIGN RESEARCH HOUSE
Where the report contains research analyses or reports from a foreign research house, please note:
