Investment Merits
We Initiate coverage with an ACCUMULATE rating and target price of US$724.00 based on DCF valuation, with a WACC of 9.0% and terminal growth of 3%.
REVENUE
NFLX’s revenue for FY20 was US$25bn, 99% is derived from monthly membership subscriptions paid by customers for their streaming services. Revenue increased 24% YoY, bolstered by 22% growth in paid memberships. Gross profit came in at US$9.7bn, with PATMI of US$2.8bn.
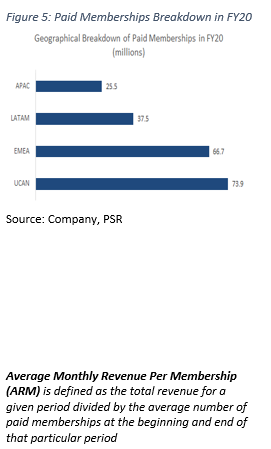
Geographical Breakdown: UCAN (US + Canada) comprises 36% of global paid memberships, totaling 74mn memberships in end FY20 (Figure 5). We expect growth to slow significantly in this region to about 2% YoY, due to 1) increased competition from Disney+ and HBO Max, 2) re-opening headwinds for new subscribers.
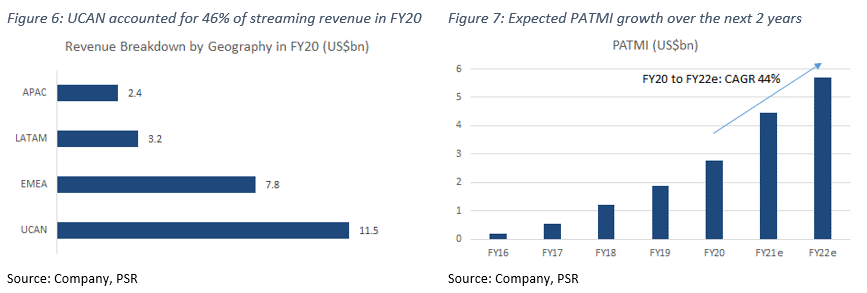
EMEA (Europe, Middle East & Africa) and LATAM (Latin America) make up 33% and 18% of global paid memberships respectively, we expect paid membership growth in these regions to increase by about 10% YoY. APAC (Asia-Pacific) accounts for the remaining 13% with 25mn paid memberships. We do expect quite substantial YoY growth (24% FY21e) in this region, largely due to an increase in streaming opportunities in India. In terms of streaming revenue breakdown by geographical regions, UCAN totals 46% of streaming revenue, EMEA makes up 31%, LATAM 13%, and APAC 10% (Figure 6).
Growth Trajectory: We are very bullish on NFLX’s ability to continue on its growth trajectory, supplemented by healthy underlying business metrics in paid net membership additions and ARM. Streaming represents just 27% of US TV screen time, compared to 63% for linear television, and we expect this segment to grow relative to total screen time globally due to shifts in consumer behaviour. In addition, roughly 80% of Net Paid Additions in FY20 came
from outside of the UCAN region, reducing the reliance on ARM growth in the highly saturated UCAN region.
Quality Content: NFLX is also generating more value for its consumers by ramping up the content production in an effort to produce higher quality content for consumption – around 500 titles currently in post-production or preparing to launch, with plans to launch at least 1 new original film per week in FY21e. Testament to the quality of its content, NFLX original series and specials also received 129 Emmy nominations in Q2 FY21. Additionally, NFLX plans to add a new content category – gaming, to complement their main streaming business with an additional layer of interactivity. NFLX has also established itself as the premier streaming service amongst its peers, which we believe they are well equipped to maintain. We are also very positive about NFLX’s subscription pricing power, as the company was able to grow its paid membership numbers even with subscription price hikes in Q4 FY20.
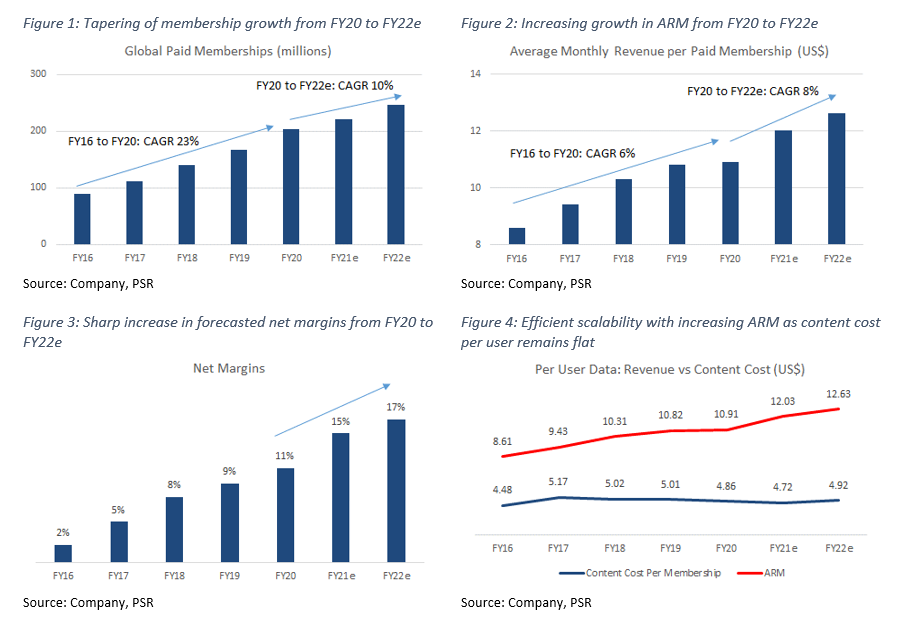
Revenue Growth: NFLX registered gross profits of US$9.7bn in FY20, almost quadrupling gross profits of US$2.6bn in FY16, and a 26% YoY growth compared to FY19. PATMI for FY20 was US$2.8bn, and YoY growth of 48%, and with a 4-Yr CAGR of 96%. PATMI is expected to increase at a CAGR of 44% over the next 2 years due to increases in net margins (Figure 7). Revenue is expected to grow 18% and hit US$30bn by end of FY21e. We expect this to come from increasing YoY growth in Paid Memberships, as well as ARM.
EXPENSES
Cost of sales grew at a 20% CAGR from FY16 to FY20, slightly below revenue CAGR of 23%. Operating expenses include research and development (7% of revenue), sales and marketing (9%), and general and administrative (4%). Expense categories remain largely unchanged over the last 3 years, except for sales and marketing expenses, which decreased from 15% of revenue in FY18 to 9% in FY20.
Content cost was US$10.8bn in FY20 (or 43% of revenue), US$1.6bn less than FY19, largely due to disruptions in content productions caused by Covid-19. Content costs are expected to increase over the next few years, due to an expansion in content assets. Content costs are amortized based on each title’s contractual window of availability or an estimated useful life of 10 years, whichever is shorter.
MARGINS
Gross margins hit an all-time high of 39% in FY20, up half a percent from FY19. Gross margins over the last 5 years seem to be on an upward trend, and we expect this to continue due to the increased scalability of the business.
Net margins in FY20 were 11%, up from 9.3% the previous year. Led by reduced operating expenses as a percentage of revenue, partially offset by an increase in tax. Similar to gross margins, we do expect net margins to increase significantly into the 15-17% range moving forward, on the back of their ability to scale effectively.
BALANCE SHEET
Assets: Cash and cash equivalents increased by about US$3bn YoY in FY20, largely due to increased cash flow from operations, partially offset by a reduction in debt issuance. Content assets increased marginally by almost US$1bn YoY, but we do expect a significant increase moving forward due to continued investments in quality content assets. Plant, property, equipment and intangible assets almost doubled in FY20, led by the increased capital expenditure of US$498mn.
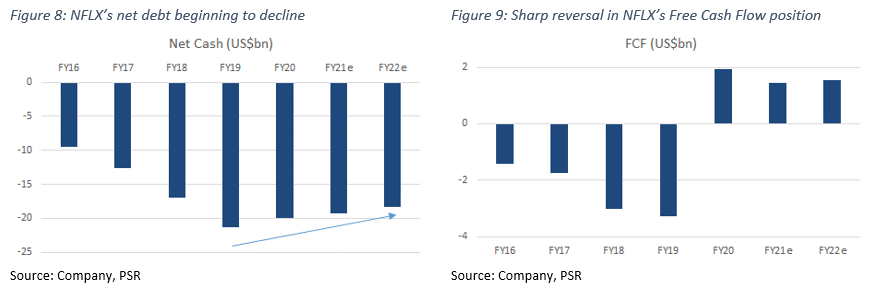
Liabilities: Total liabilities increased slightly from US$26.4bn in FY19 to US$28.2bn in FY20, largely due to the issuance of debt in FY20. We expect total liabilities to decrease over time as the company begins to pay off its accumulated debt of around US$16bn.
CASH-FLOW
Free Cash Flow (FCF) in FY20 was US$1.9bn (Figure 9), marking the first time NFLX has returned positive FCF for a financial year. We consider it an important milestone for NFLX to enable the company to self-fund growth moving forward. We do expect NFLX to continue this positive FCF trend based on increased operational efficiency.
BUSINESS MODEL
NFLX uses a subscription-based business model with three main price plans – ranging from US$2-24, providing customers with access to video on demand (VOD) streaming services. NFLX also provides cheaper mobile-only price plans available in the APAC region, targeting customers who only have mobile phones at home. The company has high upfront costs related to: 1) content licensing, and 2) production of NFLX Original content. Distribution costs are relatively low as they leverage the use of the Internet to reach its customers. The company’s main objective is to deliver value for its customers through streaming services, at an affordable price point.
NFLX has been changing the way households consume traditional media, giving consumers the choice to move away from linear TV, towards a more flexible entertainment option like VOD streaming. It has also recently begun adding gaming content to complement its TV series and movie features.
The company has been actively investing in higher quality content assets to ensure services provided are of the very best in terms of quality and innovation – growing its content assets on its balance sheet 2.5x since FY17. NFLX also has shown strong purchasing power, adding users globally YoY while raising prices at the same time. Macro shifts in how people consume entertainment – moving away from traditional media, could provide a constant tailwind for NFLX’s customer acquisition efforts.
INDUSTRY
Currently, it is estimated that the streaming industry occupies about 27% of total US TV time, compared to 63% for linear television (Figure 12). We expect these numbers to slowly even out over the next few years as the popularity of VOD streaming picks up. The total addressable market for VOD streaming is expected to increase at a 9% CAGR over the next 5 years – US$71.5bn in FY21e to US$108.7bn FY25e (Figure 10). NFLX’s main competitors in the streaming sector are Amazon Prime Video, Disney+, YouTube, Hulu, and HBO Max (Figure 12).
Discounting Amazon Prime Video numbers – due to the nature of Amazon Prime subscription which are purchased primarily for premium e-commerce functions and not VOD streaming, the closest competitor would be Disney+ with 116 mn paid memberships, slightly more than half of NFLX’s 209 mn (Figure 11).
Important Information
This report is prepared and/or distributed by Phillip Securities Research Pte Ltd ("Phillip Securities Research"), which is a holder of a financial adviser’s licence under the Financial Advisers Act, Chapter 110 in Singapore.
By receiving or reading this report, you agree to be bound by the terms and limitations set out below. Any failure to comply with these terms and limitations may constitute a violation of law. This report has been provided to you for personal use only and shall not be reproduced, distributed or published by you in whole or in part, for any purpose. If you have received this report by mistake, please delete or destroy it, and notify the sender immediately.
The information and any analysis, forecasts, projections, expectations and opinions (collectively, the “Research”) contained in this report has been obtained from public sources which Phillip Securities Research believes to be reliable. However, Phillip Securities Research does not make any representation or warranty, express or implied that such information or Research is accurate, complete or appropriate or should be relied upon as such. Any such information or Research contained in this report is subject to change, and Phillip Securities Research shall not have any responsibility to maintain or update the information or Research made available or to supply any corrections, updates or releases in connection therewith.
Any opinions, forecasts, assumptions, estimates, valuations and prices contained in this report are as of the date indicated and are subject to change at any time without prior notice. Past performance of any product referred to in this report is not indicative of future results.
This report does not constitute, and should not be used as a substitute for, tax, legal or investment advice. This report should not be relied upon exclusively or as authoritative, without further being subject to the recipient’s own independent verification and exercise of judgment. The fact that this report has been made available constitutes neither a recommendation to enter into a particular transaction, nor a representation that any product described in this report is suitable or appropriate for the recipient. Recipients should be aware that many of the products, which may be described in this report involve significant risks and may not be suitable for all investors, and that any decision to enter into transactions involving such products should not be made, unless all such risks are understood and an independent determination has been made that such transactions would be appropriate. Any discussion of the risks contained herein with respect to any product should not be considered to be a disclosure of all risks or a complete discussion of such risks.
Nothing in this report shall be construed to be an offer or solicitation for the purchase or sale of any product. Any decision to purchase any product mentioned in this report should take into account existing public information, including any registered prospectus in respect of such product.
Phillip Securities Research, or persons associated with or connected to Phillip Securities Research, including but not limited to its officers, directors, employees or persons involved in the issuance of this report, may provide an array of financial services to a large number of corporations in Singapore and worldwide, including but not limited to commercial / investment banking activities (including sponsorship, financial advisory or underwriting activities), brokerage or securities trading activities. Phillip Securities Research, or persons associated with or connected to Phillip Securities Research, including but not limited to its officers, directors, employees or persons involved in the issuance of this report, may have participated in or invested in transactions with the issuer(s) of the securities mentioned in this report, and may have performed services for or solicited business from such issuers. Additionally, Phillip Securities Research, or persons associated with or connected to Phillip Securities Research, including but not limited to its officers, directors, employees or persons involved in the issuance of this report, may have provided advice or investment services to such companies and investments or related investments, as may be mentioned in this report.
Phillip Securities Research or persons associated with or connected to Phillip Securities Research, including but not limited to its officers, directors, employees or persons involved in the issuance of this report may, from time to time maintain a long or short position in securities referred to herein, or in related futures or options, purchase or sell, make a market in, or engage in any other transaction involving such securities, and earn brokerage or other compensation in respect of the foregoing. Investments will be denominated in various currencies including US dollars and Euro and thus will be subject to any fluctuation in exchange rates between US dollars and Euro or foreign currencies and the currency of your own jurisdiction. Such fluctuations may have an adverse effect on the value, price or income return of the investment.
To the extent permitted by law, Phillip Securities Research, or persons associated with or connected to Phillip Securities Research, including but not limited to its officers, directors, employees or persons involved in the issuance of this report, may at any time engage in any of the above activities as set out above or otherwise hold an interest, whether material or not, in respect of companies and investments or related investments, which may be mentioned in this report. Accordingly, information may be available to Phillip Securities Research, or persons associated with or connected to Phillip Securities Research, including but not limited to its officers, directors, employees or persons involved in the issuance of this report, which is not reflected in this report, and Phillip Securities Research, or persons associated with or connected to Phillip Securities Research, including but not limited to its officers, directors, employees or persons involved in the issuance of this report, may, to the extent permitted by law, have acted upon or used the information prior to or immediately following its publication. Phillip Securities Research, or persons associated with or connected to Phillip Securities Research, including but not limited its officers, directors, employees or persons involved in the issuance of this report, may have issued other material that is inconsistent with, or reach different conclusions from, the contents of this report.
The information, tools and material presented herein are not directed, intended for distribution to or use by, any person or entity in any jurisdiction or country where such distribution, publication, availability or use would be contrary to the applicable law or regulation or which would subject Phillip Securities Research to any registration or licensing or other requirement, or penalty for contravention of such requirements within such jurisdiction.
This report is intended for general circulation only and does not take into account the specific investment objectives, financial situation or particular needs of any particular person. The products mentioned in this report may not be suitable for all investors and a person receiving or reading this report should seek advice from a professional and financial adviser regarding the legal, business, financial, tax and other aspects including the suitability of such products, taking into account the specific investment objectives, financial situation or particular needs of that person, before making a commitment to invest in any of such products.
This report is not intended for distribution, publication to or use by any person in any jurisdiction outside of Singapore or any other jurisdiction as Phillip Securities Research may determine in its absolute discretion.
IMPORTANT DISCLOSURES FOR INCLUDED RESEARCH ANALYSES OR REPORTS OF FOREIGN RESEARCH HOUSE
Where the report contains research analyses or reports from a foreign research house, please note:

Jonathan covers the US technology sector focusing on internet companies. Formerly a national and professional athlete, he graduated from the University of Oregon with a Bachelor’s Degree in Social Sciences.
