
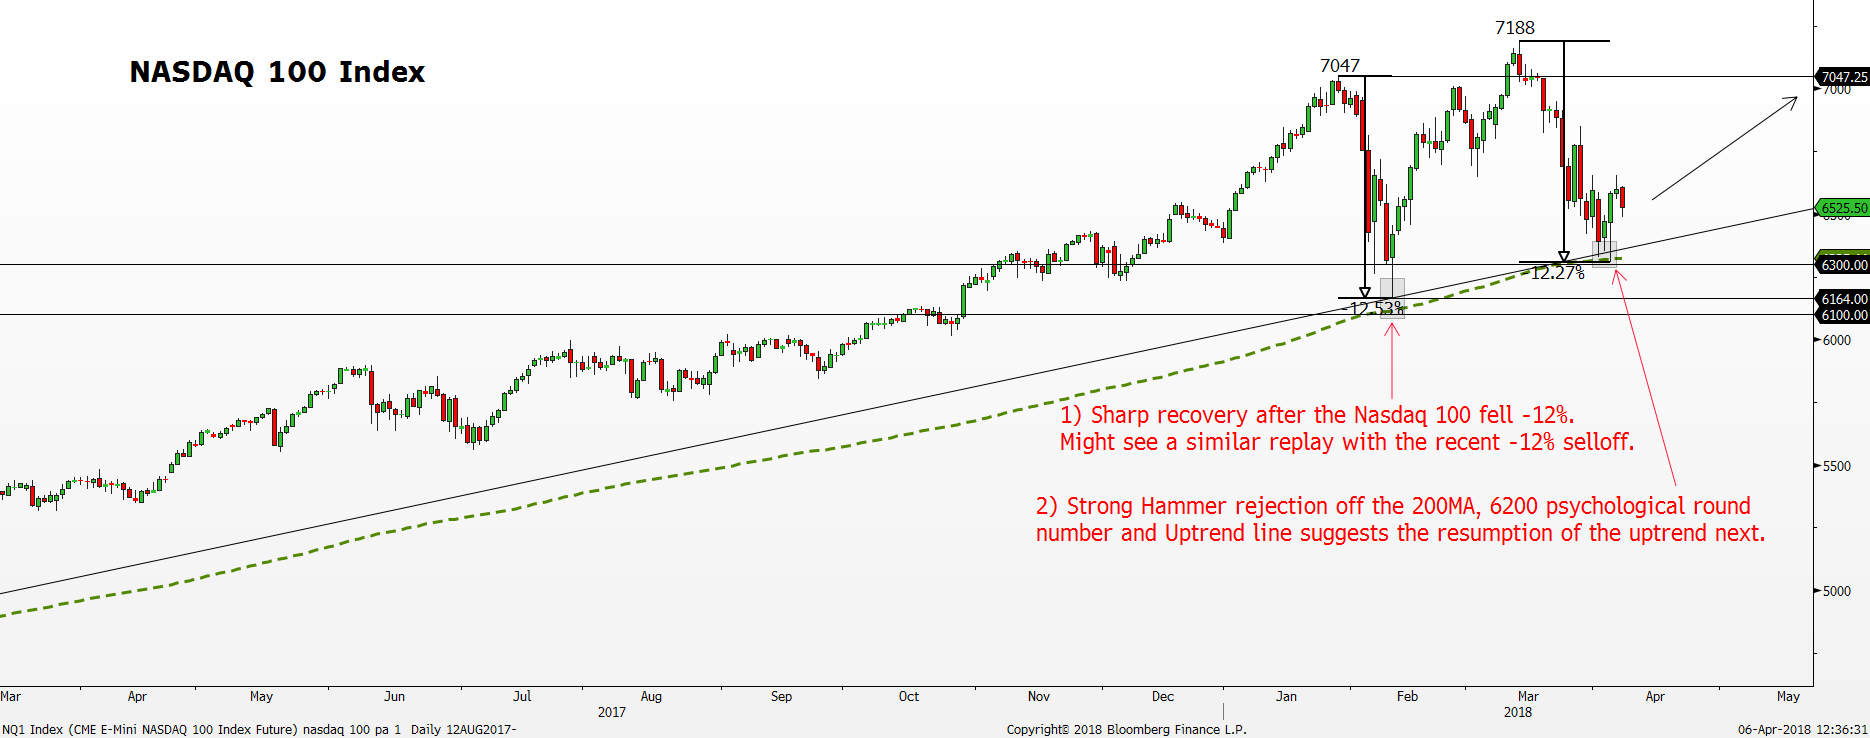
Nasdaq 100 Index Daily Chart Source: Bloomberg, PSR
*Green line = 200 day moving average
Despite the recent sharp selloff in the tech space, the Nasdaq 100 index remains positive year to date while the other major indices such as Dow Jones Industrial Average (DJIA) and S&P 500 index are down marginally.
The tech space was plagued by the Facebook’s controversial data breach incident involving Cambridge Analytica. As many as 87 million Facebook users’ data were exposed to the political consultancy firm, Cambridge Analytica resulting in a sharp drop of -17% in Facebook share price to the low of 149.02. With Facebook being one of the top 5 holdings in the Nasdaq 100 index with 4.95% weightage, the Nasdaq 100 index also suffered a -12% selloff from the 7,188 record high.
The last time a -12% selloff occurred, a distinct reversal happened immediately, lifting price right back into the uptrend in search of a new record high. That happened in the early part of February where the reversal came after the Nasdaq 100 index fell -12.53% from the 7,047 prior record high. Therefore, a similar reversal price action might happen soon as the -12% selloff has been fulfilled with the recent risk-off behaviour.
Moreover, from the long-term perspective, the Nasdaq 100 index is still in the uptrend as the structure of the series of Higher Highs (HH) and Higher Lows (HL) remain intact. Currently, the Nasdaq 100 index is hanging around a pivotal support area at the confluence of the 200-day moving average, 6,300 psychological round number and the long-term uptrend line justifying for a rebound soon. Note the long-term uptrend line is drawn by connecting the 2016 Brexit low point to the 2018 February VIX explosion low point.
In addition, despite the trade war escalating after China announced on 4 April plans to impose reciprocal tariffs on $50 billion of US imports, the initial selloff in the equity market was short-lived. As soon as the Nasdaq 100 index breached below the 200-day moving average, a sharp reversal lifted the Nasdaq 100 index by +4.3% off the 6,306 intraday low to close at 6,582 points. The strong recovery off the 200-day moving average formed a bullish price action, hammer at the end of the day suggesting a high likelihood of seeing the bulls taking back control. As long as this support area holds, the long-term uptrend should resume with buyers targeting the 7,000 psychological round number next.
However, if the 6,300 psychological round number fails to hold, the next crucial level to watch for the long-term uptrend to remain intact is the 6,164 February low. The 6,164 support area will be the last line of defence for the uptrend. If the Nasdaq 100 index closes below the 6,164 support area, that might spell the start of a deeper selloff.
Keep in mind the 200-day moving average from the Dow Jones Industrial Average and S&P 500 index is still holding up too with similar bullish price action, steering the current bias to the bullish side. For the bearish scenario to play out, all three US major indices such as the DJIA, S&P 500 and Nasdaq 100 index need to breach their respective 200-day moving average.
In summary, the Nasdaq 100 index looks likelier to follow the former scenario for a rebound back into the uptrend with the strong support at 6,300 psychological round number keeping a floor on price.
Important Information
This report is prepared and/or distributed by Phillip Securities Research Pte Ltd ("Phillip Securities Research"), which is a holder of a financial adviser’s licence under the Financial Advisers Act, Chapter 110 in Singapore.
By receiving or reading this report, you agree to be bound by the terms and limitations set out below. Any failure to comply with these terms and limitations may constitute a violation of law. This report has been provided to you for personal use only and shall not be reproduced, distributed or published by you in whole or in part, for any purpose. If you have received this report by mistake, please delete or destroy it, and notify the sender immediately.
The information and any analysis, forecasts, projections, expectations and opinions (collectively, the “Research”) contained in this report has been obtained from public sources which Phillip Securities Research believes to be reliable. However, Phillip Securities Research does not make any representation or warranty, express or implied that such information or Research is accurate, complete or appropriate or should be relied upon as such. Any such information or Research contained in this report is subject to change, and Phillip Securities Research shall not have any responsibility to maintain or update the information or Research made available or to supply any corrections, updates or releases in connection therewith.
Any opinions, forecasts, assumptions, estimates, valuations and prices contained in this report are as of the date indicated and are subject to change at any time without prior notice. Past performance of any product referred to in this report is not indicative of future results.
This report does not constitute, and should not be used as a substitute for, tax, legal or investment advice. This report should not be relied upon exclusively or as authoritative, without further being subject to the recipient’s own independent verification and exercise of judgment. The fact that this report has been made available constitutes neither a recommendation to enter into a particular transaction, nor a representation that any product described in this report is suitable or appropriate for the recipient. Recipients should be aware that many of the products, which may be described in this report involve significant risks and may not be suitable for all investors, and that any decision to enter into transactions involving such products should not be made, unless all such risks are understood and an independent determination has been made that such transactions would be appropriate. Any discussion of the risks contained herein with respect to any product should not be considered to be a disclosure of all risks or a complete discussion of such risks.
Nothing in this report shall be construed to be an offer or solicitation for the purchase or sale of any product. Any decision to purchase any product mentioned in this report should take into account existing public information, including any registered prospectus in respect of such product.
Phillip Securities Research, or persons associated with or connected to Phillip Securities Research, including but not limited to its officers, directors, employees or persons involved in the issuance of this report, may provide an array of financial services to a large number of corporations in Singapore and worldwide, including but not limited to commercial / investment banking activities (including sponsorship, financial advisory or underwriting activities), brokerage or securities trading activities. Phillip Securities Research, or persons associated with or connected to Phillip Securities Research, including but not limited to its officers, directors, employees or persons involved in the issuance of this report, may have participated in or invested in transactions with the issuer(s) of the securities mentioned in this report, and may have performed services for or solicited business from such issuers. Additionally, Phillip Securities Research, or persons associated with or connected to Phillip Securities Research, including but not limited to its officers, directors, employees or persons involved in the issuance of this report, may have provided advice or investment services to such companies and investments or related investments, as may be mentioned in this report.
Phillip Securities Research or persons associated with or connected to Phillip Securities Research, including but not limited to its officers, directors, employees or persons involved in the issuance of this report may, from time to time maintain a long or short position in securities referred to herein, or in related futures or options, purchase or sell, make a market in, or engage in any other transaction involving such securities, and earn brokerage or other compensation in respect of the foregoing. Investments will be denominated in various currencies including US dollars and Euro and thus will be subject to any fluctuation in exchange rates between US dollars and Euro or foreign currencies and the currency of your own jurisdiction. Such fluctuations may have an adverse effect on the value, price or income return of the investment.
To the extent permitted by law, Phillip Securities Research, or persons associated with or connected to Phillip Securities Research, including but not limited to its officers, directors, employees or persons involved in the issuance of this report, may at any time engage in any of the above activities as set out above or otherwise hold an interest, whether material or not, in respect of companies and investments or related investments, which may be mentioned in this report. Accordingly, information may be available to Phillip Securities Research, or persons associated with or connected to Phillip Securities Research, including but not limited to its officers, directors, employees or persons involved in the issuance of this report, which is not reflected in this report, and Phillip Securities Research, or persons associated with or connected to Phillip Securities Research, including but not limited to its officers, directors, employees or persons involved in the issuance of this report, may, to the extent permitted by law, have acted upon or used the information prior to or immediately following its publication. Phillip Securities Research, or persons associated with or connected to Phillip Securities Research, including but not limited its officers, directors, employees or persons involved in the issuance of this report, may have issued other material that is inconsistent with, or reach different conclusions from, the contents of this report.
The information, tools and material presented herein are not directed, intended for distribution to or use by, any person or entity in any jurisdiction or country where such distribution, publication, availability or use would be contrary to the applicable law or regulation or which would subject Phillip Securities Research to any registration or licensing or other requirement, or penalty for contravention of such requirements within such jurisdiction.
This report is intended for general circulation only and does not take into account the specific investment objectives, financial situation or particular needs of any particular person. The products mentioned in this report may not be suitable for all investors and a person receiving or reading this report should seek advice from a professional and financial adviser regarding the legal, business, financial, tax and other aspects including the suitability of such products, taking into account the specific investment objectives, financial situation or particular needs of that person, before making a commitment to invest in any of such products.
This report is not intended for distribution, publication to or use by any person in any jurisdiction outside of Singapore or any other jurisdiction as Phillip Securities Research may determine in its absolute discretion.
IMPORTANT DISCLOSURES FOR INCLUDED RESEARCH ANALYSES OR REPORTS OF FOREIGN RESEARCH HOUSE
Where the report contains research analyses or reports from a foreign research house, please note:

Jeremy specialises in Technical Analysis and has 10 years of experience in studying price action. His areas of expertise include intermarket analysis on the equities, currencies, commodities and bonds market.
He is also a regular columnist on The Business Times - every Monday ChartPoint column.
He graduated with a Bachelor of Science in Banking and Finance from University of London.
