
Report type: Weekly Strategy
“Will the dominance of US stocks over Japanese stocks continue?”
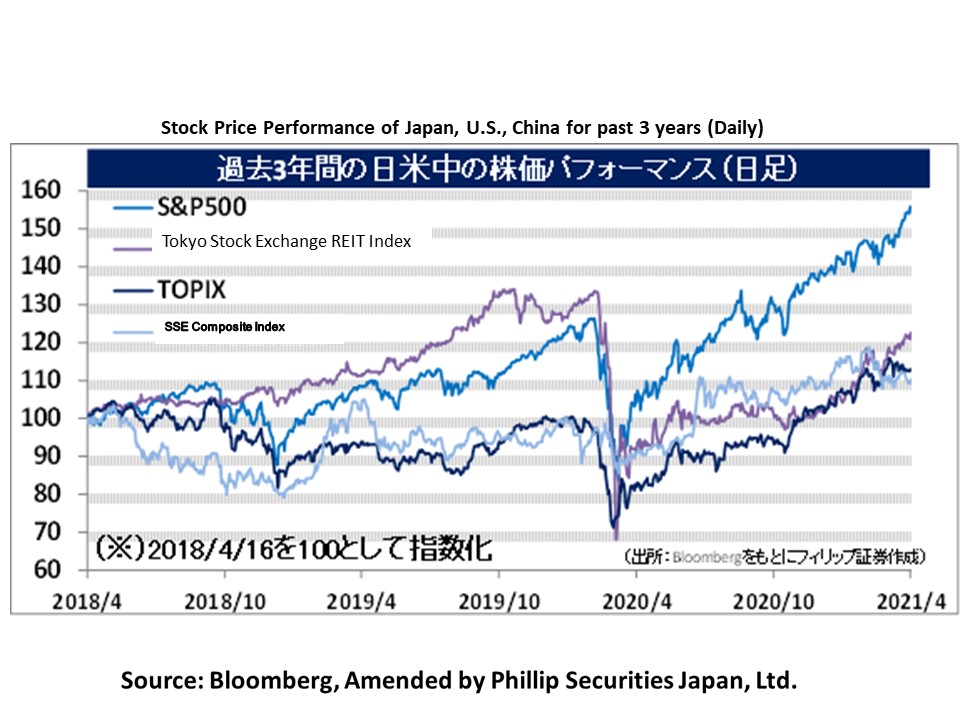
In the US stock market, “The American Jobs Plan” announced by US President Biden on 31/3 indicated that demand is expected to increase over the medium to long term. Furthermore, as for the feared side effects of inflation and higher interest rates, a series of statements by Fed Chairman Powell and other officials that the rise in prices would be only temporary countered expectations of early monetary tightening. As a result, the market is evolving in an ideal direction, with both economic cycle-centric value stocks and high P/E growth stocks rising. In contrast, the Nikkei Average continues to hover in the high range, just short of 30,000 points, as it did the previous week. Why are Japanese stocks moving so slowly, failing to keep pace with the major US stock indices, which are hitting record highs?
Firstly, a chronological look at the current state of US stocks shows that the Wilshire 5000, which covers the broadest range of the US stock market, has risen to a multiple of nearly 200%, far exceeding the peak of the IT bubble in March 2000, when the total market capitalization at the end of the month was divided by nominal GDP. In contrast, the multiple of the total end-of-month market capitalization of companies listed on the First, Second, and Mothers sections of the TSE divided by Japan’s nominal GDP was 138% at the end of March this year, roughly in line with 132% in June 2007, 138% in July 2015, and 142% in January 2018. One thing that can be inferred from this data is that Japanese stocks, compared to US stocks, have a stronger awareness of their historical market capitalization levels when viewed in the context of balancing with the size of the real economy.
The main reason why the total market capitalization of the US stock market has been expanding without any awareness of its balance with the size of the real economy appears to be the increasing dominance of high-growth growth stocks such as GAFA over value stocks, including cyclical stocks. The multiple of the growth stock index divided by the value stock index within the S&P500, the leading US stock index, peaked at 2.04x in late December of last year and then declined to 1.95x on 9/4. However, that for the Tokyo Stock Exchange Stock Price Index (TOPIX) peaked at 1.59x at the end of last year and then declined to 1.44x on 9/4.
With major countries advocating the reduction of global warming gas emissions and the shift to clean energy, “shift from growth to value” appears to be becoming the watchword in the stock market. However, it can be said that the dominance of growth stocks over value stocks has not changed significantly in both Japan and the US. As long as this environment continues, the dominance of US stocks over Japanese stocks should remain unchallenged. On the other hand, a full-fledged shift to value stocks could reverse the current flow of funds and give Japanese stocks an advantage over US stocks.
In the 19/4 issue, we will be covering TerraSky (3915), Nippon Electric Glass (5214), Marubeni (8002), and Renewable Japan Energy Infrastructure Fund (9283).
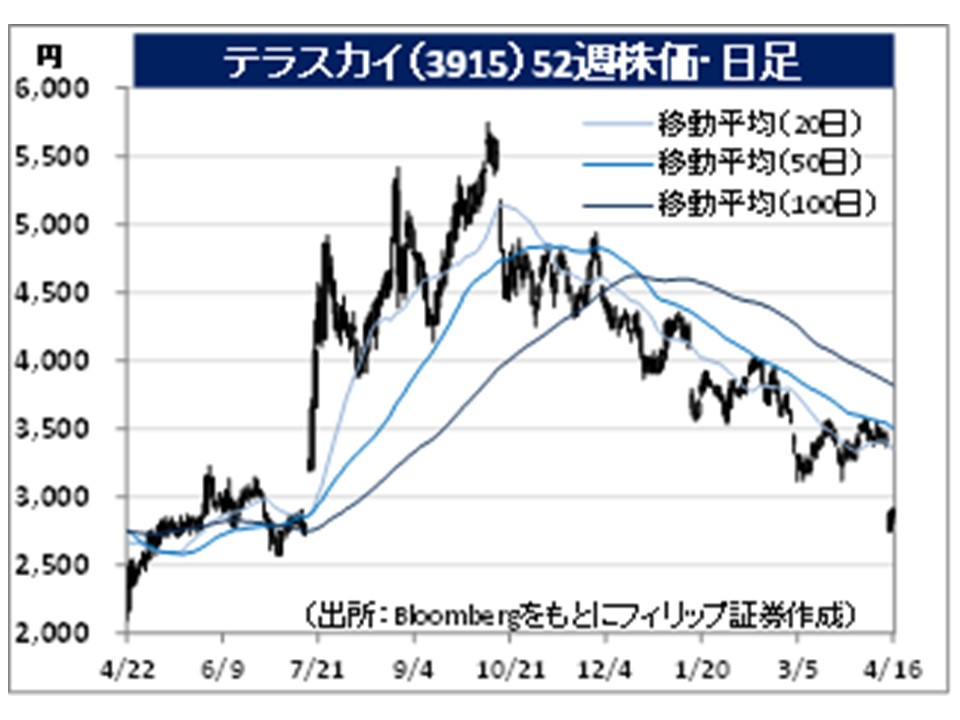
・Established in 2006. Comprises the solutions business based on the cloud systems of Salesforce and AWS (Amazon Web Service), and the product business that provides cloud services in Japan and overseas as a SaaS vendor.
・For FY2021/2 results announced on 14/4, net sales increased by 19.8% to 11.144 billion yen compared to the previous year, and operating income increased by 7.5% to 779 million yen. In addition to the benefits of the expansion of cloud services, deals for “mitoco”, company’s groupware product, have increased for teleworking companies, local governments and educational institutions due to the spread of Covid-19.
・For FY2022/2 plan, net sales is expected to increase by 18.1% to 13.159 billion yen compared to the previous year, and operating income to decrease by 31.2% to 536 million yen. Company expects a decrease in profit due to an expected increase in labor costs to cope with the expansion of the cloud market and the increasing number of projects. salesforce.com (CRM), which is the company’s core business, is expected to post a 21% YoY increase in sales in FY2022/1, and there is also room for upside due to growing demand for digital transformation (DX) among companies.
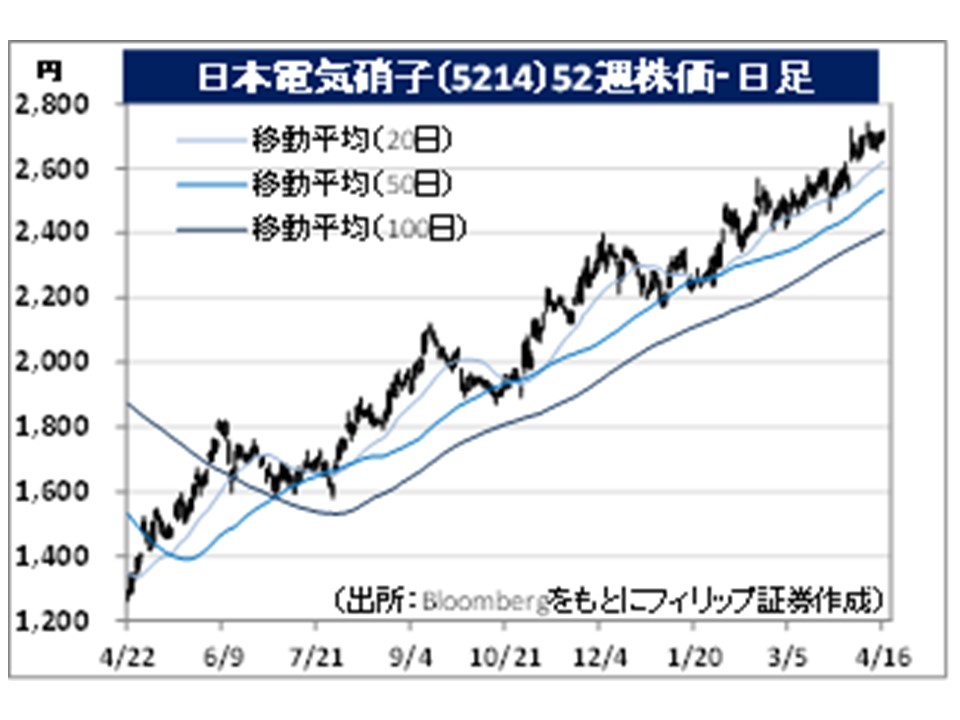
・Founded in 1949 as an independent company from NEC Corp (6701). Manufactures and sells specialty glass products and glass manufacturing machinery in the electronics, information, functional material sectors and other fields, including glass for flat panel displays.
・For FY2020/12 results announced on 2/2, net sales decreased by 5.7% to 242.886 billion yen compared to the previous year, and operating income increased by 8.6% to 17.66 billion yen. Although sales recovered from 3Q (Jul-Sep) onward, full-year sales suffered as glass fibers sales for the automotive market decreased due to the impact of the Covid-19 pandemic. On the other hand, operating income increased owing to productivity improvement and cost reduction.
・For FY2021/12 plan, net sales is expected to increase by 7.0% to 260.0 billion yen compared to the previous year, and operating income to increase by 13.3% to 20.0 billion yen. Price increase of large LCD panels for TVs has accelerated, and the trade price of index products for large consumers in March this year rose for the 10th consecutive month from the previous month. Amid concerns about shortages in the supply of panel components, the glass substrate market for components is an oligopoly market with three companies worldwide, with company ranking third in the world after Corning (GLW) and AGC (5201).
Important Information
This report is prepared and/or distributed by Phillip Securities Research Pte Ltd ("Phillip Securities Research"), which is a holder of a financial adviser’s licence under the Financial Advisers Act, Chapter 110 in Singapore.
By receiving or reading this report, you agree to be bound by the terms and limitations set out below. Any failure to comply with these terms and limitations may constitute a violation of law. This report has been provided to you for personal use only and shall not be reproduced, distributed or published by you in whole or in part, for any purpose. If you have received this report by mistake, please delete or destroy it, and notify the sender immediately.
The information and any analysis, forecasts, projections, expectations and opinions (collectively, the “Research”) contained in this report has been obtained from public sources which Phillip Securities Research believes to be reliable. However, Phillip Securities Research does not make any representation or warranty, express or implied that such information or Research is accurate, complete or appropriate or should be relied upon as such. Any such information or Research contained in this report is subject to change, and Phillip Securities Research shall not have any responsibility to maintain or update the information or Research made available or to supply any corrections, updates or releases in connection therewith.
Any opinions, forecasts, assumptions, estimates, valuations and prices contained in this report are as of the date indicated and are subject to change at any time without prior notice. Past performance of any product referred to in this report is not indicative of future results.
This report does not constitute, and should not be used as a substitute for, tax, legal or investment advice. This report should not be relied upon exclusively or as authoritative, without further being subject to the recipient’s own independent verification and exercise of judgment. The fact that this report has been made available constitutes neither a recommendation to enter into a particular transaction, nor a representation that any product described in this report is suitable or appropriate for the recipient. Recipients should be aware that many of the products, which may be described in this report involve significant risks and may not be suitable for all investors, and that any decision to enter into transactions involving such products should not be made, unless all such risks are understood and an independent determination has been made that such transactions would be appropriate. Any discussion of the risks contained herein with respect to any product should not be considered to be a disclosure of all risks or a complete discussion of such risks.
Nothing in this report shall be construed to be an offer or solicitation for the purchase or sale of any product. Any decision to purchase any product mentioned in this report should take into account existing public information, including any registered prospectus in respect of such product.
Phillip Securities Research, or persons associated with or connected to Phillip Securities Research, including but not limited to its officers, directors, employees or persons involved in the issuance of this report, may provide an array of financial services to a large number of corporations in Singapore and worldwide, including but not limited to commercial / investment banking activities (including sponsorship, financial advisory or underwriting activities), brokerage or securities trading activities. Phillip Securities Research, or persons associated with or connected to Phillip Securities Research, including but not limited to its officers, directors, employees or persons involved in the issuance of this report, may have participated in or invested in transactions with the issuer(s) of the securities mentioned in this report, and may have performed services for or solicited business from such issuers. Additionally, Phillip Securities Research, or persons associated with or connected to Phillip Securities Research, including but not limited to its officers, directors, employees or persons involved in the issuance of this report, may have provided advice or investment services to such companies and investments or related investments, as may be mentioned in this report.
Phillip Securities Research or persons associated with or connected to Phillip Securities Research, including but not limited to its officers, directors, employees or persons involved in the issuance of this report may, from time to time maintain a long or short position in securities referred to herein, or in related futures or options, purchase or sell, make a market in, or engage in any other transaction involving such securities, and earn brokerage or other compensation in respect of the foregoing. Investments will be denominated in various currencies including US dollars and Euro and thus will be subject to any fluctuation in exchange rates between US dollars and Euro or foreign currencies and the currency of your own jurisdiction. Such fluctuations may have an adverse effect on the value, price or income return of the investment.
To the extent permitted by law, Phillip Securities Research, or persons associated with or connected to Phillip Securities Research, including but not limited to its officers, directors, employees or persons involved in the issuance of this report, may at any time engage in any of the above activities as set out above or otherwise hold an interest, whether material or not, in respect of companies and investments or related investments, which may be mentioned in this report. Accordingly, information may be available to Phillip Securities Research, or persons associated with or connected to Phillip Securities Research, including but not limited to its officers, directors, employees or persons involved in the issuance of this report, which is not reflected in this report, and Phillip Securities Research, or persons associated with or connected to Phillip Securities Research, including but not limited to its officers, directors, employees or persons involved in the issuance of this report, may, to the extent permitted by law, have acted upon or used the information prior to or immediately following its publication. Phillip Securities Research, or persons associated with or connected to Phillip Securities Research, including but not limited its officers, directors, employees or persons involved in the issuance of this report, may have issued other material that is inconsistent with, or reach different conclusions from, the contents of this report.
The information, tools and material presented herein are not directed, intended for distribution to or use by, any person or entity in any jurisdiction or country where such distribution, publication, availability or use would be contrary to the applicable law or regulation or which would subject Phillip Securities Research to any registration or licensing or other requirement, or penalty for contravention of such requirements within such jurisdiction.
This report is intended for general circulation only and does not take into account the specific investment objectives, financial situation or particular needs of any particular person. The products mentioned in this report may not be suitable for all investors and a person receiving or reading this report should seek advice from a professional and financial adviser regarding the legal, business, financial, tax and other aspects including the suitability of such products, taking into account the specific investment objectives, financial situation or particular needs of that person, before making a commitment to invest in any of such products.
This report is not intended for distribution, publication to or use by any person in any jurisdiction outside of Singapore or any other jurisdiction as Phillip Securities Research may determine in its absolute discretion.
IMPORTANT DISCLOSURES FOR INCLUDED RESEARCH ANALYSES OR REPORTS OF FOREIGN RESEARCH HOUSE
Where the report contains research analyses or reports from a foreign research house, please note: