
Report type: Weekly Strategy
September – a Month That Sees a Rise in Volatility
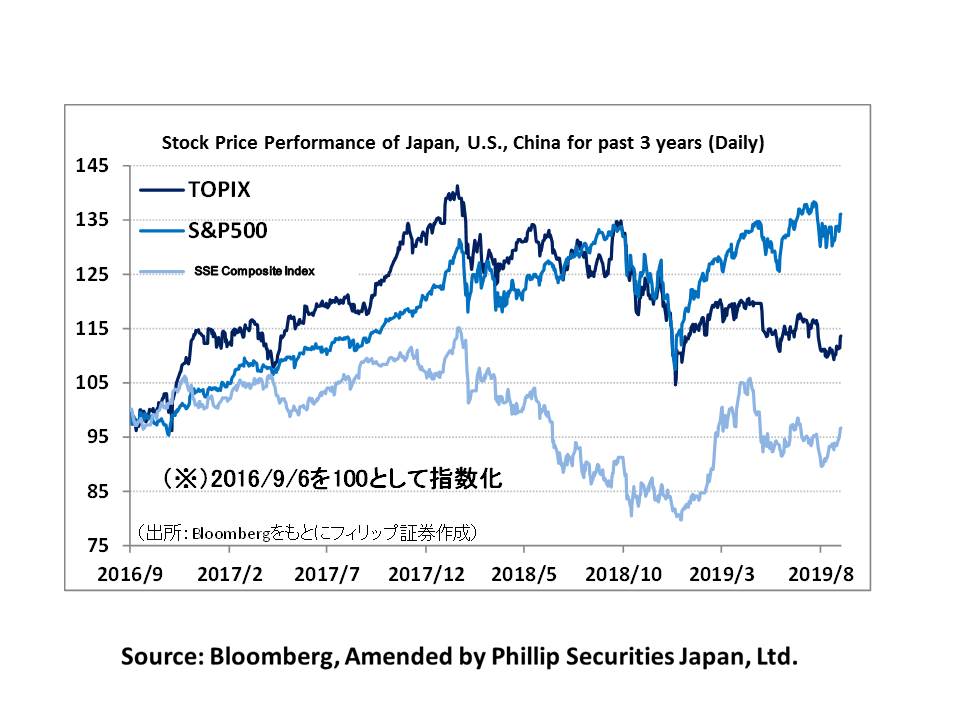
The Japanese stock market in the week of 2/9 saw an unprecedented low level of trading with the TSE Section 1’s trading value on 2-3/9 at the 1.3 trillion yen level and slightly under 1.6 trillion yen on 4/9. Just as how the stock market saying goes, “Don’t sell when the market is quiet”, despite Nikkei average stock prices showing stable movements around the low of 20,500 points, on 5/9, its trading value increased to slightly under 2.5 trillion yen and exceeded the turning point of 21,000 points to reach the 21,200 point level on 6/9, which was a situation that saw the saying, “at the end of the storm comes the sunshine” coming true.
As also previously mentioned in our 1/4 weekly report issue of “Ichiro’s retirement and the Nikkei average’s 21,000 points”, the 21,000 point level of the Nikkei average is a significant turning point for the market in terms of both the mid and long term, with the Nikkei average having marked the year’s high prices of 20,952 points in June 2015 and 20,946 points in August of the same year. In 2018, after falling to 20,950 points on 14/2, it rebounded to 22,502 points on 27/2, and after falling to 20,971 points on 26/10 it returned to 22,698 points on 3/12. Also, based on examples such as since entering this year, after marking 20,933 points on 11/3, 20,911 points on 25/3, 20,751 points on 14/5, 20,932 points on 13/6 and 20,993 points on 18/7, it shifted towards a temporary rebound, etc., we can presume that it acts as an important price mark. Also, in terms of the mid, long and short term, as a level that often serves as a turning point and balances the buying and selling demand, we need to keep an eye on it in the future as well.
Next, there is a need to note that the volatility of the Nikkei average tends to rise in September. In 2017, when the snap election was the hot topic, after marking the lowest price of 19,239 points on 8/9, it rose to 23,382 points on 9/11, and when the Turkish lira issue that took place from summer 2018 was dragging out, as a result of the 6.25% interest rate hike by Turkish central bank, it broke the 23,000 point resistance line on 14/9 and rose to 24,448 points on 2/10. Movements from 5/9 onwards also suggest a rise in volatility in September this year. The dates of 8/9 in 2017 and 14/9 in 2018 were the MSQ (Major Special Quotation) days, which also coincided with the last days for the settlement of futures and option transactions, and the MSQ this year is 13/9.
However, judging from October onwards, the situation differs from 2017 and 2018. 2017 saw a widespread optimistic mood in the stock market due to it being the first year of the Trump administration, while in 2018, attention began shifting on the US-China cold war due to Vice President Pence’s address, and also for this year, President Trump’s invocation of tariffs against China announced on 5/5 and 1/8 poured cold water over the stock market. All of these come full circle from the Jan-Mar and Apr-Jun term financial results of US companies, and also share the fact that they fall in the period of the high stock price zone, therefore, for this year as well, there is a need to pay attention to the period of the Jul-Sep term financial results.
For the 9/9 issue, we will be covering Komatsu (6301), Honda (7267), Workman (7564), Japan Tissue Engineering (7774) Mitsui & Co. (8031) and Credit Saison (8253).
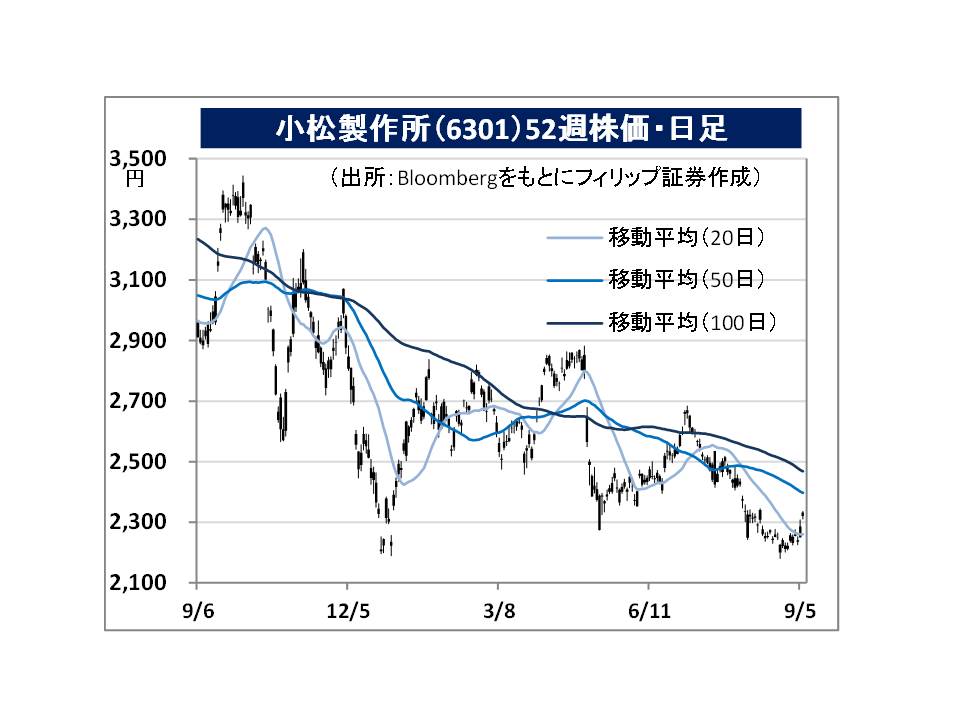
・Established in 1921. Handles “construction machinery / vehicles” such as hydraulic excavators and bulldozers, etc. as their mainstay, as well as “industrial machines” such as press machines, etc., and also “retail finance”, which is the retail finance of construction / mining machinery.
・For 1Q (Apr-Jun) results of FY2020/3 announced on 29/7, net sales decreased by 5.6% 609.767 billion yen compared to the same period the previous year, and operating income decreased by 22.2% 74.76 billion yen. The fall in demand of construction machinery / vehicles focusing in China and Asia have affected. On the other hand, the number of orders to introduce “Smart Construction” in the construction site increased to over 8,200 in Japan.
・For FY2020/3 plan, net sales is expected to decrease by 4.0% to 2.617 trillion yen compared to the previous year, and operating income to decrease by 15.3% to 337 billion yen. On 26/8, company announced the relocation to Indonesia’s capital. “Komatsu” market shares at 36% holds the firm top spot in the construction machinery market in Indonesia, and we can expect it to benefit the company. Announced the startup of the new company, Land Data Bank, in Japan on 30/8. The launch of the financial service for mid and small construction vendors is garnering attention.
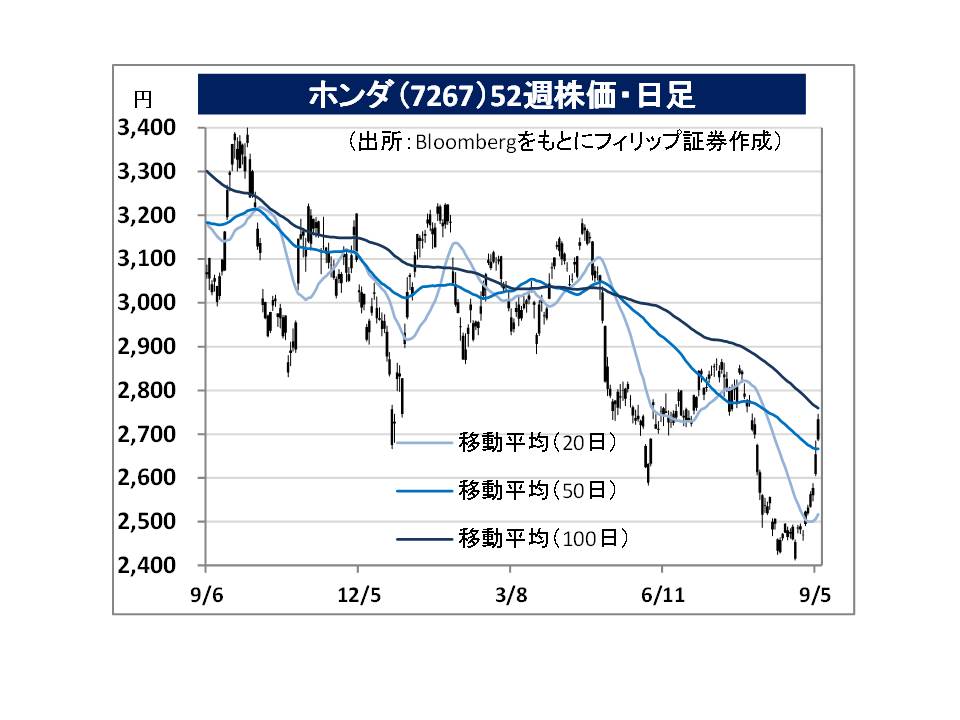
・Founded in 1946. Carries out the motorcycle business, automobile business, financial services business and power products business, etc. Offers a wide range of vehicles from their Kei car “N-BOX” to global models “Accord” and “CR-V”, and the North American pickup truck “Ridgeline”, to the sports car “NSX”. Launched the “HondaJet” aircraft in 2015.
・For 1Q (Apr-Jun) results of FY2020/3 announced on 2/8, net sales decreased by 0.7% to 3.996253 trillion yen compared to the same period the previous year, operating income decreased by 15.7% to 252.469 billion yen, and net income decreased by 29.5% to 172.302 billion yen. Automobile sales in the US and India have been sluggish. However, apart from exchange rate fluctuations and temporary factors, etc., base increase in business profit was at 10.8 billion yen.
・For its full year plan, net sales is expected to decrease by 1.5% to 15.65 trillion yen compared to the previous year, operating income to increase by 6.0% to 770 billion yen, and net income to increase by 5.7% to 645 billion yen. Monthly retail units for August announced by their US subsidiary, American Honda Motor, showed a 17.6% YOY increase to 173,993 units for the total number of passenger cars and trucks.
Important Information
This report is prepared and/or distributed by Phillip Securities Research Pte Ltd ("Phillip Securities Research"), which is a holder of a financial adviser’s licence under the Financial Advisers Act, Chapter 110 in Singapore.
By receiving or reading this report, you agree to be bound by the terms and limitations set out below. Any failure to comply with these terms and limitations may constitute a violation of law. This report has been provided to you for personal use only and shall not be reproduced, distributed or published by you in whole or in part, for any purpose. If you have received this report by mistake, please delete or destroy it, and notify the sender immediately.
The information and any analysis, forecasts, projections, expectations and opinions (collectively, the “Research”) contained in this report has been obtained from public sources which Phillip Securities Research believes to be reliable. However, Phillip Securities Research does not make any representation or warranty, express or implied that such information or Research is accurate, complete or appropriate or should be relied upon as such. Any such information or Research contained in this report is subject to change, and Phillip Securities Research shall not have any responsibility to maintain or update the information or Research made available or to supply any corrections, updates or releases in connection therewith.
Any opinions, forecasts, assumptions, estimates, valuations and prices contained in this report are as of the date indicated and are subject to change at any time without prior notice. Past performance of any product referred to in this report is not indicative of future results.
This report does not constitute, and should not be used as a substitute for, tax, legal or investment advice. This report should not be relied upon exclusively or as authoritative, without further being subject to the recipient’s own independent verification and exercise of judgment. The fact that this report has been made available constitutes neither a recommendation to enter into a particular transaction, nor a representation that any product described in this report is suitable or appropriate for the recipient. Recipients should be aware that many of the products, which may be described in this report involve significant risks and may not be suitable for all investors, and that any decision to enter into transactions involving such products should not be made, unless all such risks are understood and an independent determination has been made that such transactions would be appropriate. Any discussion of the risks contained herein with respect to any product should not be considered to be a disclosure of all risks or a complete discussion of such risks.
Nothing in this report shall be construed to be an offer or solicitation for the purchase or sale of any product. Any decision to purchase any product mentioned in this report should take into account existing public information, including any registered prospectus in respect of such product.
Phillip Securities Research, or persons associated with or connected to Phillip Securities Research, including but not limited to its officers, directors, employees or persons involved in the issuance of this report, may provide an array of financial services to a large number of corporations in Singapore and worldwide, including but not limited to commercial / investment banking activities (including sponsorship, financial advisory or underwriting activities), brokerage or securities trading activities. Phillip Securities Research, or persons associated with or connected to Phillip Securities Research, including but not limited to its officers, directors, employees or persons involved in the issuance of this report, may have participated in or invested in transactions with the issuer(s) of the securities mentioned in this report, and may have performed services for or solicited business from such issuers. Additionally, Phillip Securities Research, or persons associated with or connected to Phillip Securities Research, including but not limited to its officers, directors, employees or persons involved in the issuance of this report, may have provided advice or investment services to such companies and investments or related investments, as may be mentioned in this report.
Phillip Securities Research or persons associated with or connected to Phillip Securities Research, including but not limited to its officers, directors, employees or persons involved in the issuance of this report may, from time to time maintain a long or short position in securities referred to herein, or in related futures or options, purchase or sell, make a market in, or engage in any other transaction involving such securities, and earn brokerage or other compensation in respect of the foregoing. Investments will be denominated in various currencies including US dollars and Euro and thus will be subject to any fluctuation in exchange rates between US dollars and Euro or foreign currencies and the currency of your own jurisdiction. Such fluctuations may have an adverse effect on the value, price or income return of the investment.
To the extent permitted by law, Phillip Securities Research, or persons associated with or connected to Phillip Securities Research, including but not limited to its officers, directors, employees or persons involved in the issuance of this report, may at any time engage in any of the above activities as set out above or otherwise hold an interest, whether material or not, in respect of companies and investments or related investments, which may be mentioned in this report. Accordingly, information may be available to Phillip Securities Research, or persons associated with or connected to Phillip Securities Research, including but not limited to its officers, directors, employees or persons involved in the issuance of this report, which is not reflected in this report, and Phillip Securities Research, or persons associated with or connected to Phillip Securities Research, including but not limited to its officers, directors, employees or persons involved in the issuance of this report, may, to the extent permitted by law, have acted upon or used the information prior to or immediately following its publication. Phillip Securities Research, or persons associated with or connected to Phillip Securities Research, including but not limited its officers, directors, employees or persons involved in the issuance of this report, may have issued other material that is inconsistent with, or reach different conclusions from, the contents of this report.
The information, tools and material presented herein are not directed, intended for distribution to or use by, any person or entity in any jurisdiction or country where such distribution, publication, availability or use would be contrary to the applicable law or regulation or which would subject Phillip Securities Research to any registration or licensing or other requirement, or penalty for contravention of such requirements within such jurisdiction.
This report is intended for general circulation only and does not take into account the specific investment objectives, financial situation or particular needs of any particular person. The products mentioned in this report may not be suitable for all investors and a person receiving or reading this report should seek advice from a professional and financial adviser regarding the legal, business, financial, tax and other aspects including the suitability of such products, taking into account the specific investment objectives, financial situation or particular needs of that person, before making a commitment to invest in any of such products.
This report is not intended for distribution, publication to or use by any person in any jurisdiction outside of Singapore or any other jurisdiction as Phillip Securities Research may determine in its absolute discretion.
IMPORTANT DISCLOSURES FOR INCLUDED RESEARCH ANALYSES OR REPORTS OF FOREIGN RESEARCH HOUSE
Where the report contains research analyses or reports from a foreign research house, please note: