Modest 2017 Sales
INTP recorded domestic cement sales of 1.5 mn tonnes (+6.3% YoY) in December 2017. Cumulatively, this gave INTP domestic cement sales of 16.8 mn tonnes (+2.5% YoY) throughout 2017 which marks the first domestic cement sales increase since 2014 though the growth is far below the national cement demand growth of 7%. Nonetheless, INTP’s 2017 cement export have declined significantly by 73.5% YoY (19.1 vs 72 mn tonnes). Its Clinker Export also plunged by 88.2%. INTP total cement sales in 2017 stood at 16.8 mn tonnes (+2.1% YoY), in line with our forecast (98%) of 17.14 mn tonnes.
Geographical Sales Performance
Java is still the driving force where INTP posted sales growth of 6.64% YoY, though its growth was surpassed by Bali & Nusa Tenggara’s of 8.78%. Those are the only two sales areas that reported positive sales growth. Sales in Java mainly driven by an increase in cement sales in East Java (19%), Central Java (11%) and West Java (10%). On the other hand, the biggest decline in cement sales occurred in Eastern Indonesia (-24%) and Kalimantan (-5.5%).
Sustained Decline of Market Share
INTP experienced declining market share once again for the fifth year in a row. In 2017, its domestic market share declined by 112 bps to 25.3%. Largest decrease in market share could be found in Eastern Indonesia (-436 bps), followed by Java (-136 bps) and Sulawesi (-130 bps). The only region that reported positive growth in market share is Bali & Nusa Tenggara where INTP’s market share in the area increased by 102 bps to 34.1% (vs 33.1% in 2016). Decreases also occurred in its home market (Jakarta, Banten, West java). Its market share in Jakarta dropped by 420 bps (39.6% in FY17 vs 43.8% in FY16). Despite the increase in volume, INTP’s market shares in Banten and West Java declined by 245 bps and 7 bps respectively.
Robust National Cement Industry Performance
2017 demand growth proved to be very bright, cement consumption grew above 5.5% for the first time since 2013. As of 2013, domestic cement consumption grew at a diminished rate until it reached the bottom at 0.02% in 2016 (5.5% in FY13; 3.3% in FY14; 3.5% in FY15; 0.02% in FY16).
National Cement Consumption in 2017 reached 66.35 mn tonnes (+7% YoY) on the back of the ongoing and completed massive infrastructure development projects, such as Trans Java & Trans Sumatera Toll Road, Cross Country Border Posts (PLBN), dams and bridges among others, which is reflected by the sturdy growth from bulk cement consumption (+10.6% YoY). Meanwhile, bag cement demand rose by 6% YoY corresponding to moderate increase of bag cement demand by property sector supported by the government’s 1 mn housing program. Ministry of Public Works & Public Housing (PUPR) through General Directorate of Housing Provision (Ditjen PP-PUPR) reported that the program has built 99,589 housing in 2017 and cumulatively reached 904,758 housings until the end of last year.
Geographically, Java experienced the highest YoY growth in cement consumption with 11%, followed by Bali & Nusa Tenggara (5.5%) and Sumatera (4.2%). Only Kalimantan and Sulawesi reported a decline in demand growth (-1.8% and -2.2%). Furthermore total, exports for 2017 reached 2.8 mn tonnes (+75.9% YoY) making the total national cement sales volume to be 69.2 mn tonnes (+8.75% YoY).
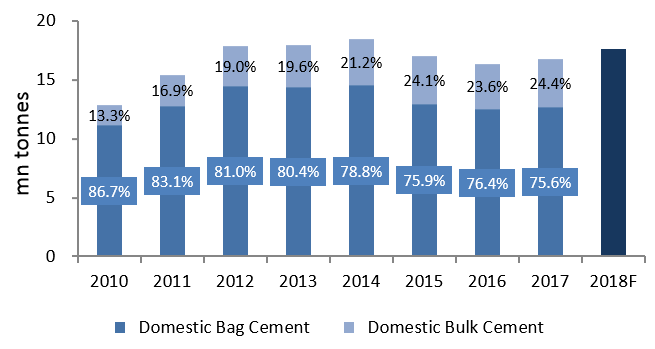
Figure 1 – INTP Domestic Cement Sales Volume and Bag-Bulk Proportion
Important Information
This report is prepared and/or distributed by Phillip Securities Research Pte Ltd ("Phillip Securities Research"), which is a holder of a financial adviser’s licence under the Financial Advisers Act, Chapter 110 in Singapore.
By receiving or reading this report, you agree to be bound by the terms and limitations set out below. Any failure to comply with these terms and limitations may constitute a violation of law. This report has been provided to you for personal use only and shall not be reproduced, distributed or published by you in whole or in part, for any purpose. If you have received this report by mistake, please delete or destroy it, and notify the sender immediately.
The information and any analysis, forecasts, projections, expectations and opinions (collectively, the “Research”) contained in this report has been obtained from public sources which Phillip Securities Research believes to be reliable. However, Phillip Securities Research does not make any representation or warranty, express or implied that such information or Research is accurate, complete or appropriate or should be relied upon as such. Any such information or Research contained in this report is subject to change, and Phillip Securities Research shall not have any responsibility to maintain or update the information or Research made available or to supply any corrections, updates or releases in connection therewith.
Any opinions, forecasts, assumptions, estimates, valuations and prices contained in this report are as of the date indicated and are subject to change at any time without prior notice. Past performance of any product referred to in this report is not indicative of future results.
This report does not constitute, and should not be used as a substitute for, tax, legal or investment advice. This report should not be relied upon exclusively or as authoritative, without further being subject to the recipient’s own independent verification and exercise of judgment. The fact that this report has been made available constitutes neither a recommendation to enter into a particular transaction, nor a representation that any product described in this report is suitable or appropriate for the recipient. Recipients should be aware that many of the products, which may be described in this report involve significant risks and may not be suitable for all investors, and that any decision to enter into transactions involving such products should not be made, unless all such risks are understood and an independent determination has been made that such transactions would be appropriate. Any discussion of the risks contained herein with respect to any product should not be considered to be a disclosure of all risks or a complete discussion of such risks.
Nothing in this report shall be construed to be an offer or solicitation for the purchase or sale of any product. Any decision to purchase any product mentioned in this report should take into account existing public information, including any registered prospectus in respect of such product.
Phillip Securities Research, or persons associated with or connected to Phillip Securities Research, including but not limited to its officers, directors, employees or persons involved in the issuance of this report, may provide an array of financial services to a large number of corporations in Singapore and worldwide, including but not limited to commercial / investment banking activities (including sponsorship, financial advisory or underwriting activities), brokerage or securities trading activities. Phillip Securities Research, or persons associated with or connected to Phillip Securities Research, including but not limited to its officers, directors, employees or persons involved in the issuance of this report, may have participated in or invested in transactions with the issuer(s) of the securities mentioned in this report, and may have performed services for or solicited business from such issuers. Additionally, Phillip Securities Research, or persons associated with or connected to Phillip Securities Research, including but not limited to its officers, directors, employees or persons involved in the issuance of this report, may have provided advice or investment services to such companies and investments or related investments, as may be mentioned in this report.
Phillip Securities Research or persons associated with or connected to Phillip Securities Research, including but not limited to its officers, directors, employees or persons involved in the issuance of this report may, from time to time maintain a long or short position in securities referred to herein, or in related futures or options, purchase or sell, make a market in, or engage in any other transaction involving such securities, and earn brokerage or other compensation in respect of the foregoing. Investments will be denominated in various currencies including US dollars and Euro and thus will be subject to any fluctuation in exchange rates between US dollars and Euro or foreign currencies and the currency of your own jurisdiction. Such fluctuations may have an adverse effect on the value, price or income return of the investment.
To the extent permitted by law, Phillip Securities Research, or persons associated with or connected to Phillip Securities Research, including but not limited to its officers, directors, employees or persons involved in the issuance of this report, may at any time engage in any of the above activities as set out above or otherwise hold an interest, whether material or not, in respect of companies and investments or related investments, which may be mentioned in this report. Accordingly, information may be available to Phillip Securities Research, or persons associated with or connected to Phillip Securities Research, including but not limited to its officers, directors, employees or persons involved in the issuance of this report, which is not reflected in this report, and Phillip Securities Research, or persons associated with or connected to Phillip Securities Research, including but not limited to its officers, directors, employees or persons involved in the issuance of this report, may, to the extent permitted by law, have acted upon or used the information prior to or immediately following its publication. Phillip Securities Research, or persons associated with or connected to Phillip Securities Research, including but not limited its officers, directors, employees or persons involved in the issuance of this report, may have issued other material that is inconsistent with, or reach different conclusions from, the contents of this report.
The information, tools and material presented herein are not directed, intended for distribution to or use by, any person or entity in any jurisdiction or country where such distribution, publication, availability or use would be contrary to the applicable law or regulation or which would subject Phillip Securities Research to any registration or licensing or other requirement, or penalty for contravention of such requirements within such jurisdiction.
This report is intended for general circulation only and does not take into account the specific investment objectives, financial situation or particular needs of any particular person. The products mentioned in this report may not be suitable for all investors and a person receiving or reading this report should seek advice from a professional and financial adviser regarding the legal, business, financial, tax and other aspects including the suitability of such products, taking into account the specific investment objectives, financial situation or particular needs of that person, before making a commitment to invest in any of such products.
This report is not intended for distribution, publication to or use by any person in any jurisdiction outside of Singapore or any other jurisdiction as Phillip Securities Research may determine in its absolute discretion.
IMPORTANT DISCLOSURES FOR INCLUDED RESEARCH ANALYSES OR REPORTS OF FOREIGN RESEARCH HOUSE
Where the report contains research analyses or reports from a foreign research house, please note: