This article was published on Business Times’ column “Chart Point” on 25 September 2017.
While scanning through the long-term chart of the Hang Seng Index (HSI), we noticed an intriguing cycle playing out in the 7th year of each decade, going back to 1980s. Some market crisis event tends to happen in the 7th year resulting in a dramatic correction in the HSI.
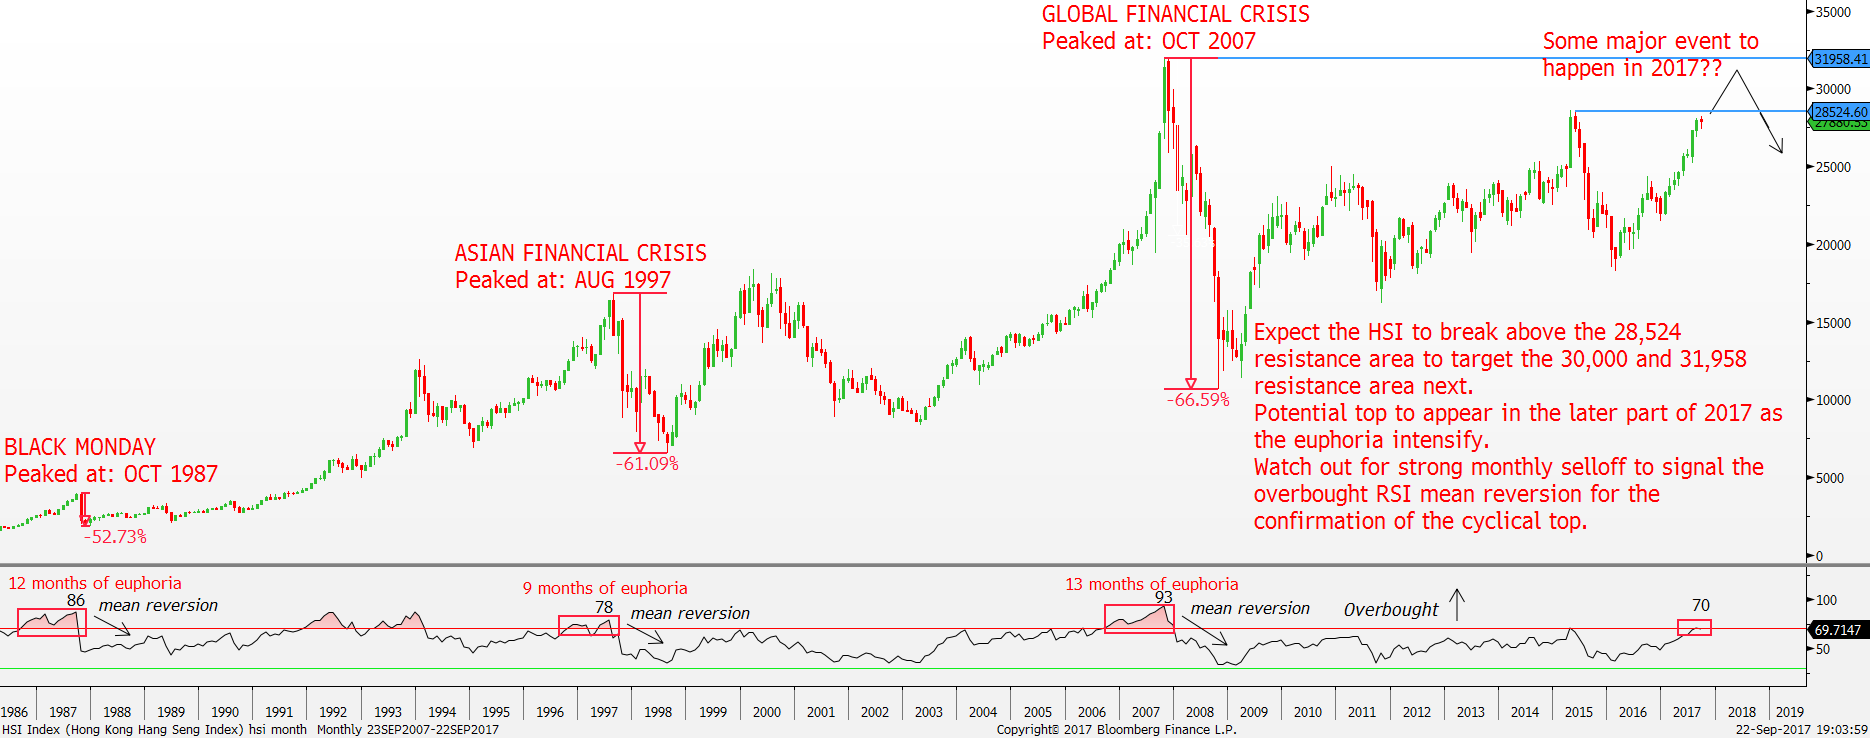
HSI Monthly chart Source: Bloomberg, PSR
The first of the example occurred in October 1987 where the infamous Black Monday wiped out 52% of the HSI within nine weeks due to the erroneous program trading and illiquidity.
The second correction triggered by the 7th year cycle happened in August 1997 where the market experienced the Asian Financial Crisis (AFC). During that period, the HSI crashed 61% before finding a bottom 14 months later. The main trigger of panic during the AFC stemmed from the fixed exchange rate system that Thailand and Hong Kong adopted where their currencies were pegged to the US dollar. The excessive current account deficits and the shortage of foreign reserves led to the break of the fixed exchange rate mechanism as massive speculative attacks took place in the FX market leading to a widespread panic.
The Global Financial Crisis (GFC) brought on the most recent example of the 7th year cycle as the HSI peaked out in October 2007 and plummeted 66% in the following 14 months. Excessive risk taking and moral hazard within the subprime housing market was the main culprit for the GFC as the adjustment of the low teaser interest rate resulted in a wave of default, ultimately dragging down the financial market due to securitisation.
Key traits of the 7th year cycle:
As we march into the second half of 2017, it should be an interesting time to see if the 7th year cycle holds up again. If history is any guide, the current bullish momentum within the HSI should continue to stay strong as we expect the HSI to break above the 2015 high of 28,524 like how the prior cycle played out as the peak tends to be located off a record high point. An eventual major turning point should appear in the later part of 2017 once the HSI takes out the 28,524 resistance area where a fall of 50% or more could materialise.
One way to spot for the major turning point if the 7th year cycle holds is to study the Relative Strength Index (RSI). The 7th year cycle tops from 1987, 1997 and 2007 were all signalled when the RSI exceeded 70. Final confirmation of the bearish top can be identified when the RSI mean reverts back below the 70. Keep in mind the RSI can stay above the 70 overbought region for an extended period just like the 2000s housing boom period. The RSI first entered overbought in August 2006 and the 7th year top only came in one year later in October 2007 after the RSI renormalised back below the 70 overbought region.
In summary, we expect the HSI to continue with the ongoing uptrend to break above the 28,524 resistance area to retest the 30,000 psychological resistance area next followed by 31,958. The HSI just recently entered into overbought condition once again in August 2017 and currently stands at 70 suggesting an early stage of the euphoria. Further upside is needed to achieve the excessive euphoria status for the RSI to extend above 75. Once extreme euphoria sets in, look out for major selloff on a monthly basis to confirm the mean reversion of the RSI to spot for the possible 7th year cycle top. That will be the time where the next crisis possibly blows up where a correction greater than 50% might happen. All is well for now.
Important Information
This report is prepared and/or distributed by Phillip Securities Research Pte Ltd ("Phillip Securities Research"), which is a holder of a financial adviser’s licence under the Financial Advisers Act, Chapter 110 in Singapore.
By receiving or reading this report, you agree to be bound by the terms and limitations set out below. Any failure to comply with these terms and limitations may constitute a violation of law. This report has been provided to you for personal use only and shall not be reproduced, distributed or published by you in whole or in part, for any purpose. If you have received this report by mistake, please delete or destroy it, and notify the sender immediately.
The information and any analysis, forecasts, projections, expectations and opinions (collectively, the “Research”) contained in this report has been obtained from public sources which Phillip Securities Research believes to be reliable. However, Phillip Securities Research does not make any representation or warranty, express or implied that such information or Research is accurate, complete or appropriate or should be relied upon as such. Any such information or Research contained in this report is subject to change, and Phillip Securities Research shall not have any responsibility to maintain or update the information or Research made available or to supply any corrections, updates or releases in connection therewith.
Any opinions, forecasts, assumptions, estimates, valuations and prices contained in this report are as of the date indicated and are subject to change at any time without prior notice. Past performance of any product referred to in this report is not indicative of future results.
This report does not constitute, and should not be used as a substitute for, tax, legal or investment advice. This report should not be relied upon exclusively or as authoritative, without further being subject to the recipient’s own independent verification and exercise of judgment. The fact that this report has been made available constitutes neither a recommendation to enter into a particular transaction, nor a representation that any product described in this report is suitable or appropriate for the recipient. Recipients should be aware that many of the products, which may be described in this report involve significant risks and may not be suitable for all investors, and that any decision to enter into transactions involving such products should not be made, unless all such risks are understood and an independent determination has been made that such transactions would be appropriate. Any discussion of the risks contained herein with respect to any product should not be considered to be a disclosure of all risks or a complete discussion of such risks.
Nothing in this report shall be construed to be an offer or solicitation for the purchase or sale of any product. Any decision to purchase any product mentioned in this report should take into account existing public information, including any registered prospectus in respect of such product.
Phillip Securities Research, or persons associated with or connected to Phillip Securities Research, including but not limited to its officers, directors, employees or persons involved in the issuance of this report, may provide an array of financial services to a large number of corporations in Singapore and worldwide, including but not limited to commercial / investment banking activities (including sponsorship, financial advisory or underwriting activities), brokerage or securities trading activities. Phillip Securities Research, or persons associated with or connected to Phillip Securities Research, including but not limited to its officers, directors, employees or persons involved in the issuance of this report, may have participated in or invested in transactions with the issuer(s) of the securities mentioned in this report, and may have performed services for or solicited business from such issuers. Additionally, Phillip Securities Research, or persons associated with or connected to Phillip Securities Research, including but not limited to its officers, directors, employees or persons involved in the issuance of this report, may have provided advice or investment services to such companies and investments or related investments, as may be mentioned in this report.
Phillip Securities Research or persons associated with or connected to Phillip Securities Research, including but not limited to its officers, directors, employees or persons involved in the issuance of this report may, from time to time maintain a long or short position in securities referred to herein, or in related futures or options, purchase or sell, make a market in, or engage in any other transaction involving such securities, and earn brokerage or other compensation in respect of the foregoing. Investments will be denominated in various currencies including US dollars and Euro and thus will be subject to any fluctuation in exchange rates between US dollars and Euro or foreign currencies and the currency of your own jurisdiction. Such fluctuations may have an adverse effect on the value, price or income return of the investment.
To the extent permitted by law, Phillip Securities Research, or persons associated with or connected to Phillip Securities Research, including but not limited to its officers, directors, employees or persons involved in the issuance of this report, may at any time engage in any of the above activities as set out above or otherwise hold an interest, whether material or not, in respect of companies and investments or related investments, which may be mentioned in this report. Accordingly, information may be available to Phillip Securities Research, or persons associated with or connected to Phillip Securities Research, including but not limited to its officers, directors, employees or persons involved in the issuance of this report, which is not reflected in this report, and Phillip Securities Research, or persons associated with or connected to Phillip Securities Research, including but not limited to its officers, directors, employees or persons involved in the issuance of this report, may, to the extent permitted by law, have acted upon or used the information prior to or immediately following its publication. Phillip Securities Research, or persons associated with or connected to Phillip Securities Research, including but not limited its officers, directors, employees or persons involved in the issuance of this report, may have issued other material that is inconsistent with, or reach different conclusions from, the contents of this report.
The information, tools and material presented herein are not directed, intended for distribution to or use by, any person or entity in any jurisdiction or country where such distribution, publication, availability or use would be contrary to the applicable law or regulation or which would subject Phillip Securities Research to any registration or licensing or other requirement, or penalty for contravention of such requirements within such jurisdiction.
This report is intended for general circulation only and does not take into account the specific investment objectives, financial situation or particular needs of any particular person. The products mentioned in this report may not be suitable for all investors and a person receiving or reading this report should seek advice from a professional and financial adviser regarding the legal, business, financial, tax and other aspects including the suitability of such products, taking into account the specific investment objectives, financial situation or particular needs of that person, before making a commitment to invest in any of such products.
This report is not intended for distribution, publication to or use by any person in any jurisdiction outside of Singapore or any other jurisdiction as Phillip Securities Research may determine in its absolute discretion.
IMPORTANT DISCLOSURES FOR INCLUDED RESEARCH ANALYSES OR REPORTS OF FOREIGN RESEARCH HOUSE
Where the report contains research analyses or reports from a foreign research house, please note:

Jeremy specialises in Technical Analysis and has 10 years of experience in studying price action. His areas of expertise include intermarket analysis on the equities, currencies, commodities and bonds market.
He is also a regular columnist on The Business Times - every Monday ChartPoint column.
He graduated with a Bachelor of Science in Banking and Finance from University of London.
