
This article was published in Business Times’ column “Chart Point” on 15 January 2018.
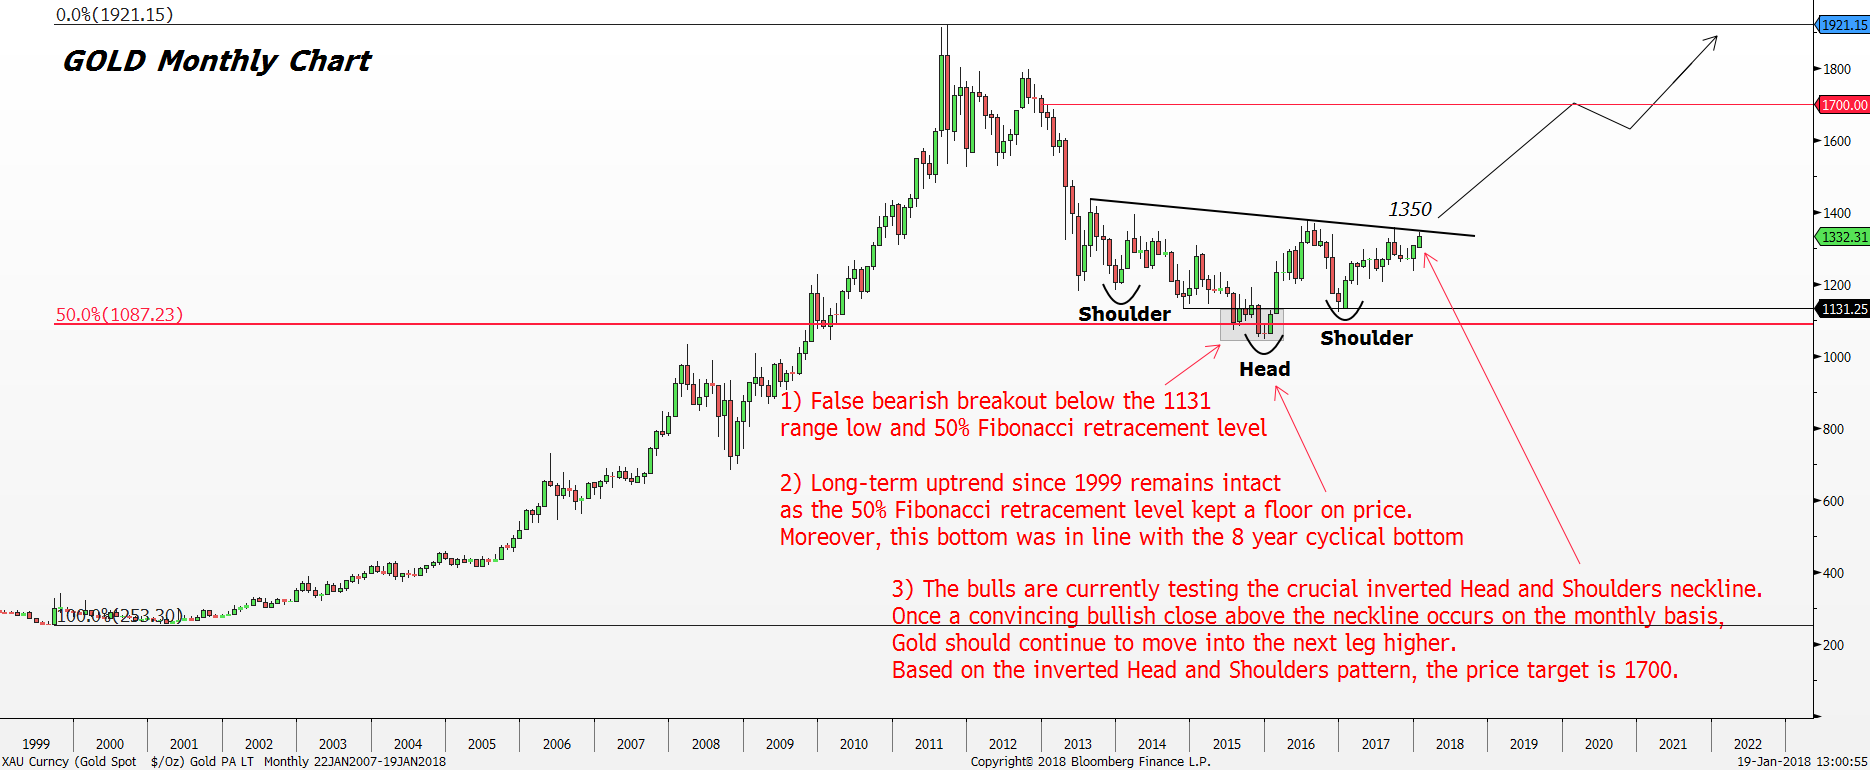
Gold Monthly Chart Source: Bloomberg, PSR
Since the December 2017 FOMC meeting, Gold price has been remarkably resilient despite the FED hiking Fed Funds Rates by 25 basis points to 1.50%. Instead of the widely expected sell-off, Gold rallied 7% with a similar bottoming price action pattern around the rate hike days, going back to the December 2015 rate hike.
First, let us examine the long-term trend for Gold. Since August 1999, the secular uptrend was set in motion. Gold experienced a raging bull run for the following 12 years where it all came to a screeching halt in September 2011. During the bull run, Gold price increased seven-fold from a low of $253 to a high of $1920.
A correction of 45% ensued after the $1920 record high was formed in 2011. Interesting, the bear market in Gold ended at a significant pivotal point as well. Using the August 1999 low and September 2011 high as the projection points for referencing our Fibonacci retracement levels, it highlighted an important level at $1088. The $1088 area was the 50% retracement level which in hindsight worked perfectly for halting the prolonged correction since 2011. This long-term Fibonacci retracement level has higher credibility because it has stood the test of time. The 50% retracement level is also one of the more important points for anticipating reversal as the uptrend regains control.
Gold did fall marginally below the 50% Fibonacci retracement level ($1088) in December 2015 to a low of $1046 shown by the highlighted area, but the bulls were ready to defend that key level. For the first half of 2016, Gold made strong advancement of up to 29% to a high of $1375, signalling a stable floor at around the long-term 50% Fibonacci retracement level ($1088) which we would not probably revisit anytime soon. Moreover, the firm bullish rejection off the $1088 area since December 2015 also coincided with the formation of the 8-year cycle making it a stronger bottoming point. Gold follows an 8-year cyclical bottom pattern where it forms a major bottom in between every eight years where it enters into an intense secular bull market. This has been true since 1985, and the pattern seems to be unfolding right in front of our eyes once again.
Relating back to current times, Gold is currently at a major crossroad to decide if the explosive bull run begins or not. With much consolidation since June 2013 where Gold price ranged between $1392 to $1131, a bullish reversal pattern was formed.
An inverted Head and Shoulders pattern was established after seeing a rally in 2017 as the formation of the right shoulder is completed. One can treat the bearish break below the $1131 range low in 2015 as a false breakout hence leading to the formation of the head to the inverted Head and Shoulders pattern. More importantly, for this bullish reversal formation to usher in more bullish momentum, the bulls need to break and close Gold price above the neckline (downtrend line) shown by the black line at $1350. As of now, price is testing that key area.
The longer the consolidation, the greater the move once the bullish breakout occurs. With Gold consolidating for the past four years, we can expect the rally to be forceful once it breaks out of the neckline. The target projection from the inverted Head and Shoulder pattern return a price target of $1700.
In summary, the long-term outlook for Gold remains solidly bullish as the 8–year cyclical bottom was firmly supported by the long-term 50% Fibonacci retracement level at $1088. The only missing key now is for the buyers to break and closed above the neckline ($1350) convincingly on a monthly basis to kick-start the raging bull market in Gold. Our long-term target on Gold is $1700 based on the inverted Head and Shoulders pattern and $1920 based on the 8-year cyclical bottom pattern.
Important Information
This report is prepared and/or distributed by Phillip Securities Research Pte Ltd ("Phillip Securities Research"), which is a holder of a financial adviser’s licence under the Financial Advisers Act, Chapter 110 in Singapore.
By receiving or reading this report, you agree to be bound by the terms and limitations set out below. Any failure to comply with these terms and limitations may constitute a violation of law. This report has been provided to you for personal use only and shall not be reproduced, distributed or published by you in whole or in part, for any purpose. If you have received this report by mistake, please delete or destroy it, and notify the sender immediately.
The information and any analysis, forecasts, projections, expectations and opinions (collectively, the “Research”) contained in this report has been obtained from public sources which Phillip Securities Research believes to be reliable. However, Phillip Securities Research does not make any representation or warranty, express or implied that such information or Research is accurate, complete or appropriate or should be relied upon as such. Any such information or Research contained in this report is subject to change, and Phillip Securities Research shall not have any responsibility to maintain or update the information or Research made available or to supply any corrections, updates or releases in connection therewith.
Any opinions, forecasts, assumptions, estimates, valuations and prices contained in this report are as of the date indicated and are subject to change at any time without prior notice. Past performance of any product referred to in this report is not indicative of future results.
This report does not constitute, and should not be used as a substitute for, tax, legal or investment advice. This report should not be relied upon exclusively or as authoritative, without further being subject to the recipient’s own independent verification and exercise of judgment. The fact that this report has been made available constitutes neither a recommendation to enter into a particular transaction, nor a representation that any product described in this report is suitable or appropriate for the recipient. Recipients should be aware that many of the products, which may be described in this report involve significant risks and may not be suitable for all investors, and that any decision to enter into transactions involving such products should not be made, unless all such risks are understood and an independent determination has been made that such transactions would be appropriate. Any discussion of the risks contained herein with respect to any product should not be considered to be a disclosure of all risks or a complete discussion of such risks.
Nothing in this report shall be construed to be an offer or solicitation for the purchase or sale of any product. Any decision to purchase any product mentioned in this report should take into account existing public information, including any registered prospectus in respect of such product.
Phillip Securities Research, or persons associated with or connected to Phillip Securities Research, including but not limited to its officers, directors, employees or persons involved in the issuance of this report, may provide an array of financial services to a large number of corporations in Singapore and worldwide, including but not limited to commercial / investment banking activities (including sponsorship, financial advisory or underwriting activities), brokerage or securities trading activities. Phillip Securities Research, or persons associated with or connected to Phillip Securities Research, including but not limited to its officers, directors, employees or persons involved in the issuance of this report, may have participated in or invested in transactions with the issuer(s) of the securities mentioned in this report, and may have performed services for or solicited business from such issuers. Additionally, Phillip Securities Research, or persons associated with or connected to Phillip Securities Research, including but not limited to its officers, directors, employees or persons involved in the issuance of this report, may have provided advice or investment services to such companies and investments or related investments, as may be mentioned in this report.
Phillip Securities Research or persons associated with or connected to Phillip Securities Research, including but not limited to its officers, directors, employees or persons involved in the issuance of this report may, from time to time maintain a long or short position in securities referred to herein, or in related futures or options, purchase or sell, make a market in, or engage in any other transaction involving such securities, and earn brokerage or other compensation in respect of the foregoing. Investments will be denominated in various currencies including US dollars and Euro and thus will be subject to any fluctuation in exchange rates between US dollars and Euro or foreign currencies and the currency of your own jurisdiction. Such fluctuations may have an adverse effect on the value, price or income return of the investment.
To the extent permitted by law, Phillip Securities Research, or persons associated with or connected to Phillip Securities Research, including but not limited to its officers, directors, employees or persons involved in the issuance of this report, may at any time engage in any of the above activities as set out above or otherwise hold an interest, whether material or not, in respect of companies and investments or related investments, which may be mentioned in this report. Accordingly, information may be available to Phillip Securities Research, or persons associated with or connected to Phillip Securities Research, including but not limited to its officers, directors, employees or persons involved in the issuance of this report, which is not reflected in this report, and Phillip Securities Research, or persons associated with or connected to Phillip Securities Research, including but not limited to its officers, directors, employees or persons involved in the issuance of this report, may, to the extent permitted by law, have acted upon or used the information prior to or immediately following its publication. Phillip Securities Research, or persons associated with or connected to Phillip Securities Research, including but not limited its officers, directors, employees or persons involved in the issuance of this report, may have issued other material that is inconsistent with, or reach different conclusions from, the contents of this report.
The information, tools and material presented herein are not directed, intended for distribution to or use by, any person or entity in any jurisdiction or country where such distribution, publication, availability or use would be contrary to the applicable law or regulation or which would subject Phillip Securities Research to any registration or licensing or other requirement, or penalty for contravention of such requirements within such jurisdiction.
This report is intended for general circulation only and does not take into account the specific investment objectives, financial situation or particular needs of any particular person. The products mentioned in this report may not be suitable for all investors and a person receiving or reading this report should seek advice from a professional and financial adviser regarding the legal, business, financial, tax and other aspects including the suitability of such products, taking into account the specific investment objectives, financial situation or particular needs of that person, before making a commitment to invest in any of such products.
This report is not intended for distribution, publication to or use by any person in any jurisdiction outside of Singapore or any other jurisdiction as Phillip Securities Research may determine in its absolute discretion.
IMPORTANT DISCLOSURES FOR INCLUDED RESEARCH ANALYSES OR REPORTS OF FOREIGN RESEARCH HOUSE
Where the report contains research analyses or reports from a foreign research house, please note:

Jeremy specialises in Technical Analysis and has 10 years of experience in studying price action. His areas of expertise include intermarket analysis on the equities, currencies, commodities and bonds market.
He is also a regular columnist on The Business Times - every Monday ChartPoint column.
He graduated with a Bachelor of Science in Banking and Finance from University of London.
