
This article was published on Business Times’ column “ChartPoint” on 11 September 2017.
Gold Monthly chart Source: Bloomberg, PSR
Tensions are rising once again in Korean Peninsula after North Korea recently launched a missile over Hokkaido and tested a Hydrogen Bomb that is five times as powerful as the atomic bomb dropped in World War 2. As the war scare looms, Gold and Silver acted perfectly as safe haven assets where Gold closed substantially above the $1300 psychological resistance and Silver closing above the $17.00 psychological resistance in August. More importantly, there seems to be a significant seismic shift in sentiment in Gold and Silver to the upside from the chart perspective.
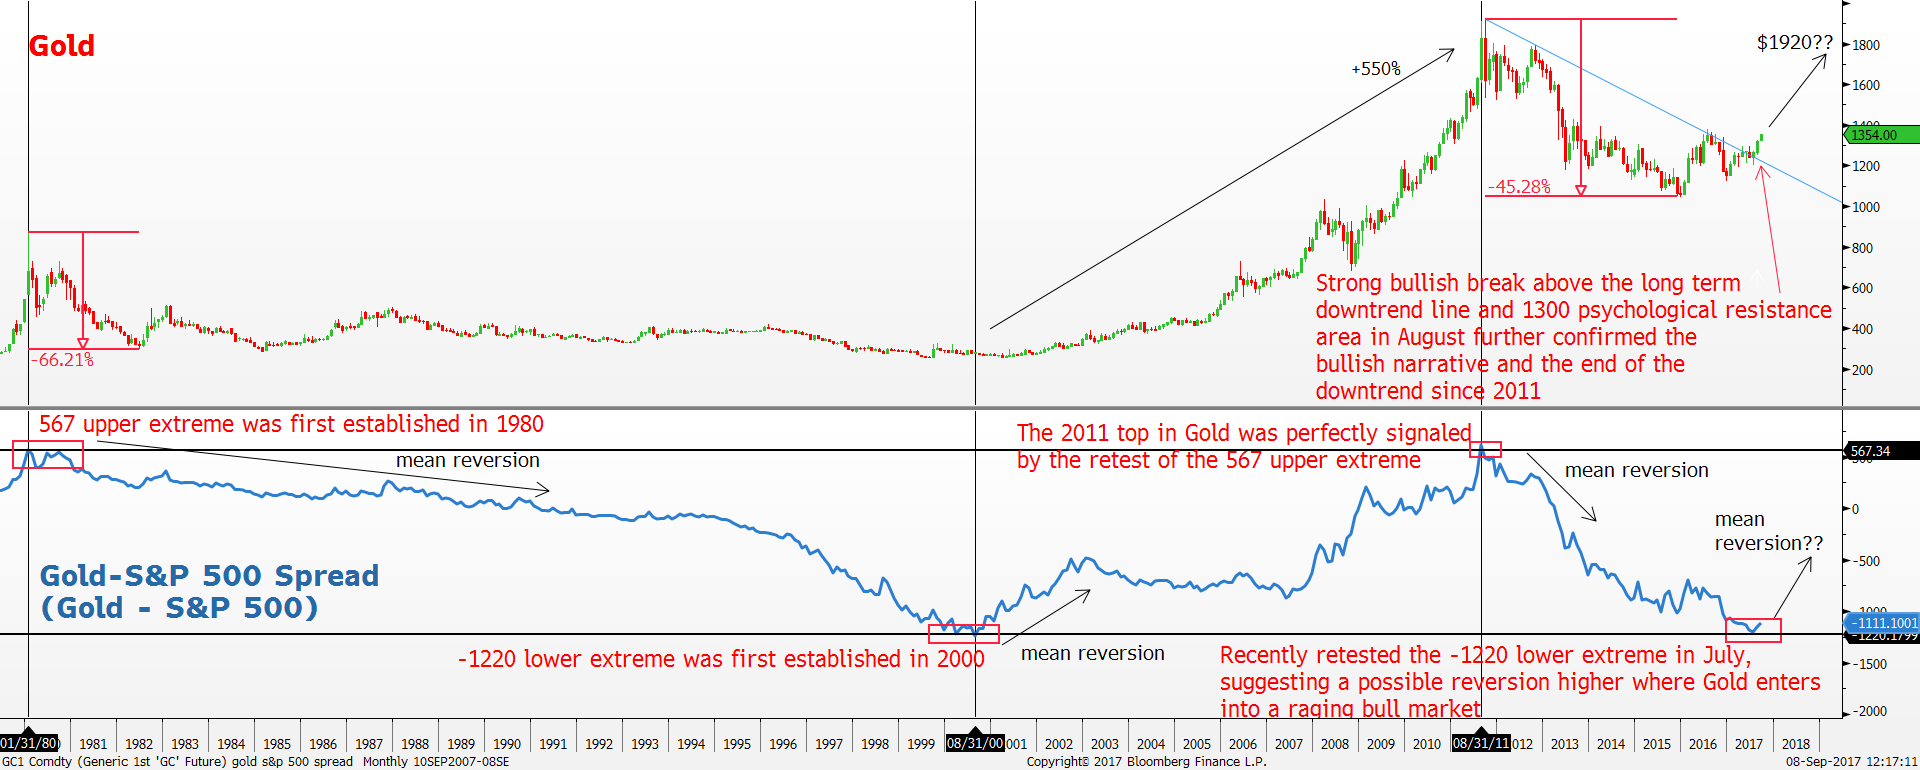
Gold has finally ditched the downtrend since 2011 after finding a bottom in December 2015 which we believe is the eight-year cyclical low. The key turning point for the shift in sentiment is shown by the monthly close above the long-term downtrend line since 2011. That coincided with the much-needed bullish close above the psychological $1300 resistance at the end of August 2017 with price closing at $1325. Likewise, in Silver, the long-term downtrend line from the peak in 2016 has also been breached to the upside. These bullish breaks further confirmed the idea of Gold forming its eight-year cyclical bottom in December 2015 where a secular uptrend is under way.
Another critical indicator has also recently triggered a buy signal in Gold, which reinforces the secular uptrend thesis. The Gold-S&P 500 spread is the difference between Gold and S&P 500 Index. It is currently at a pivotal juncture now.
As Gold is a safe haven asset while S&P 500 is a risk-on asset, when we are at the extreme lows of the Gold-S&P 500 spread chart, an excessive risk-on reaction is occurring, usually during peak euphoria. On the other hand, when the Gold-S&P 500 spread chart is at the upper boundary, it tends to signal extreme risk off environment. Historically, mean reversion happens at the extremes, causing major trend changes within the underlying asset such as Gold.
Notice how perfectly the Gold S&P 500 spread signalled the 2011 peak in Gold when the Gold-S&P 500 spread chart retested the 567 high, that was formed back in 1980. The multi-decade level actually held up and provided a perfect signal for the Gold’s top 30 years later in 2011 causing Gold to fall -45%.
Using this principle, the Gold-S&P 500 spread formed a similar bottom in 2001 at -1220, which in hindsight is the new extreme low. During that period, Gold entered a super bull market and appreciated 550% over ten years. If history was to repeat, we might be witnessing a once in a decade opportunity now as the Gold S&P 500 spread recently retested the -1220 low in July, suggesting a raging Gold bull market ahead of us with a target of $1920.
With the ongoing safe haven bid and new secular uptrend, Gold looks very likely to retest the 2016 high of $1375. For the near term price action, we expect some short-term correction around the $1375 resistance area before buyers try to break above it.
Important Information
This report is prepared and/or distributed by Phillip Securities Research Pte Ltd ("Phillip Securities Research"), which is a holder of a financial adviser’s licence under the Financial Advisers Act, Chapter 110 in Singapore.
By receiving or reading this report, you agree to be bound by the terms and limitations set out below. Any failure to comply with these terms and limitations may constitute a violation of law. This report has been provided to you for personal use only and shall not be reproduced, distributed or published by you in whole or in part, for any purpose. If you have received this report by mistake, please delete or destroy it, and notify the sender immediately.
The information and any analysis, forecasts, projections, expectations and opinions (collectively, the “Research”) contained in this report has been obtained from public sources which Phillip Securities Research believes to be reliable. However, Phillip Securities Research does not make any representation or warranty, express or implied that such information or Research is accurate, complete or appropriate or should be relied upon as such. Any such information or Research contained in this report is subject to change, and Phillip Securities Research shall not have any responsibility to maintain or update the information or Research made available or to supply any corrections, updates or releases in connection therewith.
Any opinions, forecasts, assumptions, estimates, valuations and prices contained in this report are as of the date indicated and are subject to change at any time without prior notice. Past performance of any product referred to in this report is not indicative of future results.
This report does not constitute, and should not be used as a substitute for, tax, legal or investment advice. This report should not be relied upon exclusively or as authoritative, without further being subject to the recipient’s own independent verification and exercise of judgment. The fact that this report has been made available constitutes neither a recommendation to enter into a particular transaction, nor a representation that any product described in this report is suitable or appropriate for the recipient. Recipients should be aware that many of the products, which may be described in this report involve significant risks and may not be suitable for all investors, and that any decision to enter into transactions involving such products should not be made, unless all such risks are understood and an independent determination has been made that such transactions would be appropriate. Any discussion of the risks contained herein with respect to any product should not be considered to be a disclosure of all risks or a complete discussion of such risks.
Nothing in this report shall be construed to be an offer or solicitation for the purchase or sale of any product. Any decision to purchase any product mentioned in this report should take into account existing public information, including any registered prospectus in respect of such product.
Phillip Securities Research, or persons associated with or connected to Phillip Securities Research, including but not limited to its officers, directors, employees or persons involved in the issuance of this report, may provide an array of financial services to a large number of corporations in Singapore and worldwide, including but not limited to commercial / investment banking activities (including sponsorship, financial advisory or underwriting activities), brokerage or securities trading activities. Phillip Securities Research, or persons associated with or connected to Phillip Securities Research, including but not limited to its officers, directors, employees or persons involved in the issuance of this report, may have participated in or invested in transactions with the issuer(s) of the securities mentioned in this report, and may have performed services for or solicited business from such issuers. Additionally, Phillip Securities Research, or persons associated with or connected to Phillip Securities Research, including but not limited to its officers, directors, employees or persons involved in the issuance of this report, may have provided advice or investment services to such companies and investments or related investments, as may be mentioned in this report.
Phillip Securities Research or persons associated with or connected to Phillip Securities Research, including but not limited to its officers, directors, employees or persons involved in the issuance of this report may, from time to time maintain a long or short position in securities referred to herein, or in related futures or options, purchase or sell, make a market in, or engage in any other transaction involving such securities, and earn brokerage or other compensation in respect of the foregoing. Investments will be denominated in various currencies including US dollars and Euro and thus will be subject to any fluctuation in exchange rates between US dollars and Euro or foreign currencies and the currency of your own jurisdiction. Such fluctuations may have an adverse effect on the value, price or income return of the investment.
To the extent permitted by law, Phillip Securities Research, or persons associated with or connected to Phillip Securities Research, including but not limited to its officers, directors, employees or persons involved in the issuance of this report, may at any time engage in any of the above activities as set out above or otherwise hold an interest, whether material or not, in respect of companies and investments or related investments, which may be mentioned in this report. Accordingly, information may be available to Phillip Securities Research, or persons associated with or connected to Phillip Securities Research, including but not limited to its officers, directors, employees or persons involved in the issuance of this report, which is not reflected in this report, and Phillip Securities Research, or persons associated with or connected to Phillip Securities Research, including but not limited to its officers, directors, employees or persons involved in the issuance of this report, may, to the extent permitted by law, have acted upon or used the information prior to or immediately following its publication. Phillip Securities Research, or persons associated with or connected to Phillip Securities Research, including but not limited its officers, directors, employees or persons involved in the issuance of this report, may have issued other material that is inconsistent with, or reach different conclusions from, the contents of this report.
The information, tools and material presented herein are not directed, intended for distribution to or use by, any person or entity in any jurisdiction or country where such distribution, publication, availability or use would be contrary to the applicable law or regulation or which would subject Phillip Securities Research to any registration or licensing or other requirement, or penalty for contravention of such requirements within such jurisdiction.
This report is intended for general circulation only and does not take into account the specific investment objectives, financial situation or particular needs of any particular person. The products mentioned in this report may not be suitable for all investors and a person receiving or reading this report should seek advice from a professional and financial adviser regarding the legal, business, financial, tax and other aspects including the suitability of such products, taking into account the specific investment objectives, financial situation or particular needs of that person, before making a commitment to invest in any of such products.
This report is not intended for distribution, publication to or use by any person in any jurisdiction outside of Singapore or any other jurisdiction as Phillip Securities Research may determine in its absolute discretion.
IMPORTANT DISCLOSURES FOR INCLUDED RESEARCH ANALYSES OR REPORTS OF FOREIGN RESEARCH HOUSE
Where the report contains research analyses or reports from a foreign research house, please note:

Jeremy specialises in Technical Analysis and has 10 years of experience in studying price action. His areas of expertise include intermarket analysis on the equities, currencies, commodities and bonds market.
He is also a regular columnist on The Business Times - every Monday ChartPoint column.
He graduated with a Bachelor of Science in Banking and Finance from University of London.
