
This article was published in Business Times’ column “Chart Point” on 19 March 2018.
German DAX Index Future Daily Chart
After the VIX index explosion incident in early February, the risk-off sentiment from the US spread to the rest of the world including the EU and Germany. The German DAX index fell as much as -13% from the 13,596 peak to the 11,725 trough for the past two months, mirroring the US counterpart where the S&P 500 index also fell as much as -12% intra month.
However, there is a stark difference showing up as the US equity indices such as S&P 500 index has regained more than half of the -12% selloff while the performance German DAX index remained underwhelming. The German DAX index has only recovered 5% off the 11,725 trough. To make matters worse, the Nasdaq 100 index has also confirmed the risk-on sentiment is back in full force. Despite falling -12% in early February, the Nasdaq 100 index staged a remarkable recovery of +15% off the 6,158 intra-month low since 9 February and had just broken a new record high. Hence, it is obvious that the German DAX index is lagging behind in terms of performance.
From the most recent ECB press release and conference, it is safe to say that the ECB is still on an accommodative stance where further liquidity will be provided if needed. As long as there is no sudden unexpected shift in the monetary policy to the tightening side, we believe the German DAX index will benefit from the ongoing easy monetary policy. Inflation data will be the most crucial factor to watch out for in anticipation of a more aggressive monetary policy.
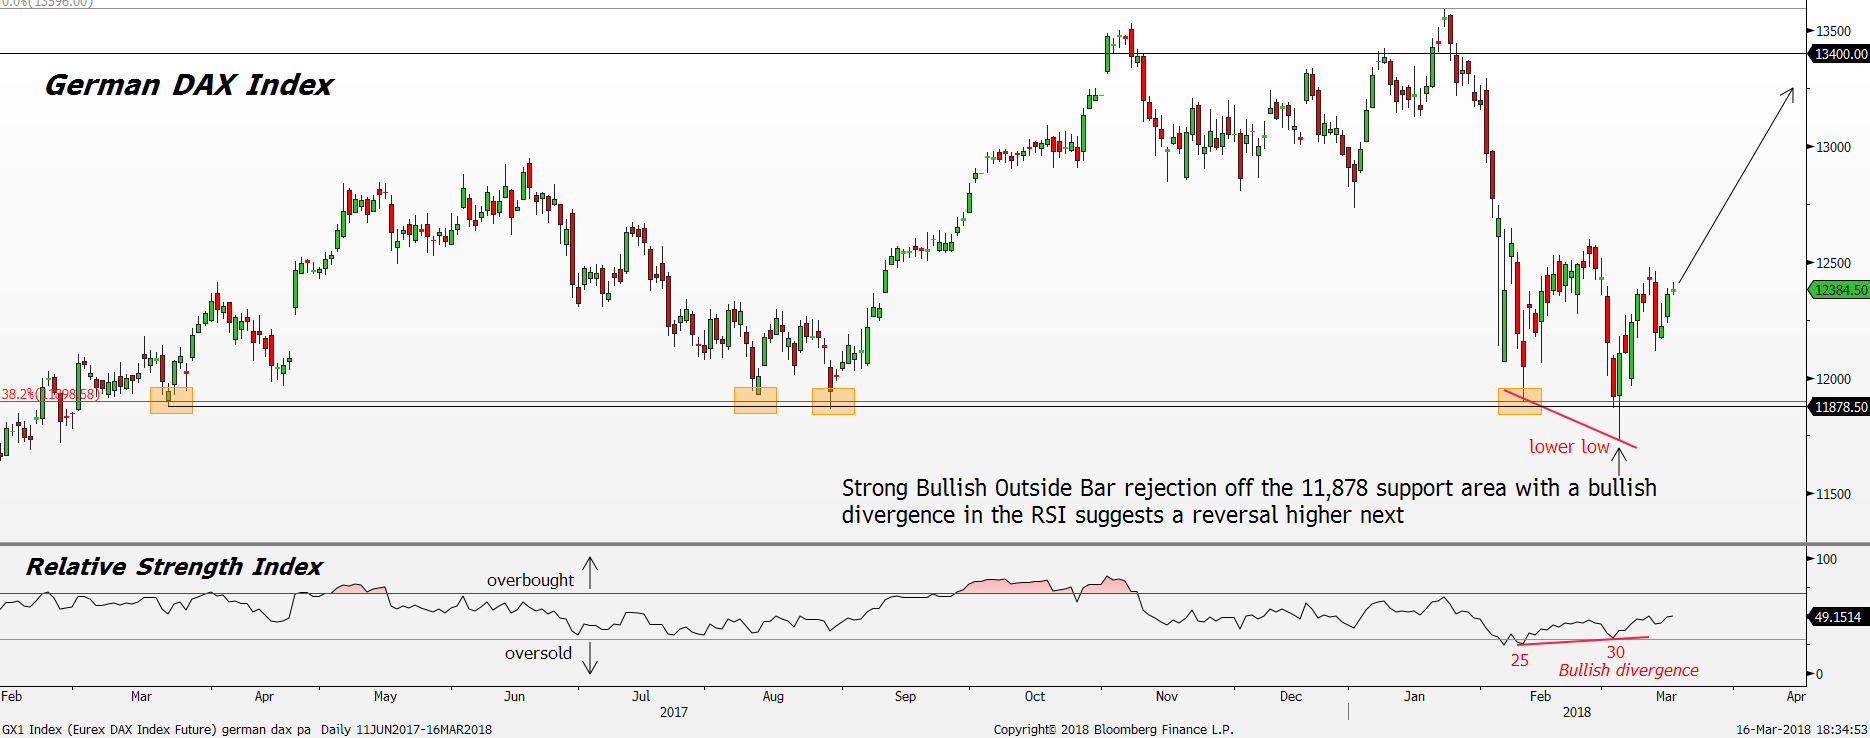
With the volatility storm behind us, the current price action outlook is also supportive of a rally moving forward. After falling sharply at the end of January, the DAX index found some strong confluence of support at the 38.2% Fibonacci retracement level and 11,878 support area. The 11,878 area is particularly important because it has been keeping the uptrend intact since March 2017. There were four occasions shown by the highlighted area in the chart where the buyers reappeared aggressively after the DAX index fell to the 11,878 area.
There was no exception for the most recent selloff as well. The DAX index briefly broke below the 11,878 support area on 5 March 2018 but was readily held up at the day’s close. As a result of the major rejection off the 11,878 support area, a bullish price action, Bullish Outside Bar was formed signalling a reversal back into the uptrend. Moreover, the recent selloff has also dragged the Relative Strength Index (RSI) into oversold territory since 6 February and more recently on 2 March. RSI measures the general strength of the momentum. A reading above 70 represents overbought condition while a reading below 30 represents oversold condition.
Our ten-year historical study on the RSI showed that when the RSI is in an oversold condition, below 30, a mean reversion tends to happen eventually where a reversal higher in the DAX index is expected. In total since 2008, there were 22 oversold signals generated by the RSI. Four signals failed to work while the rest of the 18 managed to forecast for a reversal higher. On average, the reversal that happened after the oversold RSI signal is triggered is around +10%.
In addition, the RSI and price action since February 2018 also exhibited another interesting pattern. A bullish divergence appeared as the DAX index formed a lower low (LL) on 2 March while the RSI formed a higher low (HL) instead shown by the diagonal line in the chart. This is a bullish reversal signal that usually confirms an improving momentum where a rebound higher is expected.
Therefore, with the current strong bullish rejection off the 11,878 support area with a Bullish Outside Bar on 5 March in conjunction with the RSI in the oversold condition suggests a high likelihood of seeing a strong reversal higher in the DAX index next. For this rebound, using the average 10% return from our RSI oversold condition study will give us a target price of 13,400 points which is also in line with the resistance area that was formed back in November 2017 and January 2018.

Jeremy specialises in Technical Analysis and has 10 years of experience in studying price action. His areas of expertise include intermarket analysis on the equities, currencies, commodities and bonds market.
He is also a regular columnist on The Business Times - every Monday ChartPoint column.
He graduated with a Bachelor of Science in Banking and Finance from University of London.
