
We initiate coverage on Geo Energy Resources Ltd (Geo) with a Buy rating and a target price of 45 SG cents based on 11.0x annualised 3Q16 P/E ratio and 3 US cents FY17e EPS, as well as 1.3x USD/SGD exchange rate (5 year average), which implies an upside of 66.7%.
Investment Thesis
1 ) Global energy consumption pattern remains similar over past three decades.
2) Global coal consumption has been trending up, peaking in 2013 but remains elevated.
3) China will remain the largest coal consumption country.
4) Indonesia coal market is on the run and expected to have strong growth
Investment Actions
We initiate coverage on Geo with a “Buy” rating and a target price of 45 SG cents based on 11.0x annualised 3Q16 P/E ratio and 3 US cents FY17e EPS, as well as 1.3x USD/SGD exchange rate (5 year average), which implies an upside of 66.7%.
Company Background
Investment Thesis
1) Global energy consumption pattern remains similar over past three decades
Over the past 2 decades, climate change and global warming have increasingly been major concerns amongst all major economies. From the enactment of Kyoto Protocol in 1997 to the recent Paris Agreement in 2016, more than 190 countries have arrived at the consensus to reduce greenhouse gases emissions collaboratively. Correspondingly, parties such as policy makers, green energy technology innovators, and environmental protection groups have been involved in subduing consumption of fossil fuels, mainly oil, coal, and natural gas, which is the major cause of greenhouse gases. However, up to this day we only see nuance in the evolvement of the structure of world energy consumption source amid the advocation of green energy for years. According to BP Statistical Review of World Energy 2016, as of 2015 fossil fuels took up 86% of total energy consumption, down only 3% from that in 1985, see Figure 1. Throughout this period (1985 to 2015), total consumption grew from 7,179mn tonnes oil equivalent (mtoe) to 13,147 mtoe with compounded annual growth rate (CAGR) of 2%, see Figure 2. Therefore, we can conclude that transformation of energy consumption patterns is a long process with slow progress. Even though renewable energy has shown high growth in recent years, it lags far behind the consumption of fossil fuels, which remain a widely used source of energy especially in developing economies.
Figure 1. Percentage of fossil fuel consumption
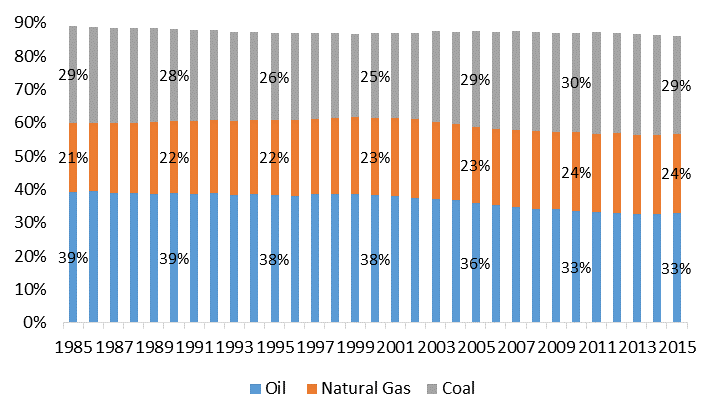
Source: BP Statistical Review of World Energy 2016, PSR
Figure 2. World energy demand breakdown
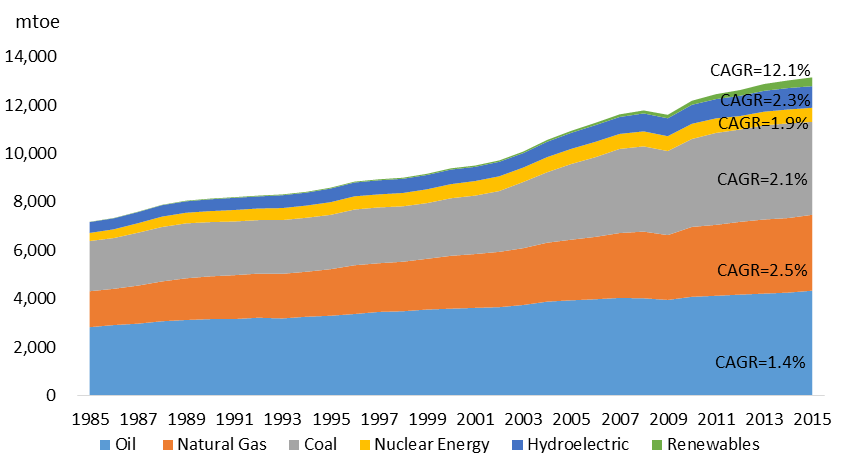
Source: BP Statistical Review of World Energy 2016, PSR
2) Worldwide coal supply and demand overview
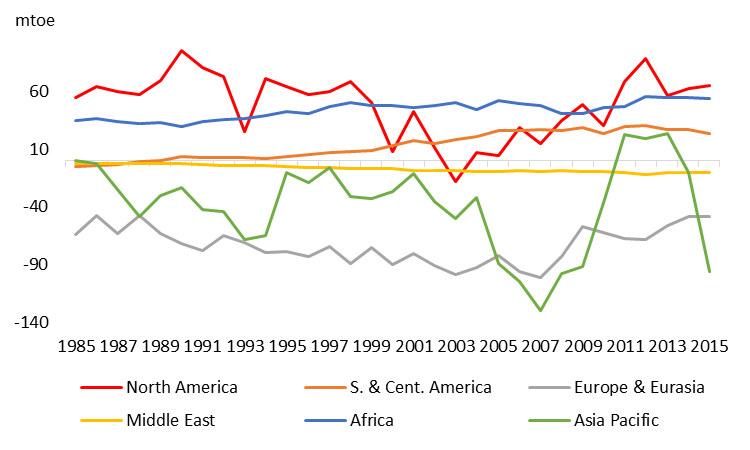
Coal, as mentioned above, which takes up 29% of total energy demand, has been primarily used for electricity and heat generation. Population growth, industrial prosperity, climate variability, as well as regulation, collectively impact coal supply and demand, which are the determinants of underlying price. As shown in Figure 3 below, global supply and demand of coal stagnated below 2,300 mtoe per annum before 2000. Entering into the 21st century, coal enjoyed a euphoric growth with a respective increment of 55.9% in production and 52.7% in consumption from 2000 to 2010. The phenomenal upspring was attributed to China, the largest coal consumer, which successfully joined World Trade Organisation (WTO) in 2001. Since then, the boom in China’s manufacturing industry had pulled up coal supply and demand. During this period, the gap between coal production and consumption was negative each year (demand over supply) except in 2001 and 2010 when the gap came in close to flat at zero. The bottom in 2007 followed by a V-shaped rebound, suggests that production was driven by consumption. From 2011 to 2014, the coal market experienced excessive supply due mainly to the ramping up of capacity in coal production in Asia Pacific amid sluggish growth of consumption worldwide, as we see the supply-demand gap in Asia Pacific turn positive, albeit briefly, for the first time in over 3 decades(Figure 4).
Figure 3. World total coal production and consumption
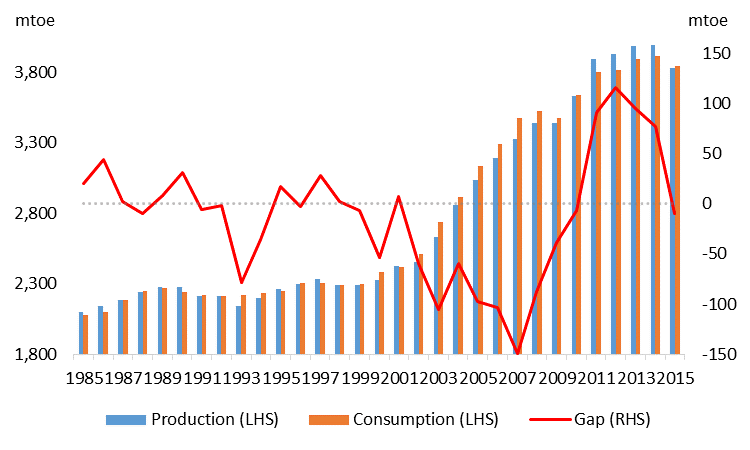
Source: BP Statistical Review of World Energy 2016, PSR
Figure 4. Breakdown of gap between production and consumption
Moving forward, International Energy Agency (IEA) forecasts the contribution from coal to total world energy consumption will be reduced from 30% in 2015 to 27% by 2021 in the “Coal Medium-term Market Report 2016”. Demand from Europe and North America continues to shrink, while Asia remains the major market for coal. Consumption in Japan and Korea is expected to retain solid growth, and that in other Southeast Asia emerging economies such as India, Vietnam, and Indonesia likewise displays a strong growth trend. Though China plans to curb coal demand going forward, its dominance in coal market still prevails in the foreseeable future. All in all, coal’s demand shift to the east, shown in Figure 5, will accelerate since it is the most affordable energy for developing countries in Asia.
Figure 5. Regional breakdown of coal consumption
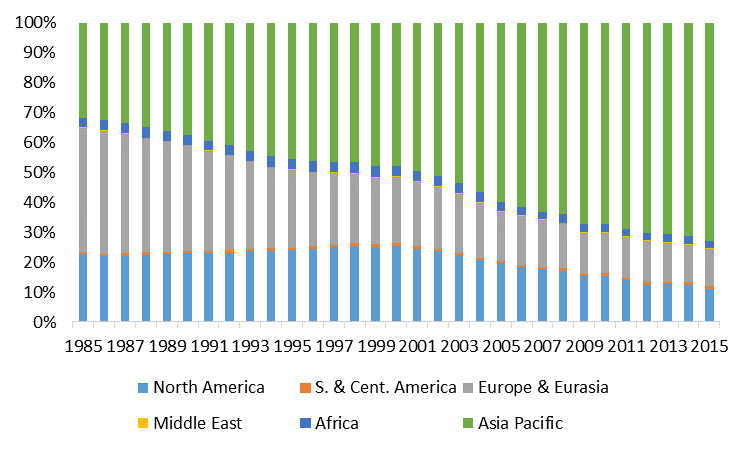
Source: BP Statistical Review of World Energy 2016, PSR
Important Information
This report is prepared and/or distributed by Phillip Securities Research Pte Ltd ("Phillip Securities Research"), which is a holder of a financial adviser’s licence under the Financial Advisers Act, Chapter 110 in Singapore.
By receiving or reading this report, you agree to be bound by the terms and limitations set out below. Any failure to comply with these terms and limitations may constitute a violation of law. This report has been provided to you for personal use only and shall not be reproduced, distributed or published by you in whole or in part, for any purpose. If you have received this report by mistake, please delete or destroy it, and notify the sender immediately.
The information and any analysis, forecasts, projections, expectations and opinions (collectively, the “Research”) contained in this report has been obtained from public sources which Phillip Securities Research believes to be reliable. However, Phillip Securities Research does not make any representation or warranty, express or implied that such information or Research is accurate, complete or appropriate or should be relied upon as such. Any such information or Research contained in this report is subject to change, and Phillip Securities Research shall not have any responsibility to maintain or update the information or Research made available or to supply any corrections, updates or releases in connection therewith.
Any opinions, forecasts, assumptions, estimates, valuations and prices contained in this report are as of the date indicated and are subject to change at any time without prior notice. Past performance of any product referred to in this report is not indicative of future results.
This report does not constitute, and should not be used as a substitute for, tax, legal or investment advice. This report should not be relied upon exclusively or as authoritative, without further being subject to the recipient’s own independent verification and exercise of judgment. The fact that this report has been made available constitutes neither a recommendation to enter into a particular transaction, nor a representation that any product described in this report is suitable or appropriate for the recipient. Recipients should be aware that many of the products, which may be described in this report involve significant risks and may not be suitable for all investors, and that any decision to enter into transactions involving such products should not be made, unless all such risks are understood and an independent determination has been made that such transactions would be appropriate. Any discussion of the risks contained herein with respect to any product should not be considered to be a disclosure of all risks or a complete discussion of such risks.
Nothing in this report shall be construed to be an offer or solicitation for the purchase or sale of any product. Any decision to purchase any product mentioned in this report should take into account existing public information, including any registered prospectus in respect of such product.
Phillip Securities Research, or persons associated with or connected to Phillip Securities Research, including but not limited to its officers, directors, employees or persons involved in the issuance of this report, may provide an array of financial services to a large number of corporations in Singapore and worldwide, including but not limited to commercial / investment banking activities (including sponsorship, financial advisory or underwriting activities), brokerage or securities trading activities. Phillip Securities Research, or persons associated with or connected to Phillip Securities Research, including but not limited to its officers, directors, employees or persons involved in the issuance of this report, may have participated in or invested in transactions with the issuer(s) of the securities mentioned in this report, and may have performed services for or solicited business from such issuers. Additionally, Phillip Securities Research, or persons associated with or connected to Phillip Securities Research, including but not limited to its officers, directors, employees or persons involved in the issuance of this report, may have provided advice or investment services to such companies and investments or related investments, as may be mentioned in this report.
Phillip Securities Research or persons associated with or connected to Phillip Securities Research, including but not limited to its officers, directors, employees or persons involved in the issuance of this report may, from time to time maintain a long or short position in securities referred to herein, or in related futures or options, purchase or sell, make a market in, or engage in any other transaction involving such securities, and earn brokerage or other compensation in respect of the foregoing. Investments will be denominated in various currencies including US dollars and Euro and thus will be subject to any fluctuation in exchange rates between US dollars and Euro or foreign currencies and the currency of your own jurisdiction. Such fluctuations may have an adverse effect on the value, price or income return of the investment.
To the extent permitted by law, Phillip Securities Research, or persons associated with or connected to Phillip Securities Research, including but not limited to its officers, directors, employees or persons involved in the issuance of this report, may at any time engage in any of the above activities as set out above or otherwise hold an interest, whether material or not, in respect of companies and investments or related investments, which may be mentioned in this report. Accordingly, information may be available to Phillip Securities Research, or persons associated with or connected to Phillip Securities Research, including but not limited to its officers, directors, employees or persons involved in the issuance of this report, which is not reflected in this report, and Phillip Securities Research, or persons associated with or connected to Phillip Securities Research, including but not limited to its officers, directors, employees or persons involved in the issuance of this report, may, to the extent permitted by law, have acted upon or used the information prior to or immediately following its publication. Phillip Securities Research, or persons associated with or connected to Phillip Securities Research, including but not limited its officers, directors, employees or persons involved in the issuance of this report, may have issued other material that is inconsistent with, or reach different conclusions from, the contents of this report.
The information, tools and material presented herein are not directed, intended for distribution to or use by, any person or entity in any jurisdiction or country where such distribution, publication, availability or use would be contrary to the applicable law or regulation or which would subject Phillip Securities Research to any registration or licensing or other requirement, or penalty for contravention of such requirements within such jurisdiction.
This report is intended for general circulation only and does not take into account the specific investment objectives, financial situation or particular needs of any particular person. The products mentioned in this report may not be suitable for all investors and a person receiving or reading this report should seek advice from a professional and financial adviser regarding the legal, business, financial, tax and other aspects including the suitability of such products, taking into account the specific investment objectives, financial situation or particular needs of that person, before making a commitment to invest in any of such products.
This report is not intended for distribution, publication to or use by any person in any jurisdiction outside of Singapore or any other jurisdiction as Phillip Securities Research may determine in its absolute discretion.
IMPORTANT DISCLOSURES FOR INCLUDED RESEARCH ANALYSES OR REPORTS OF FOREIGN RESEARCH HOUSE
Where the report contains research analyses or reports from a foreign research house, please note:

Guangzhi graduated from Singapore Management University with a Master degree in Applied Finance and from South China University of Technology with a Bachelor degree in Electronic Commerce.
The current sector coverages include Energy, Utilities, and Mining sectors. He has 3 years experience in equity research in both Hong Kong and Singapore market. He is the mandarin spokesperson for Phillip Securities Research in relation to China-related projects and all mandarin seminars and client events.
