
Investment Action
We are bullish on FB on the growth of its user base (up 16% yoy to 1.79 bn active monthly users), as well as the promising results of its other avenues, such as Instagram Stories (up 50% to 600mn active monthly users) and Facebook Live (400% growth in usage since May 2016). We believe that the sell off from its high in October 2016 has caused the stock to be discounted relative to its growth rate. Add in FB’s very strong balance sheet, and the stock seems to be a convincing investment.
After reaching an all-time high of USD133.50 in October 2016, Facebook shares tumbled by almost 14%. There are a number of factors for the hit the share price took, namely, weaker guidance for 2017 and a Donald Trump victory at the presidential election. Technology stocks in general did not participate much in the stock market rally following the Trump victory, as they were not seen as the sector that would benefit much from Trump’s infrastructure spending. FB and other social media were also criticized heavily during the election period over “fake news”. For the 4th quarter of 2016, the Dow Jones grew about 9%, Nasdaq grew 3% and FB fell 9%.
While the Trump factor is likely to have contributed, the weaker guidance from FB itself is likely to be the main contributor to the fall in share price. FB’s revenue for full FY16 will be released in February 2017 but estimated revenue is expected to grow by about 50% yoy. In comparison, FY17 revenue is expected to grow by about 30% yoy. Besides facing a tough yoy comparison in FY17, FB warned that it is nearing maximum ad load on its platform. With growth potentially slowing down and its main revenue generating segment reaching capacity, it is no wonder FB faced a selloff.
However, we believe that the selloff was overdone. FB has been investing and expanding its other revenue segments and have been reaping promising results. In particular, FB’s Instagram Stories have been hugely successful and Instagram reported that its user base has grown to more than 600 mn monthly active users, up from 400 mn that it reported in 2015. Instagram is expected to generate USD 1.5bn in FY16 and is expected to reach USD 5bn by 2018. Facebook Live is FB’s attempt to increase engagement by allowing users to live stream, and since its release in May, it has seen almost 400% growth in usage. FB Messenger also reached the 1bn user mark in 2016, and if its “bots” program takes off, Messenger could potentially replace many individual business apps and generate billions in estimated revenue.
Key Points:
Technical
FB weekly chart
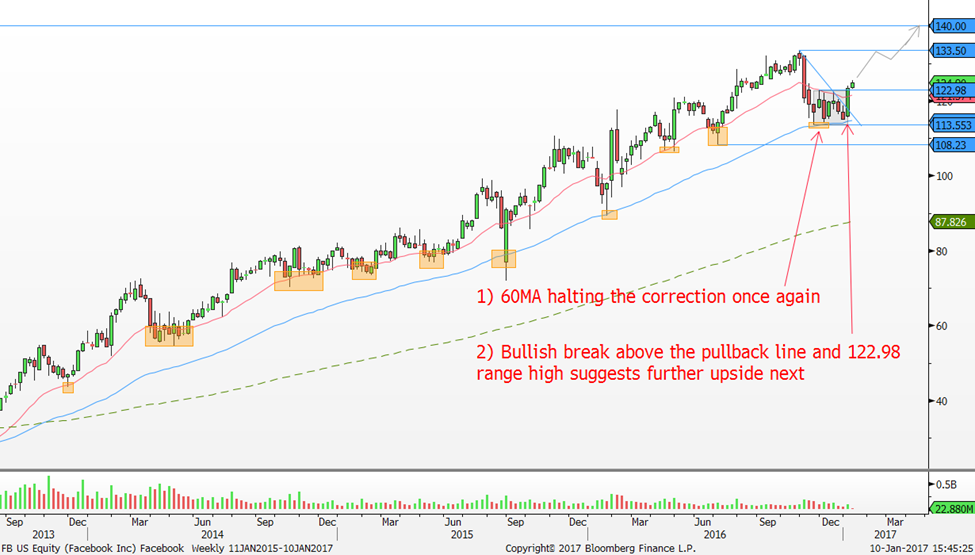
Resistance 1: 133.50 , Resistance 2: 140.00 / / Support 1: 113.55 , Support 2: 108.23
Red line = 20 period moving average, blue line = 60 period moving average, Green line = 200 period moving average
Source: Bloomberg, PSR
Valuations
Risk
![]()
Important Information
This report is prepared and/or distributed by Phillip Securities Research Pte Ltd ("Phillip Securities Research"), which is a holder of a financial adviser’s licence under the Financial Advisers Act, Chapter 110 in Singapore.
By receiving or reading this report, you agree to be bound by the terms and limitations set out below. Any failure to comply with these terms and limitations may constitute a violation of law. This report has been provided to you for personal use only and shall not be reproduced, distributed or published by you in whole or in part, for any purpose. If you have received this report by mistake, please delete or destroy it, and notify the sender immediately.
The information and any analysis, forecasts, projections, expectations and opinions (collectively, the “Research”) contained in this report has been obtained from public sources which Phillip Securities Research believes to be reliable. However, Phillip Securities Research does not make any representation or warranty, express or implied that such information or Research is accurate, complete or appropriate or should be relied upon as such. Any such information or Research contained in this report is subject to change, and Phillip Securities Research shall not have any responsibility to maintain or update the information or Research made available or to supply any corrections, updates or releases in connection therewith.
Any opinions, forecasts, assumptions, estimates, valuations and prices contained in this report are as of the date indicated and are subject to change at any time without prior notice. Past performance of any product referred to in this report is not indicative of future results.
This report does not constitute, and should not be used as a substitute for, tax, legal or investment advice. This report should not be relied upon exclusively or as authoritative, without further being subject to the recipient’s own independent verification and exercise of judgment. The fact that this report has been made available constitutes neither a recommendation to enter into a particular transaction, nor a representation that any product described in this report is suitable or appropriate for the recipient. Recipients should be aware that many of the products, which may be described in this report involve significant risks and may not be suitable for all investors, and that any decision to enter into transactions involving such products should not be made, unless all such risks are understood and an independent determination has been made that such transactions would be appropriate. Any discussion of the risks contained herein with respect to any product should not be considered to be a disclosure of all risks or a complete discussion of such risks.
Nothing in this report shall be construed to be an offer or solicitation for the purchase or sale of any product. Any decision to purchase any product mentioned in this report should take into account existing public information, including any registered prospectus in respect of such product.
Phillip Securities Research, or persons associated with or connected to Phillip Securities Research, including but not limited to its officers, directors, employees or persons involved in the issuance of this report, may provide an array of financial services to a large number of corporations in Singapore and worldwide, including but not limited to commercial / investment banking activities (including sponsorship, financial advisory or underwriting activities), brokerage or securities trading activities. Phillip Securities Research, or persons associated with or connected to Phillip Securities Research, including but not limited to its officers, directors, employees or persons involved in the issuance of this report, may have participated in or invested in transactions with the issuer(s) of the securities mentioned in this report, and may have performed services for or solicited business from such issuers. Additionally, Phillip Securities Research, or persons associated with or connected to Phillip Securities Research, including but not limited to its officers, directors, employees or persons involved in the issuance of this report, may have provided advice or investment services to such companies and investments or related investments, as may be mentioned in this report.
Phillip Securities Research or persons associated with or connected to Phillip Securities Research, including but not limited to its officers, directors, employees or persons involved in the issuance of this report may, from time to time maintain a long or short position in securities referred to herein, or in related futures or options, purchase or sell, make a market in, or engage in any other transaction involving such securities, and earn brokerage or other compensation in respect of the foregoing. Investments will be denominated in various currencies including US dollars and Euro and thus will be subject to any fluctuation in exchange rates between US dollars and Euro or foreign currencies and the currency of your own jurisdiction. Such fluctuations may have an adverse effect on the value, price or income return of the investment.
To the extent permitted by law, Phillip Securities Research, or persons associated with or connected to Phillip Securities Research, including but not limited to its officers, directors, employees or persons involved in the issuance of this report, may at any time engage in any of the above activities as set out above or otherwise hold an interest, whether material or not, in respect of companies and investments or related investments, which may be mentioned in this report. Accordingly, information may be available to Phillip Securities Research, or persons associated with or connected to Phillip Securities Research, including but not limited to its officers, directors, employees or persons involved in the issuance of this report, which is not reflected in this report, and Phillip Securities Research, or persons associated with or connected to Phillip Securities Research, including but not limited to its officers, directors, employees or persons involved in the issuance of this report, may, to the extent permitted by law, have acted upon or used the information prior to or immediately following its publication. Phillip Securities Research, or persons associated with or connected to Phillip Securities Research, including but not limited its officers, directors, employees or persons involved in the issuance of this report, may have issued other material that is inconsistent with, or reach different conclusions from, the contents of this report.
The information, tools and material presented herein are not directed, intended for distribution to or use by, any person or entity in any jurisdiction or country where such distribution, publication, availability or use would be contrary to the applicable law or regulation or which would subject Phillip Securities Research to any registration or licensing or other requirement, or penalty for contravention of such requirements within such jurisdiction.
This report is intended for general circulation only and does not take into account the specific investment objectives, financial situation or particular needs of any particular person. The products mentioned in this report may not be suitable for all investors and a person receiving or reading this report should seek advice from a professional and financial adviser regarding the legal, business, financial, tax and other aspects including the suitability of such products, taking into account the specific investment objectives, financial situation or particular needs of that person, before making a commitment to invest in any of such products.
This report is not intended for distribution, publication to or use by any person in any jurisdiction outside of Singapore or any other jurisdiction as Phillip Securities Research may determine in its absolute discretion.
IMPORTANT DISCLOSURES FOR INCLUDED RESEARCH ANALYSES OR REPORTS OF FOREIGN RESEARCH HOUSE
Where the report contains research analyses or reports from a foreign research house, please note: