
Description
Facebook Inc. (NASDAQ:FB) is focused on building products that enable people to connect and share through mobile devices, personal computers and other surfaces. The Company’s products include Facebook, Instagram, Messenger, WhatsApp and Oculus. The Company also engages in selling advertising placements to marketers. Its advertisements let marketers reach people based on a range of factors, including age, gender, location, interests and behaviors. Marketers purchase advertisements that can appear in multiple places, including on Facebook, Instagram, and third-party applications and Websites.
Source: Thomson Reuters
Company Highlights
Investment Rationale
FB’s share price fell drastically after the Cambridge Analytica scandal, when it was revealed that the political analytics company was able to access more than 50mn Facebook profiles without their users’ permissions. Since the news broke, FB has lost close to 20% of its price from peak. We believe that while the news seems bad, the potential fallout and damage to FB’s intrinsic value has been blown out of proportion and that the current situation represents a buying opportunity for the social media giant.
Our Reasons for Buying FB
1. Recent Price Action: FB share price peaked at around USD193 after its latest earnings release. While the company posted better than expected results, it also released figures that showed a drop in user time spent on the platform. While the company was recovering from that event, the Cambridge Analytica scandal broke, which sent the price tumbling to a low of USD151 before the recent recovery to USD159.79.
2. Massive User Base: FB reported in its latest earnings release that its Daily Active Users totaled about 1.40bn users in the latest quarter and 2.13bn Monthly Active Users. More importantly than just a large user base, FB has shown it is very capable of monetizing its user base. FB was able to generate about USD39.94bn in revenue from advertising off that user base.
Based on the figures from FB, it has 184mn users from USA and Canada, 277mn from Europe, 499mn from Asia Pacific and 441mn from the rest of the world. In terms of revenue, the Average revenue per User from USA was USD26.26, while the Average revenue per user for Europe, Asia Pacific and Others were USD8.71, USD2.52 and USD1.85 respectively.
As the rest of the emerging markets become more affluent and companies start spending more to advertise to them, we believe that FB has great potential to further monetize its users from the rest of the world.
3. Digital Advertising Growth: In 2017 digital advertising finally surpassed traditional TV ad spending, reaching USD209bn worldwide (41% of all media ad spending) vs TV’s USD178bn (35% of all media ad spending). FB has been able to grow its market share consistently over the past few years, up from 17% in 2015 and 20% in 2016 to 25.70% in 2017. Digital ad spending is expected to continue to grow at substantial levels, and is estimated to reach about USD375.8bn by 2021. Assuming FB is able to maintain its 25.7% market share, this would amount to a revenue of USD96.58bn by 2021, which represents a 4 year CAGR of about 24%. While this is lower than FB’s past 5 years CAGR of 52%, it is still very high and it is difficult to sustain such a high CAGR for extended periods of time as the revenue base grows larger.
4. Valuations: FB closed at USD159.79 and trades at a forward PER of 18.95. FB’s 4 year average PER is 53.64. FB’s total revenue for 2017 was USD40.65bn and over the past 5 years, it has been able to grow that revenue by about 50.75% p.a. FB has been able to generate a free cash flow of USD17.483bn for FY17 and has been able to consistently grow free cash flows, up from USD11.62bn in FY16 and USD7.80bn in FY15. FB has been able to keep its expenses low, resulting in a very impressive 58% gross margin in FY17, up from 86.29% in FY16 and 84.01% in FY15. Its net margin is also a very impressive 39.20% in FY17, up from 36.97% in FY16 and 20.57% in FY15. Given FB’s growth prospects and very impressive financials, we believe that FB is undervalued at current prices.
5. Cambridge Analytica: We believe that the Cambridge Analytica investigation has been blown out of proportion and that the potential fallout from the scandal is likely to be limited. Historically, companies who have had significant data breaches did not suffer permanent damage. In 2017, Equifax had the data of 145mn people stolen and its share price collapsed from about USD142 to a low of about USD92. Since then, the price recovered to about USD117.81.
We believe that it is unlikely for the Government to pass legislation that will permanently damage FB’s ability to conduct business, as any such legislation would not only impact FB but likely all data based companies as well. On a reputational basis, FB may have suffered some damage with the recent boycott Facebook movement. However, we do not believe that FB has suffered much permanent damage in this regard either, as users will be hard press to find an alternative for Facebook as a social media platform in terms of scale and features.
Technicals: Since hitting a record high of USD195.00 psychological round number in the last week of January 2018, price went into a severe correction. From the peak to the trough, FB has fallen as much as 23%.
FB Weekly chart – Hammer rejection off the 150 psychological round number
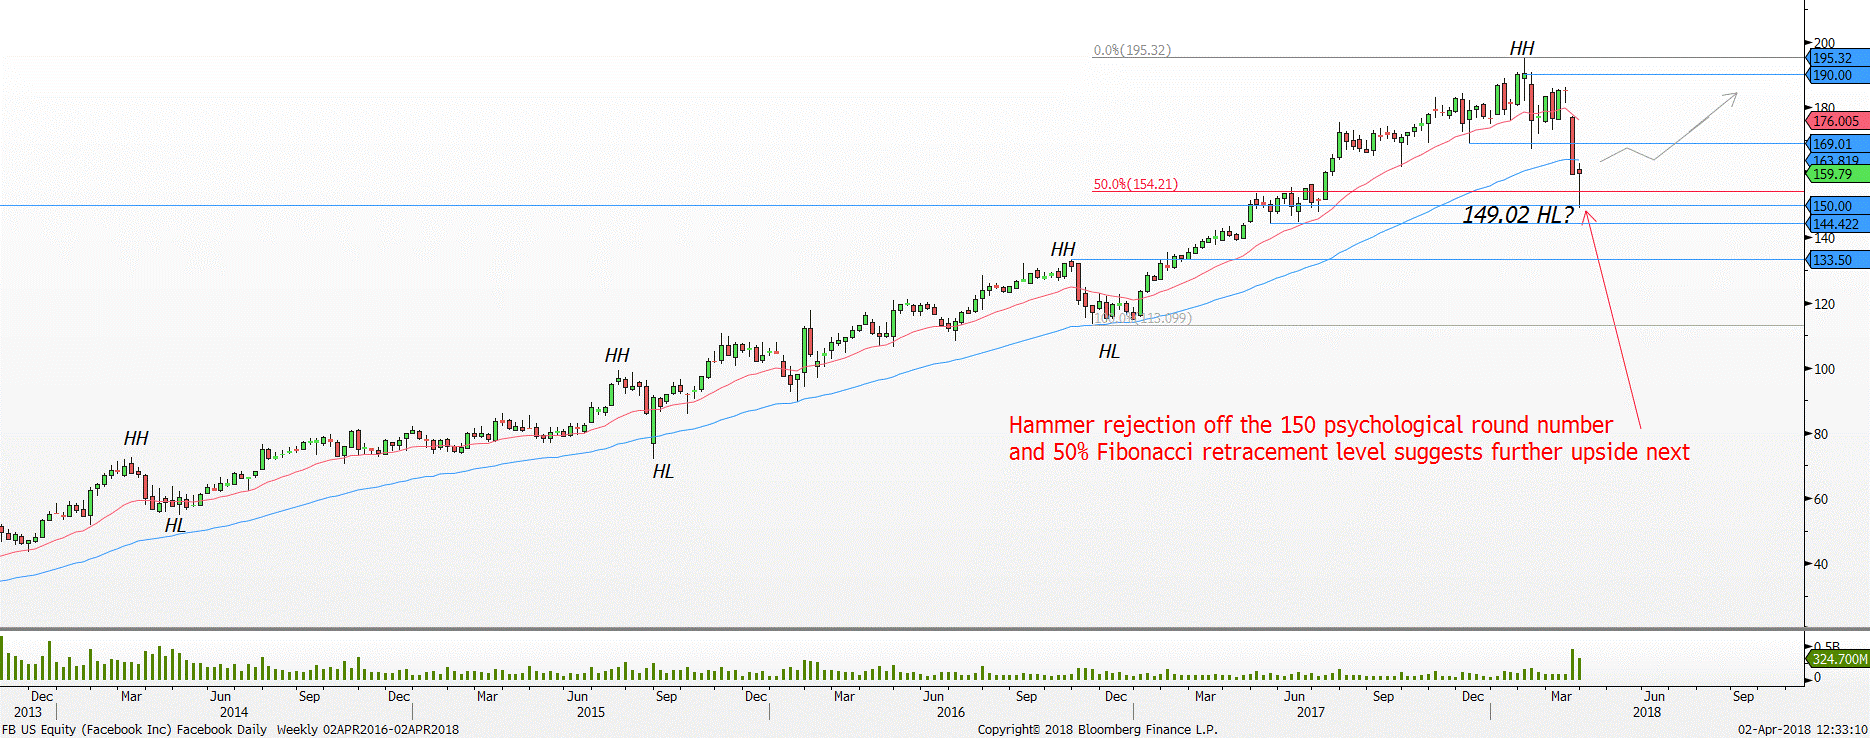
Source: Bloomberg, PSR
Support 1: 150.00 Resistance 1: 169.00
Support 2: 144.42 Resistance 2: 190.00
Red line = 20-period moving average, blue line = 60-period moving average, Green line = 200-period moving average
Nonetheless, from the most recent price action, we might be seeing some near-term rebound soon after eight weeks of being in a correction. After breaking below the USD150.00 psychological round number briefly in the last week of March, buyers readily defended the round number as there was no daily close below the USD150.00 psychological round number.
As a result, a bullish reversal candlestick pattern, hammer was formed on the week ended 30 March 2018 suggesting for a reversal higher. Moreover, the USD150.00 psychological round number also coincided with the 50% Fibonacci retracement level making the support area a more credible one.
Expect the hammer’s low of USD149.02 to be the next Higher Low (HL) point for this uptrend where buyers retarget the USD169.00 resistance area followed by USD190.00.
Conclusion: We believe that the current Cambridge Analytica scandal has provided investors with an opportunity to pick up FB at a discount. We believe that the potential fallout from the scandal will be limited and unlikely to permanently damage FB’s business model. We are bullish on FB due to 1) Massive User Base, 2) Digital Advertising Growth and 3) Valuations given FB’s growth prospects. As such, we believe that stock is undervalued and the current scandal represents a buying opportunity.
![]()
Important Information
This report is prepared and/or distributed by Phillip Securities Research Pte Ltd ("Phillip Securities Research"), which is a holder of a financial adviser’s licence under the Financial Advisers Act, Chapter 110 in Singapore.
By receiving or reading this report, you agree to be bound by the terms and limitations set out below. Any failure to comply with these terms and limitations may constitute a violation of law. This report has been provided to you for personal use only and shall not be reproduced, distributed or published by you in whole or in part, for any purpose. If you have received this report by mistake, please delete or destroy it, and notify the sender immediately.
The information and any analysis, forecasts, projections, expectations and opinions (collectively, the “Research”) contained in this report has been obtained from public sources which Phillip Securities Research believes to be reliable. However, Phillip Securities Research does not make any representation or warranty, express or implied that such information or Research is accurate, complete or appropriate or should be relied upon as such. Any such information or Research contained in this report is subject to change, and Phillip Securities Research shall not have any responsibility to maintain or update the information or Research made available or to supply any corrections, updates or releases in connection therewith.
Any opinions, forecasts, assumptions, estimates, valuations and prices contained in this report are as of the date indicated and are subject to change at any time without prior notice. Past performance of any product referred to in this report is not indicative of future results.
This report does not constitute, and should not be used as a substitute for, tax, legal or investment advice. This report should not be relied upon exclusively or as authoritative, without further being subject to the recipient’s own independent verification and exercise of judgment. The fact that this report has been made available constitutes neither a recommendation to enter into a particular transaction, nor a representation that any product described in this report is suitable or appropriate for the recipient. Recipients should be aware that many of the products, which may be described in this report involve significant risks and may not be suitable for all investors, and that any decision to enter into transactions involving such products should not be made, unless all such risks are understood and an independent determination has been made that such transactions would be appropriate. Any discussion of the risks contained herein with respect to any product should not be considered to be a disclosure of all risks or a complete discussion of such risks.
Nothing in this report shall be construed to be an offer or solicitation for the purchase or sale of any product. Any decision to purchase any product mentioned in this report should take into account existing public information, including any registered prospectus in respect of such product.
Phillip Securities Research, or persons associated with or connected to Phillip Securities Research, including but not limited to its officers, directors, employees or persons involved in the issuance of this report, may provide an array of financial services to a large number of corporations in Singapore and worldwide, including but not limited to commercial / investment banking activities (including sponsorship, financial advisory or underwriting activities), brokerage or securities trading activities. Phillip Securities Research, or persons associated with or connected to Phillip Securities Research, including but not limited to its officers, directors, employees or persons involved in the issuance of this report, may have participated in or invested in transactions with the issuer(s) of the securities mentioned in this report, and may have performed services for or solicited business from such issuers. Additionally, Phillip Securities Research, or persons associated with or connected to Phillip Securities Research, including but not limited to its officers, directors, employees or persons involved in the issuance of this report, may have provided advice or investment services to such companies and investments or related investments, as may be mentioned in this report.
Phillip Securities Research or persons associated with or connected to Phillip Securities Research, including but not limited to its officers, directors, employees or persons involved in the issuance of this report may, from time to time maintain a long or short position in securities referred to herein, or in related futures or options, purchase or sell, make a market in, or engage in any other transaction involving such securities, and earn brokerage or other compensation in respect of the foregoing. Investments will be denominated in various currencies including US dollars and Euro and thus will be subject to any fluctuation in exchange rates between US dollars and Euro or foreign currencies and the currency of your own jurisdiction. Such fluctuations may have an adverse effect on the value, price or income return of the investment.
To the extent permitted by law, Phillip Securities Research, or persons associated with or connected to Phillip Securities Research, including but not limited to its officers, directors, employees or persons involved in the issuance of this report, may at any time engage in any of the above activities as set out above or otherwise hold an interest, whether material or not, in respect of companies and investments or related investments, which may be mentioned in this report. Accordingly, information may be available to Phillip Securities Research, or persons associated with or connected to Phillip Securities Research, including but not limited to its officers, directors, employees or persons involved in the issuance of this report, which is not reflected in this report, and Phillip Securities Research, or persons associated with or connected to Phillip Securities Research, including but not limited to its officers, directors, employees or persons involved in the issuance of this report, may, to the extent permitted by law, have acted upon or used the information prior to or immediately following its publication. Phillip Securities Research, or persons associated with or connected to Phillip Securities Research, including but not limited its officers, directors, employees or persons involved in the issuance of this report, may have issued other material that is inconsistent with, or reach different conclusions from, the contents of this report.
The information, tools and material presented herein are not directed, intended for distribution to or use by, any person or entity in any jurisdiction or country where such distribution, publication, availability or use would be contrary to the applicable law or regulation or which would subject Phillip Securities Research to any registration or licensing or other requirement, or penalty for contravention of such requirements within such jurisdiction.
This report is intended for general circulation only and does not take into account the specific investment objectives, financial situation or particular needs of any particular person. The products mentioned in this report may not be suitable for all investors and a person receiving or reading this report should seek advice from a professional and financial adviser regarding the legal, business, financial, tax and other aspects including the suitability of such products, taking into account the specific investment objectives, financial situation or particular needs of that person, before making a commitment to invest in any of such products.
This report is not intended for distribution, publication to or use by any person in any jurisdiction outside of Singapore or any other jurisdiction as Phillip Securities Research may determine in its absolute discretion.
IMPORTANT DISCLOSURES FOR INCLUDED RESEARCH ANALYSES OR REPORTS OF FOREIGN RESEARCH HOUSE
Where the report contains research analyses or reports from a foreign research house, please note: