
This article was published on Business Times’ column “Chart Point” on 2 October 2017.
Despite not raising the Federal Funds Rate (FFR) as widely expected in the 20 September’s Federal Open Market Committee (FOMC) meeting, the FED continued to spin out a hawkish tone as they announced the commencement of the $4.5 trillion balance sheet reduction. It will start tapering $10 billion per month from October and raising the amount gradually in the months to come if the economy grows in line with expectations. A long-term study of the rate hike cycle since the 1970s shows a telling picture of its impact on the equity market. The Fed, with the smartest and brightest people on board, has the best knowledge about the health of the economy. Any actions on the monetary policy by the FED had been indicative. The moment they shift toward a dovish defensive stance after a period of tightening is the time to be wary. We observed that a prolonged rate hike cycle tends to end with crisis and equity market downturn and a change in monetary policy to the easing side usually signals it.
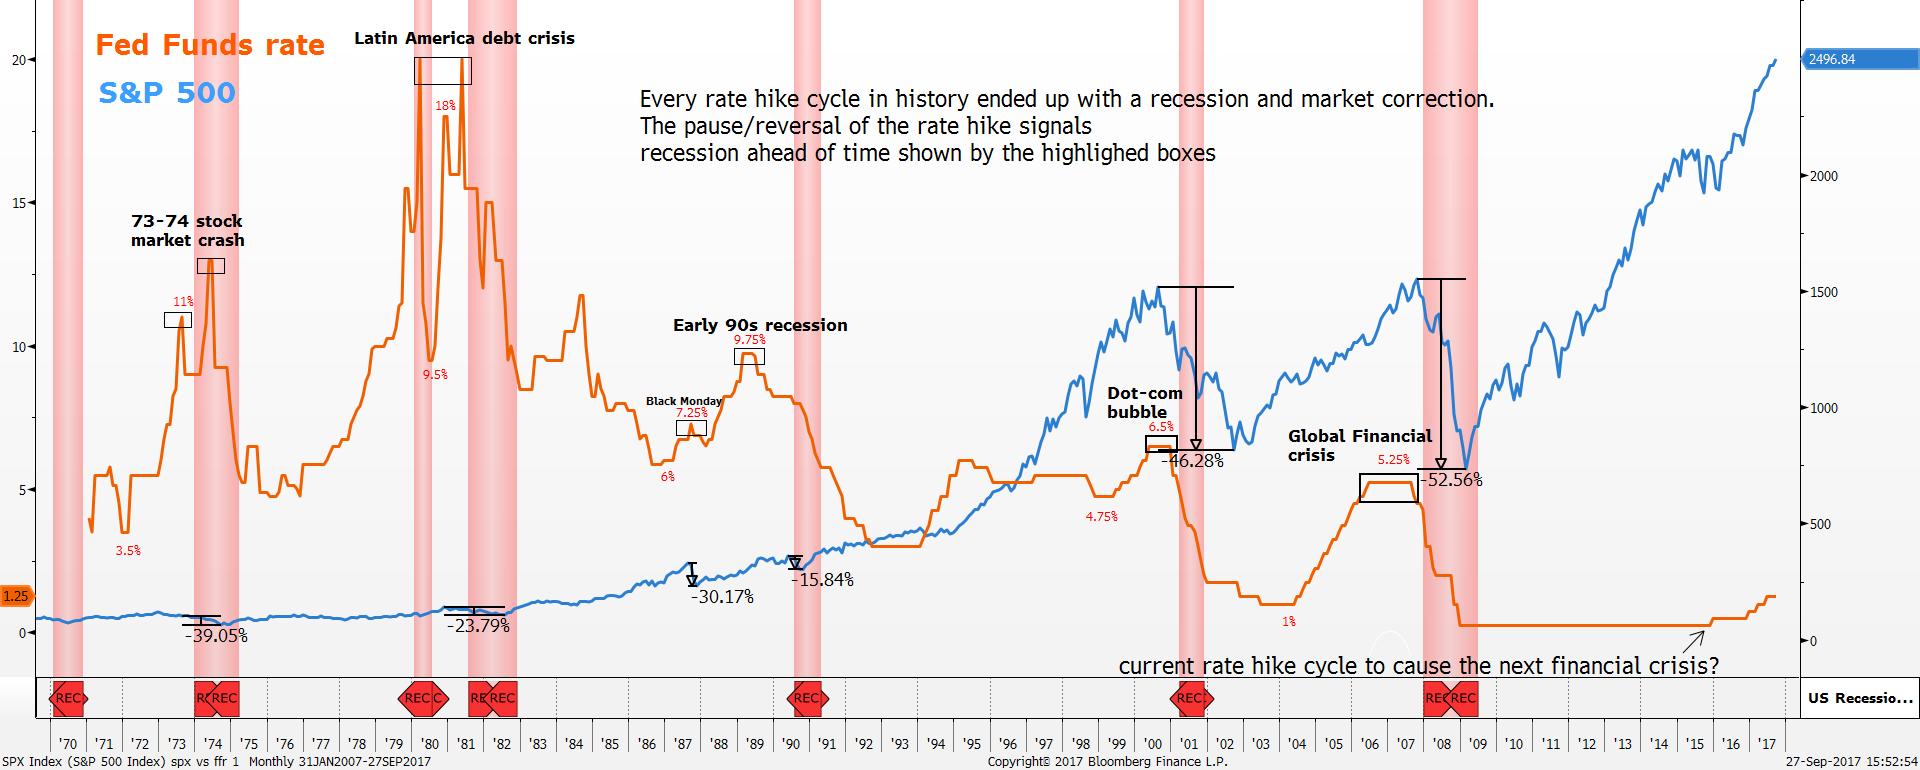
FFR vs S&P 500 monthly chart Source: Bloomberg, PSR
*Red vertical highlighted area shows the recessionary period
*Highlighted box shows the moment when the rate hike cycle was halted or reversed
For example, the rate hike cycle that popped the Dot-Com bubble began in June 1999 after the FFR was raised from 4.75% to 5%. The aggressive tightening continued for one year before the FED dialled back. Since June 2000, the FED halted the rate hike cycle and kept the FFR flat at a high of 6.5%. The FFR was left unchanged for the following six months, reflecting a sudden shift in sentiment from the FED, and ultimately leading to the bursting of the Dot-Com bubble. The peak in the S&P 500 was formed when the FFR was left unchanged at 6.5%. To be exact, the S&P 500 topped out in August 2000, two months after the FFR was left unchanged. All hell broke loose after the FED reduced the FFR sharply from 6.5% to 5.5% in January 2001 as it exacerbated the equity market selloff, ultimately dragging the S&P 500 down by 46%.
A similar warning pattern happened during the housing boom period of the 2000s. The FED embarked on a brand new rate hike cycle in June 2004, taking the FFR up from 1% to 1.25%. This time around, the rate hike cycle lasted longer as the FED raised rates for 25 months before going into defensive mode and keeping rates unchanged at a high of 5.25% for the following 14 months. The market only got the clue that something was amiss after the FED reduced the FFR for two consecutive months in October 2007 from 5.25% to 4.50% which ultimately led to the formation of the GFC top in S&P 500. The subsequent FFR reduction kick-started the Global Financial Crisis and aggravated the selloff resulting in a 52% wipeout in the S&P 500.
Fast forward to current time, this decade’s rate hike cycle began in December 2015 with the FED raising the FFR from 0.25% to 0.5%. In fact, the tightening cycle happened two years earlier in May 2013 after the FED announced plans to taper back its $85 billion per month Quantitative Easing program. The current rate hike cycle might be more complicated than the previous rate hike cycles due to the adoption of numerous unconventional monetary policy programs such as QE and record low levels of interest rate for an extended period since 2009.
Four rate hikes have been achieved since December 2015 bringing the FFR to 1.25%, and according to the most recent FED’s dot plot projection, 11 out of 16 members see one more rate hike in December. The Fed funds futures is also signalling a high possibility of a rate hike in December at 70% suggests the FED is still moving steadily within the current rate hike cycle.
Hence, we believe the broad-based equity market should continue to remain unaffected and grind higher for now as the FED continues to embark on the tightening trajectory.
In conclusion, watching the FED’s action tells a lot especially when there is a huge shift in sentiment from hawisk to dovish, from rate hikes to rate reductions. The consensus of the market should lean toward the “buy the dip” strategy until the dovish rhetoric surfaces where the FFR is allowed to stay flat for a prolonged period. Once the next FFR reduction takes place, there is a high chance the market is facing something colossal. Will the current rate hike cycle lead to another crisis event? Only time will tell.
Pay close attention to what the FED has to say in the following FOMC meetings.
Important Information
This report is prepared and/or distributed by Phillip Securities Research Pte Ltd ("Phillip Securities Research"), which is a holder of a financial adviser’s licence under the Financial Advisers Act, Chapter 110 in Singapore.
By receiving or reading this report, you agree to be bound by the terms and limitations set out below. Any failure to comply with these terms and limitations may constitute a violation of law. This report has been provided to you for personal use only and shall not be reproduced, distributed or published by you in whole or in part, for any purpose. If you have received this report by mistake, please delete or destroy it, and notify the sender immediately.
The information and any analysis, forecasts, projections, expectations and opinions (collectively, the “Research”) contained in this report has been obtained from public sources which Phillip Securities Research believes to be reliable. However, Phillip Securities Research does not make any representation or warranty, express or implied that such information or Research is accurate, complete or appropriate or should be relied upon as such. Any such information or Research contained in this report is subject to change, and Phillip Securities Research shall not have any responsibility to maintain or update the information or Research made available or to supply any corrections, updates or releases in connection therewith.
Any opinions, forecasts, assumptions, estimates, valuations and prices contained in this report are as of the date indicated and are subject to change at any time without prior notice. Past performance of any product referred to in this report is not indicative of future results.
This report does not constitute, and should not be used as a substitute for, tax, legal or investment advice. This report should not be relied upon exclusively or as authoritative, without further being subject to the recipient’s own independent verification and exercise of judgment. The fact that this report has been made available constitutes neither a recommendation to enter into a particular transaction, nor a representation that any product described in this report is suitable or appropriate for the recipient. Recipients should be aware that many of the products, which may be described in this report involve significant risks and may not be suitable for all investors, and that any decision to enter into transactions involving such products should not be made, unless all such risks are understood and an independent determination has been made that such transactions would be appropriate. Any discussion of the risks contained herein with respect to any product should not be considered to be a disclosure of all risks or a complete discussion of such risks.
Nothing in this report shall be construed to be an offer or solicitation for the purchase or sale of any product. Any decision to purchase any product mentioned in this report should take into account existing public information, including any registered prospectus in respect of such product.
Phillip Securities Research, or persons associated with or connected to Phillip Securities Research, including but not limited to its officers, directors, employees or persons involved in the issuance of this report, may provide an array of financial services to a large number of corporations in Singapore and worldwide, including but not limited to commercial / investment banking activities (including sponsorship, financial advisory or underwriting activities), brokerage or securities trading activities. Phillip Securities Research, or persons associated with or connected to Phillip Securities Research, including but not limited to its officers, directors, employees or persons involved in the issuance of this report, may have participated in or invested in transactions with the issuer(s) of the securities mentioned in this report, and may have performed services for or solicited business from such issuers. Additionally, Phillip Securities Research, or persons associated with or connected to Phillip Securities Research, including but not limited to its officers, directors, employees or persons involved in the issuance of this report, may have provided advice or investment services to such companies and investments or related investments, as may be mentioned in this report.
Phillip Securities Research or persons associated with or connected to Phillip Securities Research, including but not limited to its officers, directors, employees or persons involved in the issuance of this report may, from time to time maintain a long or short position in securities referred to herein, or in related futures or options, purchase or sell, make a market in, or engage in any other transaction involving such securities, and earn brokerage or other compensation in respect of the foregoing. Investments will be denominated in various currencies including US dollars and Euro and thus will be subject to any fluctuation in exchange rates between US dollars and Euro or foreign currencies and the currency of your own jurisdiction. Such fluctuations may have an adverse effect on the value, price or income return of the investment.
To the extent permitted by law, Phillip Securities Research, or persons associated with or connected to Phillip Securities Research, including but not limited to its officers, directors, employees or persons involved in the issuance of this report, may at any time engage in any of the above activities as set out above or otherwise hold an interest, whether material or not, in respect of companies and investments or related investments, which may be mentioned in this report. Accordingly, information may be available to Phillip Securities Research, or persons associated with or connected to Phillip Securities Research, including but not limited to its officers, directors, employees or persons involved in the issuance of this report, which is not reflected in this report, and Phillip Securities Research, or persons associated with or connected to Phillip Securities Research, including but not limited to its officers, directors, employees or persons involved in the issuance of this report, may, to the extent permitted by law, have acted upon or used the information prior to or immediately following its publication. Phillip Securities Research, or persons associated with or connected to Phillip Securities Research, including but not limited its officers, directors, employees or persons involved in the issuance of this report, may have issued other material that is inconsistent with, or reach different conclusions from, the contents of this report.
The information, tools and material presented herein are not directed, intended for distribution to or use by, any person or entity in any jurisdiction or country where such distribution, publication, availability or use would be contrary to the applicable law or regulation or which would subject Phillip Securities Research to any registration or licensing or other requirement, or penalty for contravention of such requirements within such jurisdiction.
This report is intended for general circulation only and does not take into account the specific investment objectives, financial situation or particular needs of any particular person. The products mentioned in this report may not be suitable for all investors and a person receiving or reading this report should seek advice from a professional and financial adviser regarding the legal, business, financial, tax and other aspects including the suitability of such products, taking into account the specific investment objectives, financial situation or particular needs of that person, before making a commitment to invest in any of such products.
This report is not intended for distribution, publication to or use by any person in any jurisdiction outside of Singapore or any other jurisdiction as Phillip Securities Research may determine in its absolute discretion.
IMPORTANT DISCLOSURES FOR INCLUDED RESEARCH ANALYSES OR REPORTS OF FOREIGN RESEARCH HOUSE
Where the report contains research analyses or reports from a foreign research house, please note:

Jeremy specialises in Technical Analysis and has 10 years of experience in studying price action. His areas of expertise include intermarket analysis on the equities, currencies, commodities and bonds market.
He is also a regular columnist on The Business Times - every Monday ChartPoint column.
He graduated with a Bachelor of Science in Banking and Finance from University of London.
