
Green line = 200 day moving average
DJT Daily Chart Source: Bloomberg, PSR
The risk-on sentiment is back in full force once again with the small-cap stocks leading the way. Since May, the Russell 2000 index had broken multiple new record highs and advanced 3.8% above the January prior record high. Most of the main equity indices have also resumed their uptrend with the Dow Jones Industrial Average (DJIA) being the laggard. The closest proxy to the DJIA is the Dow Jones Transportation Average (DJT). The DJT is a price-weighted average of 20 US transportation stocks. Some of the better-known names are FedEx Corp, Union Pacific Corp, and United Parcel Service Inc. According to the Dow Theory, both the industrial companies and transport companies should move in tandem as both sectors require each other immensely. When a manufacturer produces more, shipping of such products to the market will be required hence the close positive correlation.
The DJT is currently 3.8% away from the January record high while the DJIA is 5.8% away from the January record high. Thus, with this gap, expect the DJIA to move alongside with the DJT with a greater percentage to retest the January record high.
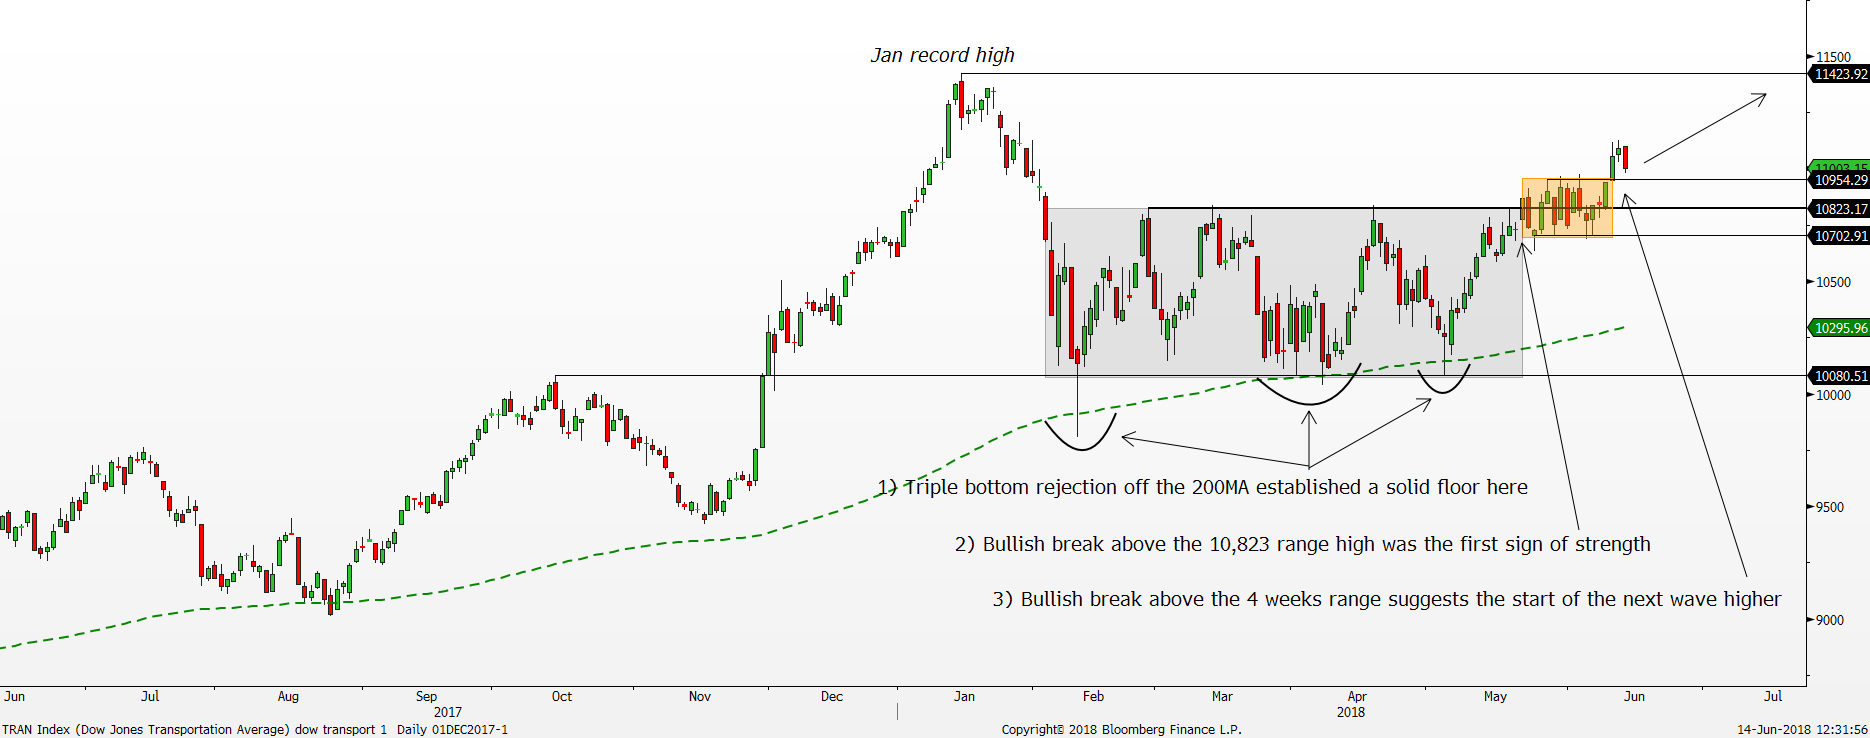
It was no surprise the DJT was hit hard during the February volatility storm selloff as the general market as a whole took a big hit. The DJT fell as much as -14% during that period and have since then rebounded strongly off the February low. The 200-day moving average was the crucial support that halted the massive selloff not just in February but also in April and May resulting in the formation of a triple bottom rejection. Hence, taking a zoom out view on the DJT shows a solid anchor floor at the 200-day moving average. The 200-day moving average should hold up firmly the next time another major selloff occurs.
Interestingly, with the most recent rebound off the 200-day moving average in May, the bulls have finally showed their dominance and succeeded in breaking above the 10,823 resistance area on 21 May. However, the follow through after the bullish breakout was rather lacklustre where the DJT continued to stay range bound within a smaller range with 10,954 being the range high and 10,702 being the range low. It took the market four weeks of consolidation before another breakout happened. On 11 June, the bulls jolted the DJT higher and broke above the 10,954 immediate range high. All in, it seems like the bulls are once again ready to lift price higher with the most recent bullish breakout. The January record high of 11,423 points will be the next likely target for the bulls. Expect the current bullish breakout in the DJT to lift the DJIA along with it.
Another positive catalyst that should propel the general equity market higher is the most recent interest rate hike decision. The Fed raised the benchmark interest rate from 1.75% to 2.00% during the June FOMC meeting as expected and kept the forward guidance of further interest rate hike intact. Our historical study shows that as long as the Fed continues to stay on the rate hike trajectory, the general equity market tends to rally along with it as the Fed continues to send out further vote of confidence to the market that the economy is strong enough to withstand higher interest burden. The end of the equity bull market is usually signalled by a reversal of the interest rate hike cycle to a rate cut cycle. According to the most recent Fed’s dot plot projection, the Fed does not see that coming anytime soon. In fact, the Fed is guiding the market for possibly two more 0.25% rate hikes this year and three more next year. All in, in the near-term, the general equity market should continue with this uptrend until the Fed suddenly switches to the dovish side and starts cutting interest rates.
Important Information
This report is prepared and/or distributed by Phillip Securities Research Pte Ltd ("Phillip Securities Research"), which is a holder of a financial adviser’s licence under the Financial Advisers Act, Chapter 110 in Singapore.
By receiving or reading this report, you agree to be bound by the terms and limitations set out below. Any failure to comply with these terms and limitations may constitute a violation of law. This report has been provided to you for personal use only and shall not be reproduced, distributed or published by you in whole or in part, for any purpose. If you have received this report by mistake, please delete or destroy it, and notify the sender immediately.
The information and any analysis, forecasts, projections, expectations and opinions (collectively, the “Research”) contained in this report has been obtained from public sources which Phillip Securities Research believes to be reliable. However, Phillip Securities Research does not make any representation or warranty, express or implied that such information or Research is accurate, complete or appropriate or should be relied upon as such. Any such information or Research contained in this report is subject to change, and Phillip Securities Research shall not have any responsibility to maintain or update the information or Research made available or to supply any corrections, updates or releases in connection therewith.
Any opinions, forecasts, assumptions, estimates, valuations and prices contained in this report are as of the date indicated and are subject to change at any time without prior notice. Past performance of any product referred to in this report is not indicative of future results.
This report does not constitute, and should not be used as a substitute for, tax, legal or investment advice. This report should not be relied upon exclusively or as authoritative, without further being subject to the recipient’s own independent verification and exercise of judgment. The fact that this report has been made available constitutes neither a recommendation to enter into a particular transaction, nor a representation that any product described in this report is suitable or appropriate for the recipient. Recipients should be aware that many of the products, which may be described in this report involve significant risks and may not be suitable for all investors, and that any decision to enter into transactions involving such products should not be made, unless all such risks are understood and an independent determination has been made that such transactions would be appropriate. Any discussion of the risks contained herein with respect to any product should not be considered to be a disclosure of all risks or a complete discussion of such risks.
Nothing in this report shall be construed to be an offer or solicitation for the purchase or sale of any product. Any decision to purchase any product mentioned in this report should take into account existing public information, including any registered prospectus in respect of such product.
Phillip Securities Research, or persons associated with or connected to Phillip Securities Research, including but not limited to its officers, directors, employees or persons involved in the issuance of this report, may provide an array of financial services to a large number of corporations in Singapore and worldwide, including but not limited to commercial / investment banking activities (including sponsorship, financial advisory or underwriting activities), brokerage or securities trading activities. Phillip Securities Research, or persons associated with or connected to Phillip Securities Research, including but not limited to its officers, directors, employees or persons involved in the issuance of this report, may have participated in or invested in transactions with the issuer(s) of the securities mentioned in this report, and may have performed services for or solicited business from such issuers. Additionally, Phillip Securities Research, or persons associated with or connected to Phillip Securities Research, including but not limited to its officers, directors, employees or persons involved in the issuance of this report, may have provided advice or investment services to such companies and investments or related investments, as may be mentioned in this report.
Phillip Securities Research or persons associated with or connected to Phillip Securities Research, including but not limited to its officers, directors, employees or persons involved in the issuance of this report may, from time to time maintain a long or short position in securities referred to herein, or in related futures or options, purchase or sell, make a market in, or engage in any other transaction involving such securities, and earn brokerage or other compensation in respect of the foregoing. Investments will be denominated in various currencies including US dollars and Euro and thus will be subject to any fluctuation in exchange rates between US dollars and Euro or foreign currencies and the currency of your own jurisdiction. Such fluctuations may have an adverse effect on the value, price or income return of the investment.
To the extent permitted by law, Phillip Securities Research, or persons associated with or connected to Phillip Securities Research, including but not limited to its officers, directors, employees or persons involved in the issuance of this report, may at any time engage in any of the above activities as set out above or otherwise hold an interest, whether material or not, in respect of companies and investments or related investments, which may be mentioned in this report. Accordingly, information may be available to Phillip Securities Research, or persons associated with or connected to Phillip Securities Research, including but not limited to its officers, directors, employees or persons involved in the issuance of this report, which is not reflected in this report, and Phillip Securities Research, or persons associated with or connected to Phillip Securities Research, including but not limited to its officers, directors, employees or persons involved in the issuance of this report, may, to the extent permitted by law, have acted upon or used the information prior to or immediately following its publication. Phillip Securities Research, or persons associated with or connected to Phillip Securities Research, including but not limited its officers, directors, employees or persons involved in the issuance of this report, may have issued other material that is inconsistent with, or reach different conclusions from, the contents of this report.
The information, tools and material presented herein are not directed, intended for distribution to or use by, any person or entity in any jurisdiction or country where such distribution, publication, availability or use would be contrary to the applicable law or regulation or which would subject Phillip Securities Research to any registration or licensing or other requirement, or penalty for contravention of such requirements within such jurisdiction.
This report is intended for general circulation only and does not take into account the specific investment objectives, financial situation or particular needs of any particular person. The products mentioned in this report may not be suitable for all investors and a person receiving or reading this report should seek advice from a professional and financial adviser regarding the legal, business, financial, tax and other aspects including the suitability of such products, taking into account the specific investment objectives, financial situation or particular needs of that person, before making a commitment to invest in any of such products.
This report is not intended for distribution, publication to or use by any person in any jurisdiction outside of Singapore or any other jurisdiction as Phillip Securities Research may determine in its absolute discretion.
IMPORTANT DISCLOSURES FOR INCLUDED RESEARCH ANALYSES OR REPORTS OF FOREIGN RESEARCH HOUSE
Where the report contains research analyses or reports from a foreign research house, please note:

Jeremy specialises in Technical Analysis and has 10 years of experience in studying price action. His areas of expertise include intermarket analysis on the equities, currencies, commodities and bonds market.
He is also a regular columnist on The Business Times - every Monday ChartPoint column.
He graduated with a Bachelor of Science in Banking and Finance from University of London.
