
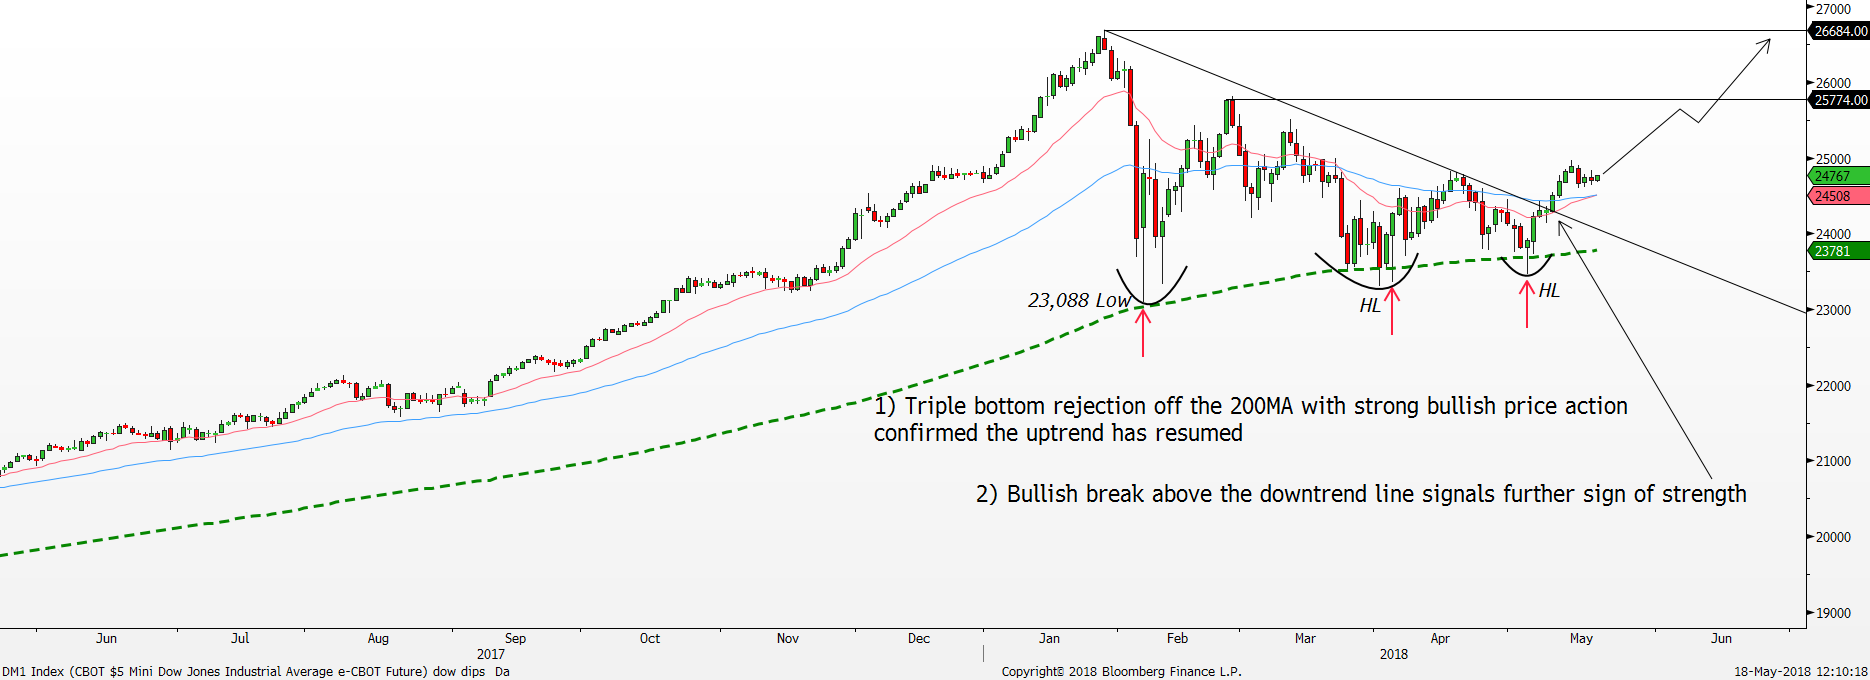
Dow Jones Industrial Average Index Daily Chart Source: Bloomberg, PSR
Red line = 20 day moving average, blue line = 60 day moving average, green line = 200 day moving average
The Dow Jones Industrial Average (DJIA) had the longest winning streak since September 2017 after rallying eight consecutive days in a row since 3 May 2018. However, the spell was broken last week after the bulls stumbled near the 24,827 immediate resistance area. Despite the minor setback, this is just part of the market dynamics where the uptrend establishes the uptrend structure of higher highs (HH) and higher lows (HL). The near-term outlook in the DJIA remains bullish as the market stayed relatively flat last week.
Since February 2018, the general equity market in the US has been stuck in a correction as the broad-based market sold off hard before finding some support at the 200-day moving average. The DJIA fell as much as -11% over a two-day time window in early February. The subsequent price action continued to show relentless buying at the crucial 200-day moving average proved the market is watching that level extremely closely.
The 200-day moving average could be seen as the dividing line between the bulls and the bears. If the DJIA is above the 200-day moving average, the trend remains bullish. However, if the DJIA closes below the 200-day moving average, the market might witness some near-term panic selloff where the immediate trend shifts to the downside.
With the benefit of hindsight, the correction phase since February had tested the 200-day moving average on three separate occasions with the bulls winning the fight each time. Notice how each bullish rejection off the 200-day moving average was confirmed with prominent bullish price action (Hammer) shown by the red arrows in the chart suggests the market is defending the 200-day moving average at all cost. Moreover, taking an alternative view also shows a triple bottom bullish pattern forming off the 200-day moving average. With the bullish streak last week, the DJIA has also succeeded in breaking above the 20, 60 day moving average and downtrend line signals further upside as the 200-day moving average base firms up.
The minor details on how the DJIA has been progressing along with two recent Higher Lows (HL) are further clues that the uptrend is getting stronger. For instance, using the 23,088 low after the volatile selloff in early February as the reference point, the subsequent lows were at a higher level such as the 2 April low of 23,306 followed by 3 May low of 23,467 confirmed the advancement by the bulls.
Interestingly, the small-cap stocks are doing much better than the DJIA, S&P 500 and Nasdaq 100 index. The S&P 600 small-cap index and Russell 2000 index have both recently broke new record highs erasing the striking selloff in early February. The VIX index has also traded comfortably back below the 20 range and in fact stayed below 15 for the past two weeks further confirmed the risk-on appetite mode is back in full force again. Hence, expect the current risk-on sentiment to usher in further buying momentum back to the main US equity indices.
In summary, the price action is supportive for a bullish move higher with the ongoing triple bottom rejection off the 200-day moving average. The next target for the bulls is the 25,774 resistance area followed by 26,684. This bullish outlook is true for the S&P 500 index and the Nasdaq 100 index.
Important Information
This report is prepared and/or distributed by Phillip Securities Research Pte Ltd ("Phillip Securities Research"), which is a holder of a financial adviser’s licence under the Financial Advisers Act, Chapter 110 in Singapore.
By receiving or reading this report, you agree to be bound by the terms and limitations set out below. Any failure to comply with these terms and limitations may constitute a violation of law. This report has been provided to you for personal use only and shall not be reproduced, distributed or published by you in whole or in part, for any purpose. If you have received this report by mistake, please delete or destroy it, and notify the sender immediately.
The information and any analysis, forecasts, projections, expectations and opinions (collectively, the “Research”) contained in this report has been obtained from public sources which Phillip Securities Research believes to be reliable. However, Phillip Securities Research does not make any representation or warranty, express or implied that such information or Research is accurate, complete or appropriate or should be relied upon as such. Any such information or Research contained in this report is subject to change, and Phillip Securities Research shall not have any responsibility to maintain or update the information or Research made available or to supply any corrections, updates or releases in connection therewith.
Any opinions, forecasts, assumptions, estimates, valuations and prices contained in this report are as of the date indicated and are subject to change at any time without prior notice. Past performance of any product referred to in this report is not indicative of future results.
This report does not constitute, and should not be used as a substitute for, tax, legal or investment advice. This report should not be relied upon exclusively or as authoritative, without further being subject to the recipient’s own independent verification and exercise of judgment. The fact that this report has been made available constitutes neither a recommendation to enter into a particular transaction, nor a representation that any product described in this report is suitable or appropriate for the recipient. Recipients should be aware that many of the products, which may be described in this report involve significant risks and may not be suitable for all investors, and that any decision to enter into transactions involving such products should not be made, unless all such risks are understood and an independent determination has been made that such transactions would be appropriate. Any discussion of the risks contained herein with respect to any product should not be considered to be a disclosure of all risks or a complete discussion of such risks.
Nothing in this report shall be construed to be an offer or solicitation for the purchase or sale of any product. Any decision to purchase any product mentioned in this report should take into account existing public information, including any registered prospectus in respect of such product.
Phillip Securities Research, or persons associated with or connected to Phillip Securities Research, including but not limited to its officers, directors, employees or persons involved in the issuance of this report, may provide an array of financial services to a large number of corporations in Singapore and worldwide, including but not limited to commercial / investment banking activities (including sponsorship, financial advisory or underwriting activities), brokerage or securities trading activities. Phillip Securities Research, or persons associated with or connected to Phillip Securities Research, including but not limited to its officers, directors, employees or persons involved in the issuance of this report, may have participated in or invested in transactions with the issuer(s) of the securities mentioned in this report, and may have performed services for or solicited business from such issuers. Additionally, Phillip Securities Research, or persons associated with or connected to Phillip Securities Research, including but not limited to its officers, directors, employees or persons involved in the issuance of this report, may have provided advice or investment services to such companies and investments or related investments, as may be mentioned in this report.
Phillip Securities Research or persons associated with or connected to Phillip Securities Research, including but not limited to its officers, directors, employees or persons involved in the issuance of this report may, from time to time maintain a long or short position in securities referred to herein, or in related futures or options, purchase or sell, make a market in, or engage in any other transaction involving such securities, and earn brokerage or other compensation in respect of the foregoing. Investments will be denominated in various currencies including US dollars and Euro and thus will be subject to any fluctuation in exchange rates between US dollars and Euro or foreign currencies and the currency of your own jurisdiction. Such fluctuations may have an adverse effect on the value, price or income return of the investment.
To the extent permitted by law, Phillip Securities Research, or persons associated with or connected to Phillip Securities Research, including but not limited to its officers, directors, employees or persons involved in the issuance of this report, may at any time engage in any of the above activities as set out above or otherwise hold an interest, whether material or not, in respect of companies and investments or related investments, which may be mentioned in this report. Accordingly, information may be available to Phillip Securities Research, or persons associated with or connected to Phillip Securities Research, including but not limited to its officers, directors, employees or persons involved in the issuance of this report, which is not reflected in this report, and Phillip Securities Research, or persons associated with or connected to Phillip Securities Research, including but not limited to its officers, directors, employees or persons involved in the issuance of this report, may, to the extent permitted by law, have acted upon or used the information prior to or immediately following its publication. Phillip Securities Research, or persons associated with or connected to Phillip Securities Research, including but not limited its officers, directors, employees or persons involved in the issuance of this report, may have issued other material that is inconsistent with, or reach different conclusions from, the contents of this report.
The information, tools and material presented herein are not directed, intended for distribution to or use by, any person or entity in any jurisdiction or country where such distribution, publication, availability or use would be contrary to the applicable law or regulation or which would subject Phillip Securities Research to any registration or licensing or other requirement, or penalty for contravention of such requirements within such jurisdiction.
This report is intended for general circulation only and does not take into account the specific investment objectives, financial situation or particular needs of any particular person. The products mentioned in this report may not be suitable for all investors and a person receiving or reading this report should seek advice from a professional and financial adviser regarding the legal, business, financial, tax and other aspects including the suitability of such products, taking into account the specific investment objectives, financial situation or particular needs of that person, before making a commitment to invest in any of such products.
This report is not intended for distribution, publication to or use by any person in any jurisdiction outside of Singapore or any other jurisdiction as Phillip Securities Research may determine in its absolute discretion.
IMPORTANT DISCLOSURES FOR INCLUDED RESEARCH ANALYSES OR REPORTS OF FOREIGN RESEARCH HOUSE
Where the report contains research analyses or reports from a foreign research house, please note:

Jeremy specialises in Technical Analysis and has 10 years of experience in studying price action. His areas of expertise include intermarket analysis on the equities, currencies, commodities and bonds market.
He is also a regular columnist on The Business Times - every Monday ChartPoint column.
He graduated with a Bachelor of Science in Banking and Finance from University of London.
