
Dollar Index Monthly Chart Source: Bloomberg, PSR
*Vertical line demarcates the point where the cyclical top is formed
Despite the current interest rate hike cycle that began in December 2015, the dollar index (DXY) has been on a decline. Since 2017, the FED has hiked the Fed Funds Rate (FFR) four times, lifting the FFR from 0.75% to 1.75% but the DXY went into a selloff instead. The DXY has fallen -14% after forming a top at the 103.82 high in January 2017, and we believe the downtrend has only started. The US dollar index is an index of the United States dollar relative to a basket of Euro, Japanese Yen, Pound Sterling, Canadian Dollar, Swedish Krona and Swiss Franc.
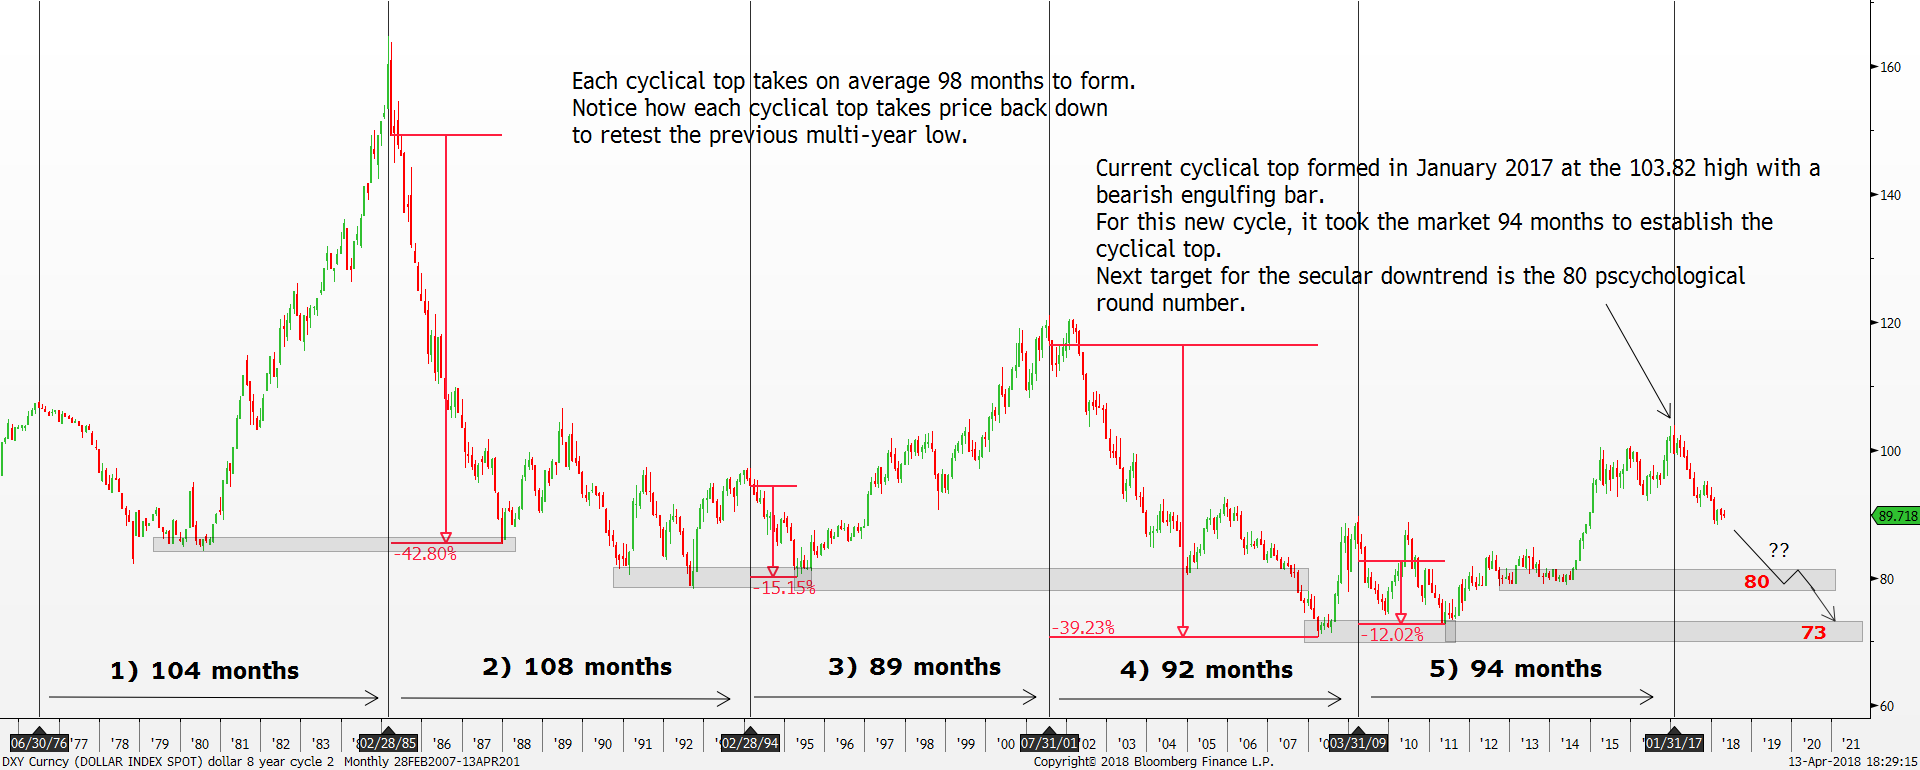
From a longer-term perspective, the DXY tends to follow a cycle that takes approximately 8 years or 98 months to form a new top from the prior top, as shown by the vertical lines. The way we measure the cycle is to pinpoint the major turning point top. Since 1970, the DXY has been following this 8 year cycle faithfully. Four full cycles played out as the DXY fell lower on each occasion ranging from -12% to -42%. At the cyclical top, the DXY tends to form significant bearish price action such as a bearish engulfing bar or shooting star. Keep in mind the 8 years timeframe is only an estimation of when the cyclical top might form. Further bearish price action is needed to confirm the formation of the cyclical top.
To illustrate, the first cycle was completed in February 1985 after the DXY hit a high of 164.72 and formed a bearish engulfing bar. For that cycle, it took the market 104 months to form the cyclical top leading to a sharp selloff of -42% over the following 34 months. A more recent example of the cycle happened in March 2009 where the market took 92 months to establish the cyclical top with the bearish engulfing bar acting as the signal once again.
With the benefit of hindsight, the DXY has already formed a new cyclical top in January 2017 at a high of 103.82. For this most recent cycle, the DXY took 94 months to form using the March 2009 cyclical top as the reference point. In addition, the January 2017 high was also rejected by a bearish price action bar, bearish engulfing bar signals the uncanny resemblance to the previous few cyclical tops. No doubt, after the January bearish price action was formed, the DXY headed into a selloff and confirmed the 103.82 January 2017 high as the cyclical top. The -13% selloff since then also confirmed that the DXY is currently in the midst of a secular downtrend.
Interesting, once the cyclical top is formed, the bear market usually takes price back down to retest the multi-year low shown by the highlighted areas in the chart. Hence, for this secular downtrend, we expect the DXY to retest the multi-year low of 80 psychological round number first followed by the 2011 low of 73.00.
Near-term price action wise, the DXY has also broken below the key 92.00 range low recently signals a step forward for the secular downtrend. The immediate downtrend is still very much being capped by the confluence of resistance at 20, 60 day moving average and 91.00 range high where further downward pressure is expected.
Important Information
This report is prepared and/or distributed by Phillip Securities Research Pte Ltd ("Phillip Securities Research"), which is a holder of a financial adviser’s licence under the Financial Advisers Act, Chapter 110 in Singapore.
By receiving or reading this report, you agree to be bound by the terms and limitations set out below. Any failure to comply with these terms and limitations may constitute a violation of law. This report has been provided to you for personal use only and shall not be reproduced, distributed or published by you in whole or in part, for any purpose. If you have received this report by mistake, please delete or destroy it, and notify the sender immediately.
The information and any analysis, forecasts, projections, expectations and opinions (collectively, the “Research”) contained in this report has been obtained from public sources which Phillip Securities Research believes to be reliable. However, Phillip Securities Research does not make any representation or warranty, express or implied that such information or Research is accurate, complete or appropriate or should be relied upon as such. Any such information or Research contained in this report is subject to change, and Phillip Securities Research shall not have any responsibility to maintain or update the information or Research made available or to supply any corrections, updates or releases in connection therewith.
Any opinions, forecasts, assumptions, estimates, valuations and prices contained in this report are as of the date indicated and are subject to change at any time without prior notice. Past performance of any product referred to in this report is not indicative of future results.
This report does not constitute, and should not be used as a substitute for, tax, legal or investment advice. This report should not be relied upon exclusively or as authoritative, without further being subject to the recipient’s own independent verification and exercise of judgment. The fact that this report has been made available constitutes neither a recommendation to enter into a particular transaction, nor a representation that any product described in this report is suitable or appropriate for the recipient. Recipients should be aware that many of the products, which may be described in this report involve significant risks and may not be suitable for all investors, and that any decision to enter into transactions involving such products should not be made, unless all such risks are understood and an independent determination has been made that such transactions would be appropriate. Any discussion of the risks contained herein with respect to any product should not be considered to be a disclosure of all risks or a complete discussion of such risks.
Nothing in this report shall be construed to be an offer or solicitation for the purchase or sale of any product. Any decision to purchase any product mentioned in this report should take into account existing public information, including any registered prospectus in respect of such product.
Phillip Securities Research, or persons associated with or connected to Phillip Securities Research, including but not limited to its officers, directors, employees or persons involved in the issuance of this report, may provide an array of financial services to a large number of corporations in Singapore and worldwide, including but not limited to commercial / investment banking activities (including sponsorship, financial advisory or underwriting activities), brokerage or securities trading activities. Phillip Securities Research, or persons associated with or connected to Phillip Securities Research, including but not limited to its officers, directors, employees or persons involved in the issuance of this report, may have participated in or invested in transactions with the issuer(s) of the securities mentioned in this report, and may have performed services for or solicited business from such issuers. Additionally, Phillip Securities Research, or persons associated with or connected to Phillip Securities Research, including but not limited to its officers, directors, employees or persons involved in the issuance of this report, may have provided advice or investment services to such companies and investments or related investments, as may be mentioned in this report.
Phillip Securities Research or persons associated with or connected to Phillip Securities Research, including but not limited to its officers, directors, employees or persons involved in the issuance of this report may, from time to time maintain a long or short position in securities referred to herein, or in related futures or options, purchase or sell, make a market in, or engage in any other transaction involving such securities, and earn brokerage or other compensation in respect of the foregoing. Investments will be denominated in various currencies including US dollars and Euro and thus will be subject to any fluctuation in exchange rates between US dollars and Euro or foreign currencies and the currency of your own jurisdiction. Such fluctuations may have an adverse effect on the value, price or income return of the investment.
To the extent permitted by law, Phillip Securities Research, or persons associated with or connected to Phillip Securities Research, including but not limited to its officers, directors, employees or persons involved in the issuance of this report, may at any time engage in any of the above activities as set out above or otherwise hold an interest, whether material or not, in respect of companies and investments or related investments, which may be mentioned in this report. Accordingly, information may be available to Phillip Securities Research, or persons associated with or connected to Phillip Securities Research, including but not limited to its officers, directors, employees or persons involved in the issuance of this report, which is not reflected in this report, and Phillip Securities Research, or persons associated with or connected to Phillip Securities Research, including but not limited to its officers, directors, employees or persons involved in the issuance of this report, may, to the extent permitted by law, have acted upon or used the information prior to or immediately following its publication. Phillip Securities Research, or persons associated with or connected to Phillip Securities Research, including but not limited its officers, directors, employees or persons involved in the issuance of this report, may have issued other material that is inconsistent with, or reach different conclusions from, the contents of this report.
The information, tools and material presented herein are not directed, intended for distribution to or use by, any person or entity in any jurisdiction or country where such distribution, publication, availability or use would be contrary to the applicable law or regulation or which would subject Phillip Securities Research to any registration or licensing or other requirement, or penalty for contravention of such requirements within such jurisdiction.
This report is intended for general circulation only and does not take into account the specific investment objectives, financial situation or particular needs of any particular person. The products mentioned in this report may not be suitable for all investors and a person receiving or reading this report should seek advice from a professional and financial adviser regarding the legal, business, financial, tax and other aspects including the suitability of such products, taking into account the specific investment objectives, financial situation or particular needs of that person, before making a commitment to invest in any of such products.
This report is not intended for distribution, publication to or use by any person in any jurisdiction outside of Singapore or any other jurisdiction as Phillip Securities Research may determine in its absolute discretion.
IMPORTANT DISCLOSURES FOR INCLUDED RESEARCH ANALYSES OR REPORTS OF FOREIGN RESEARCH HOUSE
Where the report contains research analyses or reports from a foreign research house, please note:

Jeremy specialises in Technical Analysis and has 10 years of experience in studying price action. His areas of expertise include intermarket analysis on the equities, currencies, commodities and bonds market.
He is also a regular columnist on The Business Times - every Monday ChartPoint column.
He graduated with a Bachelor of Science in Banking and Finance from University of London.
