
Investment Thesis
Investment Actions
We initiate coverage on CNMC with a Buy rating and a DCF-derived target price of S$1.03, using a cost of equity of 9.8%. Together with an estimated dividend of SG cents 1.4 for FY16, implied upside is 102.6%.
Company Background
In Jun-2016, the group signed a non-binding letter of intent with Pulai Mining Sdn Bhd to acquire a 51% stake. Pulai mining is a brownfield with 11 licenses covering roughly 38.4km2 to explore and mine for gold, iron ore, and feldspar.
Investment Thesis
Eye on the gold value chain, there are mainly five gold supply channels, namely, mine production, artisanal production, recycled gold, official sector sales, and net producer hedging. Mine production dominates the majority of supply and sees relatively lower volatilities in numbers yearly, while the latter three channels are subject to the macroeconomic environment, resulting in volatile supply.
According to the GFMS Gold Survey 2016, referring to Figure 1, the supply from mine production has been trending up over the past decade, from 2,497 tonnes in 2006 to 3,158 tonnes in 2015. Scrap supply (artisanal production and recycled gold), the second largest contribution, was relatively price-sensitive, tracking the rise and fall of the gold price, since the scrap holders selectively and speculatively monetised gold in hand during the upswing period and were deterred to sell when gold price was under downward pressure. Likewise, net producer hedging, which is the change in the physical market impact of mining companies’ gold loans, forwards and options positions, moved inversely with market price and expectation. In the gold bull market, gold miners leveraged financial instruments to defer deliveries at a higher price, while in the bear market, they locked in the selling price in order to avoid further downfall.
Figure 1. World gold supply breakdown
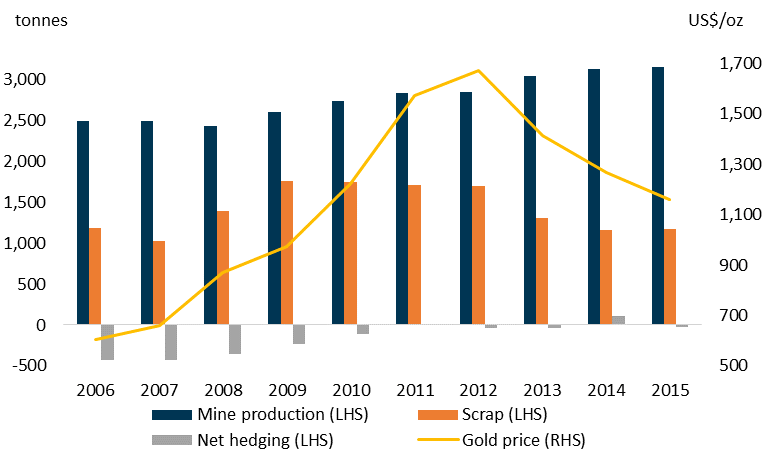
Source: GFMS, Thomson Reuters, PSR
As for the demand drivers for gold, demand generators can be classified into 4 broad categories – jewellery, investment, official sector, and industrials. Over the last decade, demand derived from jewellery-making and investment purposes ranked as the top two, which were influenced by the market sentiment towards gold price. However, the amount of industrial demand was on an apparent downtrend, with the drop from 482 tonnes in 2006 to 361 tonnes in 2015, due to the development of substitute materials. Lastly, since the 2008 global financial crisis turmoil, the official sector, especially central banks and major financial institutions, started increasing their gold reserves, reversing a previous trend, partly due to the authorities’ weakening faith in the fragile currency markets. Rising regional conflicts worldwide also lifted the demand for gold in treasury vaults. After all, gold has been recognised as the perfect risk avoidance asset amongst all.
Figure 2. World gold demand breakdown
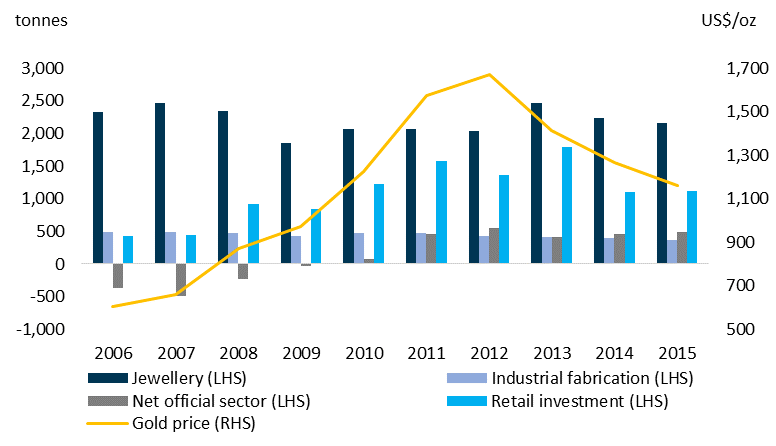
Source: GFMS, Thomson Reuters, PSR
As shown in Figure 3, global gold supply and demand balances were shifting between surpluses and deficits over the past decade. Here we need to indicate that gold price is not mainly driven by the imbalance between supply and demand, but is more driven by monetary supply (we elaborate on this in the following paragraphs). Fluctuations in gold price in turn drive demand and supply dynamics. When gold price is riding on the tailwind, producers are inclined to expand production to capture the higher margin, while investors and consumers will take advantage of lower gold prices when gold prices move down, thereby boosting demand.
Figure 3. World physical gold supply and demand
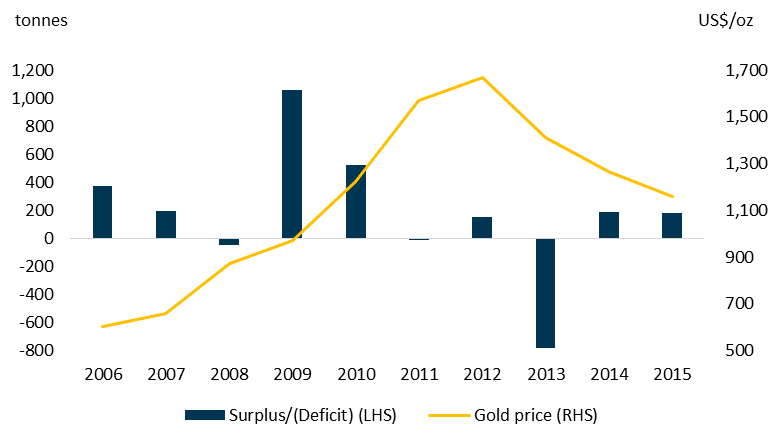
Source: GFMS, Thomson Reuters, PSR
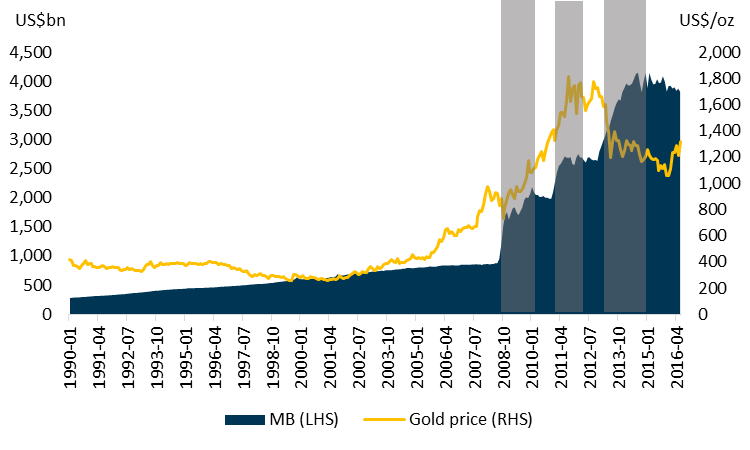
2. Main driver of gold price: Money supply
US started to launch the quantitative easing (QE) program in order to deal with liquidity crunch during the subprime crisis in 2008. A total three rounds of QE lasted for seven years, initiated in 4Q08 and ended in 4Q14. Referring to Figure 4, the three rounds of QE (highlighted in grey) distorted the normalised growth of monetary base over the past decades. As a result, asset prices were inflated exponentially. For instance, US equity market reached a new high in early 2013 right after the 3rd round of QE was announced. With the continuation of QE, S&P 500 index skyrocketed and reached the all-time high of 2,193 in Aug-16. The flooded monetary base tremendously boosted liquidity which drove equity prices up.
Figure 4. US monetary base and S&P 500
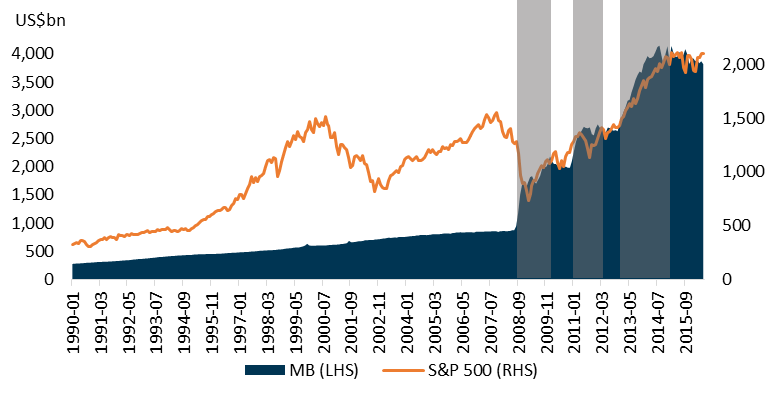
Source: Bloomberg, PSR
Referring to Figure 5, the gold bull market began in 2005 and ended in 2012. Subject to dire sentiment widely spreading during the subprime crisis, those gold positions were inevitably liquidated. However, gold rallied swiftly right after the 1st round of QE was announced, since the market pursued less risky assets, among which gold is viewed as a traditional safe haven. Benefiting from the 2nd round of QE, the unstoppable inflows of capital pulled up gold prices to the all-time high level of US$1,920/oz. The paradox was triggered in 2012 because gold markets turned the other way round when more capital was pumped into the market during the 3rd round of QE. One of the reasons could be investors shifted capitals to equity and bond markets to pursue higher yields. Therefore, the gold price was supressed.
Figure 5. US monetary base and gold price
Source: Bloomberg, PSR
Please download the full report to read on.
Important Information
This report is prepared and/or distributed by Phillip Securities Research Pte Ltd ("Phillip Securities Research"), which is a holder of a financial adviser’s licence under the Financial Advisers Act, Chapter 110 in Singapore.
By receiving or reading this report, you agree to be bound by the terms and limitations set out below. Any failure to comply with these terms and limitations may constitute a violation of law. This report has been provided to you for personal use only and shall not be reproduced, distributed or published by you in whole or in part, for any purpose. If you have received this report by mistake, please delete or destroy it, and notify the sender immediately.
The information and any analysis, forecasts, projections, expectations and opinions (collectively, the “Research”) contained in this report has been obtained from public sources which Phillip Securities Research believes to be reliable. However, Phillip Securities Research does not make any representation or warranty, express or implied that such information or Research is accurate, complete or appropriate or should be relied upon as such. Any such information or Research contained in this report is subject to change, and Phillip Securities Research shall not have any responsibility to maintain or update the information or Research made available or to supply any corrections, updates or releases in connection therewith.
Any opinions, forecasts, assumptions, estimates, valuations and prices contained in this report are as of the date indicated and are subject to change at any time without prior notice. Past performance of any product referred to in this report is not indicative of future results.
This report does not constitute, and should not be used as a substitute for, tax, legal or investment advice. This report should not be relied upon exclusively or as authoritative, without further being subject to the recipient’s own independent verification and exercise of judgment. The fact that this report has been made available constitutes neither a recommendation to enter into a particular transaction, nor a representation that any product described in this report is suitable or appropriate for the recipient. Recipients should be aware that many of the products, which may be described in this report involve significant risks and may not be suitable for all investors, and that any decision to enter into transactions involving such products should not be made, unless all such risks are understood and an independent determination has been made that such transactions would be appropriate. Any discussion of the risks contained herein with respect to any product should not be considered to be a disclosure of all risks or a complete discussion of such risks.
Nothing in this report shall be construed to be an offer or solicitation for the purchase or sale of any product. Any decision to purchase any product mentioned in this report should take into account existing public information, including any registered prospectus in respect of such product.
Phillip Securities Research, or persons associated with or connected to Phillip Securities Research, including but not limited to its officers, directors, employees or persons involved in the issuance of this report, may provide an array of financial services to a large number of corporations in Singapore and worldwide, including but not limited to commercial / investment banking activities (including sponsorship, financial advisory or underwriting activities), brokerage or securities trading activities. Phillip Securities Research, or persons associated with or connected to Phillip Securities Research, including but not limited to its officers, directors, employees or persons involved in the issuance of this report, may have participated in or invested in transactions with the issuer(s) of the securities mentioned in this report, and may have performed services for or solicited business from such issuers. Additionally, Phillip Securities Research, or persons associated with or connected to Phillip Securities Research, including but not limited to its officers, directors, employees or persons involved in the issuance of this report, may have provided advice or investment services to such companies and investments or related investments, as may be mentioned in this report.
Phillip Securities Research or persons associated with or connected to Phillip Securities Research, including but not limited to its officers, directors, employees or persons involved in the issuance of this report may, from time to time maintain a long or short position in securities referred to herein, or in related futures or options, purchase or sell, make a market in, or engage in any other transaction involving such securities, and earn brokerage or other compensation in respect of the foregoing. Investments will be denominated in various currencies including US dollars and Euro and thus will be subject to any fluctuation in exchange rates between US dollars and Euro or foreign currencies and the currency of your own jurisdiction. Such fluctuations may have an adverse effect on the value, price or income return of the investment.
To the extent permitted by law, Phillip Securities Research, or persons associated with or connected to Phillip Securities Research, including but not limited to its officers, directors, employees or persons involved in the issuance of this report, may at any time engage in any of the above activities as set out above or otherwise hold an interest, whether material or not, in respect of companies and investments or related investments, which may be mentioned in this report. Accordingly, information may be available to Phillip Securities Research, or persons associated with or connected to Phillip Securities Research, including but not limited to its officers, directors, employees or persons involved in the issuance of this report, which is not reflected in this report, and Phillip Securities Research, or persons associated with or connected to Phillip Securities Research, including but not limited to its officers, directors, employees or persons involved in the issuance of this report, may, to the extent permitted by law, have acted upon or used the information prior to or immediately following its publication. Phillip Securities Research, or persons associated with or connected to Phillip Securities Research, including but not limited its officers, directors, employees or persons involved in the issuance of this report, may have issued other material that is inconsistent with, or reach different conclusions from, the contents of this report.
The information, tools and material presented herein are not directed, intended for distribution to or use by, any person or entity in any jurisdiction or country where such distribution, publication, availability or use would be contrary to the applicable law or regulation or which would subject Phillip Securities Research to any registration or licensing or other requirement, or penalty for contravention of such requirements within such jurisdiction.
This report is intended for general circulation only and does not take into account the specific investment objectives, financial situation or particular needs of any particular person. The products mentioned in this report may not be suitable for all investors and a person receiving or reading this report should seek advice from a professional and financial adviser regarding the legal, business, financial, tax and other aspects including the suitability of such products, taking into account the specific investment objectives, financial situation or particular needs of that person, before making a commitment to invest in any of such products.
This report is not intended for distribution, publication to or use by any person in any jurisdiction outside of Singapore or any other jurisdiction as Phillip Securities Research may determine in its absolute discretion.
IMPORTANT DISCLOSURES FOR INCLUDED RESEARCH ANALYSES OR REPORTS OF FOREIGN RESEARCH HOUSE
Where the report contains research analyses or reports from a foreign research house, please note:

Guangzhi graduated from Singapore Management University with a Master degree in Applied Finance and from South China University of Technology with a Bachelor degree in Electronic Commerce.
The current sector coverages include Energy, Utilities, and Mining sectors. He has 3 years experience in equity research in both Hong Kong and Singapore market. He is the mandarin spokesperson for Phillip Securities Research in relation to China-related projects and all mandarin seminars and client events.
