
This article was published in Business Times’ column “Chart Point” on 29 January 2018.
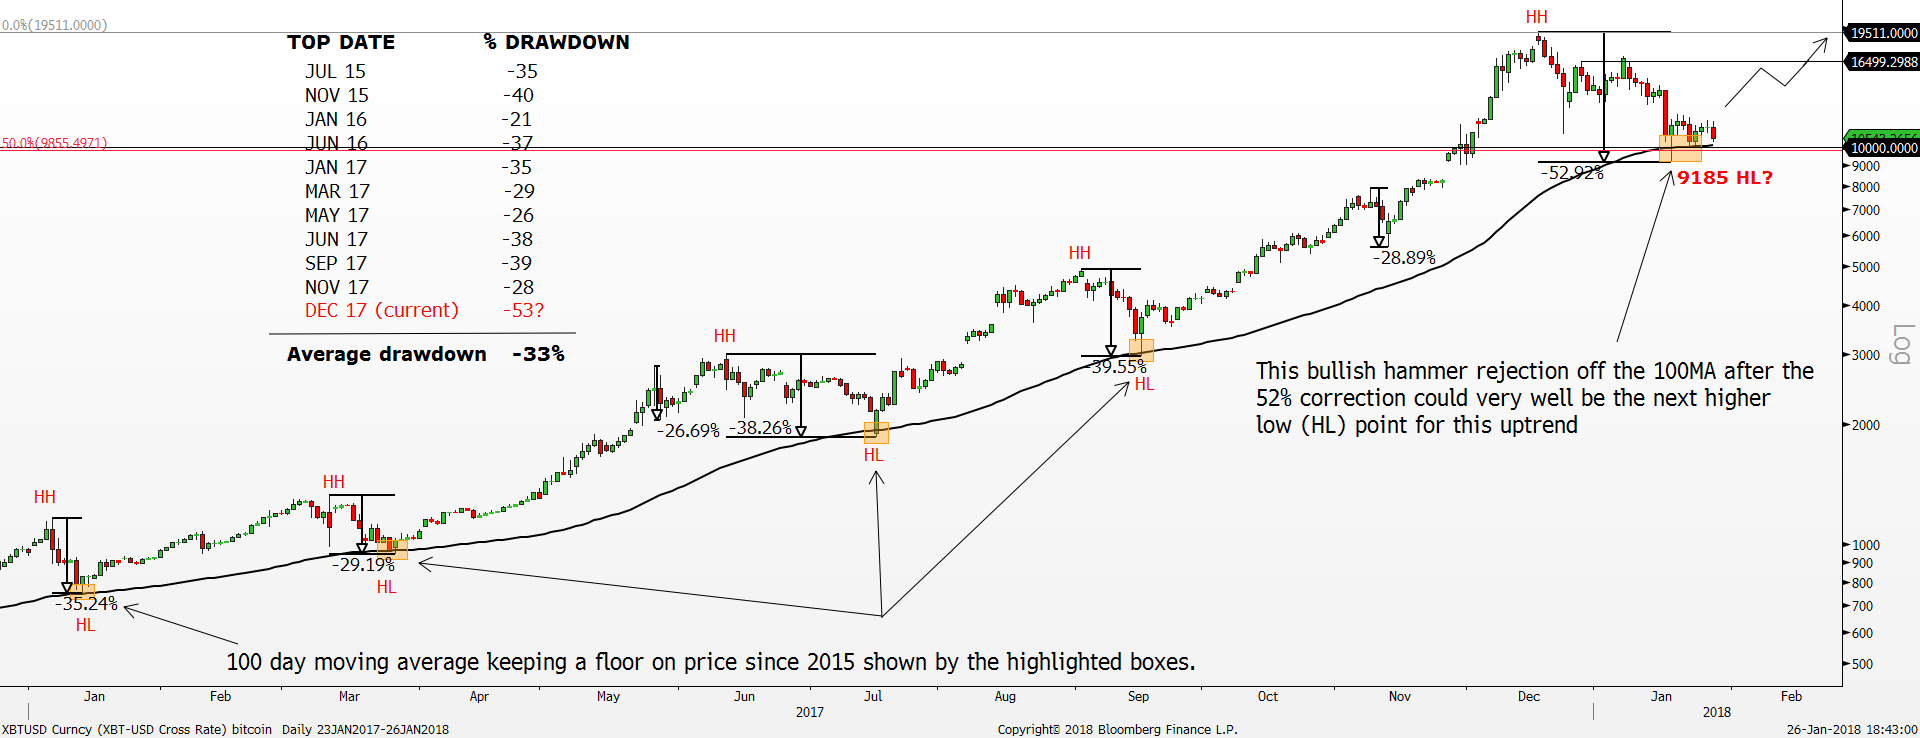
Bitcoin daily Chart Source: Bloomberg, PSR
*black line = 10 day exponential moving average
Bitcoin first began trading in 2010 and have since experienced many episodes of wild swings to the downside. Crashes of up to 50% were a norm in the early days of bitcoin, but all the early moves are almost negligible compared to the current price of bitcoin. The idea of this cryptocurrency seemed to be catching on to the crowd as it survived through multiple crashes.
Each asset class behaves differently to different indicators and parameters. Our study has shown that the 100-day exponential moving average appears to be the dividing line between the long-term bulls and the long-term bears. The general rule of thumb at least for bitcoin is if the price is above the 100-day moving average, then the uptrend is deeply entrenched, vice versa. The 100-day moving average is a critical area to watch as it has been the backbone that kept the uptrend intact since June 2015. As long as it holds, the general uptrend should remain healthy.
In total, there were six various occasions where the 100-day moving average successfully reversed the sharp sell-off since 2015 shown by the highlighted areas, proving the importance of the 100-day moving average. Every rebound off the 100-day moving average propelled price into new record highs. The current price action around the 100-day moving average will be pivotal for deciding if the long-term uptrend remains intact or not.
By calculating the major corrections that happened after Bitcoin trended higher consistently suggests a high likelihood of a reversal back to the uptrend soon. For this study, we only used the data after 2015 by combining the 100-day moving average signal. Since June 2015, after Bitcoin closed above the 100-day moving average, a bottom was gradually established. Bitcoin started breaking higher above the $300 range. It was around that timeframe when the euphoric bulls rushed in and created the parabolic move higher. Bitcoin rose from a low base of $210 to a high of $1950 over two years. During this strong bullish phase, Bitcoin experienced ten major corrections of up to -21% and the largest drawdown was -40% in November 2015. On average, the correction was around -33% before the relentless buyers re-emerge.
Coincidentally, after the futures market went live in December 2017, Bitcoin formed a top at a record high of $19,500 and subsequently nosedived. Part of the reason for the sharp selloff is the ability to short bitcoin in the Futures market where it was unavailable previously.
The current correction of -53% that we are witnessing has already surpassed both the average correction of -33% and the largest drawdown of -40% in November 2015. This might not come as a surprise considering how fast Bitcoin has rallied over the past one year. As the bullish moves go parabolic, a deeper and larger correction is unavoidable.
Therefore, with the current correction overstretching to the extreme, a reversal higher should be expected where the mean reversion occurs. Moreover, with Bitcoin testing the crucial 100-day moving average, this makes a resumption of the long-term uptrend much likelier. Bitcoin is also currently sitting at a confluence of support at the $10,000 psychological round number, long-term 50% Fibonacci retracement level from August 2015 base which should continue to keep the uptrend intact.
From the price action perspective, the bullish reversal hammer on 17 January 2018 could very well be the next higher low (HL) point within this uptrend. The current setup is still a bullish bias. Target wise, expect Bitcoin to reverse back into the prior uptrend to retest the $16,500 resistance area followed by $20,000 psychological round number.
Important Information
This report is prepared and/or distributed by Phillip Securities Research Pte Ltd ("Phillip Securities Research"), which is a holder of a financial adviser’s licence under the Financial Advisers Act, Chapter 110 in Singapore.
By receiving or reading this report, you agree to be bound by the terms and limitations set out below. Any failure to comply with these terms and limitations may constitute a violation of law. This report has been provided to you for personal use only and shall not be reproduced, distributed or published by you in whole or in part, for any purpose. If you have received this report by mistake, please delete or destroy it, and notify the sender immediately.
The information and any analysis, forecasts, projections, expectations and opinions (collectively, the “Research”) contained in this report has been obtained from public sources which Phillip Securities Research believes to be reliable. However, Phillip Securities Research does not make any representation or warranty, express or implied that such information or Research is accurate, complete or appropriate or should be relied upon as such. Any such information or Research contained in this report is subject to change, and Phillip Securities Research shall not have any responsibility to maintain or update the information or Research made available or to supply any corrections, updates or releases in connection therewith.
Any opinions, forecasts, assumptions, estimates, valuations and prices contained in this report are as of the date indicated and are subject to change at any time without prior notice. Past performance of any product referred to in this report is not indicative of future results.
This report does not constitute, and should not be used as a substitute for, tax, legal or investment advice. This report should not be relied upon exclusively or as authoritative, without further being subject to the recipient’s own independent verification and exercise of judgment. The fact that this report has been made available constitutes neither a recommendation to enter into a particular transaction, nor a representation that any product described in this report is suitable or appropriate for the recipient. Recipients should be aware that many of the products, which may be described in this report involve significant risks and may not be suitable for all investors, and that any decision to enter into transactions involving such products should not be made, unless all such risks are understood and an independent determination has been made that such transactions would be appropriate. Any discussion of the risks contained herein with respect to any product should not be considered to be a disclosure of all risks or a complete discussion of such risks.
Nothing in this report shall be construed to be an offer or solicitation for the purchase or sale of any product. Any decision to purchase any product mentioned in this report should take into account existing public information, including any registered prospectus in respect of such product.
Phillip Securities Research, or persons associated with or connected to Phillip Securities Research, including but not limited to its officers, directors, employees or persons involved in the issuance of this report, may provide an array of financial services to a large number of corporations in Singapore and worldwide, including but not limited to commercial / investment banking activities (including sponsorship, financial advisory or underwriting activities), brokerage or securities trading activities. Phillip Securities Research, or persons associated with or connected to Phillip Securities Research, including but not limited to its officers, directors, employees or persons involved in the issuance of this report, may have participated in or invested in transactions with the issuer(s) of the securities mentioned in this report, and may have performed services for or solicited business from such issuers. Additionally, Phillip Securities Research, or persons associated with or connected to Phillip Securities Research, including but not limited to its officers, directors, employees or persons involved in the issuance of this report, may have provided advice or investment services to such companies and investments or related investments, as may be mentioned in this report.
Phillip Securities Research or persons associated with or connected to Phillip Securities Research, including but not limited to its officers, directors, employees or persons involved in the issuance of this report may, from time to time maintain a long or short position in securities referred to herein, or in related futures or options, purchase or sell, make a market in, or engage in any other transaction involving such securities, and earn brokerage or other compensation in respect of the foregoing. Investments will be denominated in various currencies including US dollars and Euro and thus will be subject to any fluctuation in exchange rates between US dollars and Euro or foreign currencies and the currency of your own jurisdiction. Such fluctuations may have an adverse effect on the value, price or income return of the investment.
To the extent permitted by law, Phillip Securities Research, or persons associated with or connected to Phillip Securities Research, including but not limited to its officers, directors, employees or persons involved in the issuance of this report, may at any time engage in any of the above activities as set out above or otherwise hold an interest, whether material or not, in respect of companies and investments or related investments, which may be mentioned in this report. Accordingly, information may be available to Phillip Securities Research, or persons associated with or connected to Phillip Securities Research, including but not limited to its officers, directors, employees or persons involved in the issuance of this report, which is not reflected in this report, and Phillip Securities Research, or persons associated with or connected to Phillip Securities Research, including but not limited to its officers, directors, employees or persons involved in the issuance of this report, may, to the extent permitted by law, have acted upon or used the information prior to or immediately following its publication. Phillip Securities Research, or persons associated with or connected to Phillip Securities Research, including but not limited its officers, directors, employees or persons involved in the issuance of this report, may have issued other material that is inconsistent with, or reach different conclusions from, the contents of this report.
The information, tools and material presented herein are not directed, intended for distribution to or use by, any person or entity in any jurisdiction or country where such distribution, publication, availability or use would be contrary to the applicable law or regulation or which would subject Phillip Securities Research to any registration or licensing or other requirement, or penalty for contravention of such requirements within such jurisdiction.
This report is intended for general circulation only and does not take into account the specific investment objectives, financial situation or particular needs of any particular person. The products mentioned in this report may not be suitable for all investors and a person receiving or reading this report should seek advice from a professional and financial adviser regarding the legal, business, financial, tax and other aspects including the suitability of such products, taking into account the specific investment objectives, financial situation or particular needs of that person, before making a commitment to invest in any of such products.
This report is not intended for distribution, publication to or use by any person in any jurisdiction outside of Singapore or any other jurisdiction as Phillip Securities Research may determine in its absolute discretion.
IMPORTANT DISCLOSURES FOR INCLUDED RESEARCH ANALYSES OR REPORTS OF FOREIGN RESEARCH HOUSE
Where the report contains research analyses or reports from a foreign research house, please note:

Jeremy specialises in Technical Analysis and has 10 years of experience in studying price action. His areas of expertise include intermarket analysis on the equities, currencies, commodities and bonds market.
He is also a regular columnist on The Business Times - every Monday ChartPoint column.
He graduated with a Bachelor of Science in Banking and Finance from University of London.
