
Astrea V is the second PE bond opened to retail investors. Launched by Azalea Asset Management, Temasek’s wholly-owned subsidiary with a Private Equity (PE) focus, this issue comes one year after the launch of Astrea IV, the first retail PE bond.
Structure of the Note
Astrea V offers three classes of bonds – Class A-1 is the retail tranche (minimum investment amount is $2,000, in increments of $1,000), while Class A-2 and Class B are for Accredited Investors (par value of US$200,000). Total bond issuance of US$600m has a LTV ratio of 45.3% and is secured by cash flows from investments in 38 PE Funds with 862 investee companies. US$180m of the Class A-1 tranche will be available to retail investors for subscription through ATMs.
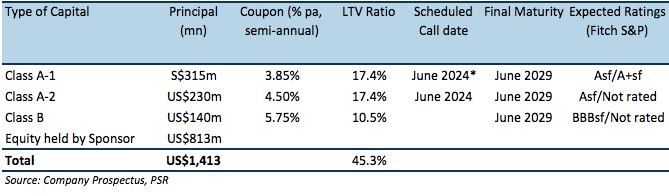
*Bonus Redemption Premium, up to 0.5% of principal upon redemption if the Performance Threshold is met on or before Class A-1 Scheduled Call Date. Coupon step-up by 1.0% p.a. if not redeemed in 2024.
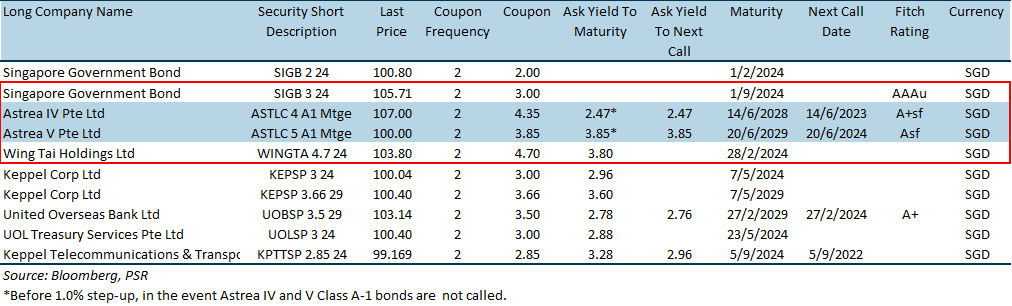
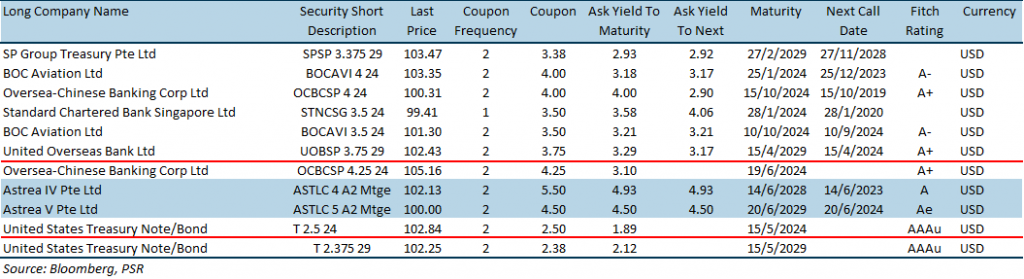
Astrea V’s direct comparable is Astrea IV, the first retail bond. Figure 1 summarises existing bonds and their yield. Clause 8 requires cash to be reserved in the Reserves Accounts for redemption of Class A-1 bonds on their Scheduled Called Date. As Class A-1 bonds are very likely to be called in 2024, we have included bonds that have similar call or maturity dates.
Figure 1: Bond comparison table
Historical Astrea Issuances
Astrea III PE bond for Acceredited Investors was issued in June 2016. As of their fifth distribution date, 8 January 2019, the cash received by the Sponsor exceeded the Bonus Redemption Threshold (Performance Threshold equivalent for Astrea V). As such, bondholders are entitled the Bonus Redemption Premium should the bonds be called (July 2019).
Astrea IV, the first retail PE bond made its first distribution payment in December 2018. During the distrubution peroid, liquidity facilities were not drawn on and scheduled payments for the period to the Reserves Accounts were made in full.
Quality of Underlying Portfolio
Cash flows are backed by a portfolio consisting of 38 PE funds with 862 investee companies. The transaction portfolio has a Net Asset Value (NAV) of US$1,324.4m and total exposure of US$1,539.4m, enlarged by Undrawn Capital Commitments of US$215.0m. Undrawn Capital Commitments refers to the unfunded capital committed to fund the operational and/or expansion needs of the investee companies. PE cash flows follow a J-Curve pattern in which they experience negative cash flows in the early years due to capital being drawn down for investmnets, and positive cash flow in later years (usually 5 years) when divestments are made (figure 2). Due to the nature of cash flows, the portfolio has been constructed with funds with vintages ranging 3 to 8 years. The portfolio has a weighted average vintage of c.5.4 years and is diversified by fund strategy, geography and industry (figure 3 and 5).
The portfolio contains 81% buyout funds and 19% growth funds. Funds that fall under the buyout category are typically established companies with a an operating track record and while growth equity funds are companies that are still in their rapid expansion phase. Apart form better performance by buyout and growth strategy funds (figure 4), this asset allocation provides the cash flow required to match the periodic interest and principal repayment and the due to the higher composition of mature and stable companies that are likely to be in the positive cash flow generating stage.
Figure 2: Private Equity J-Curve
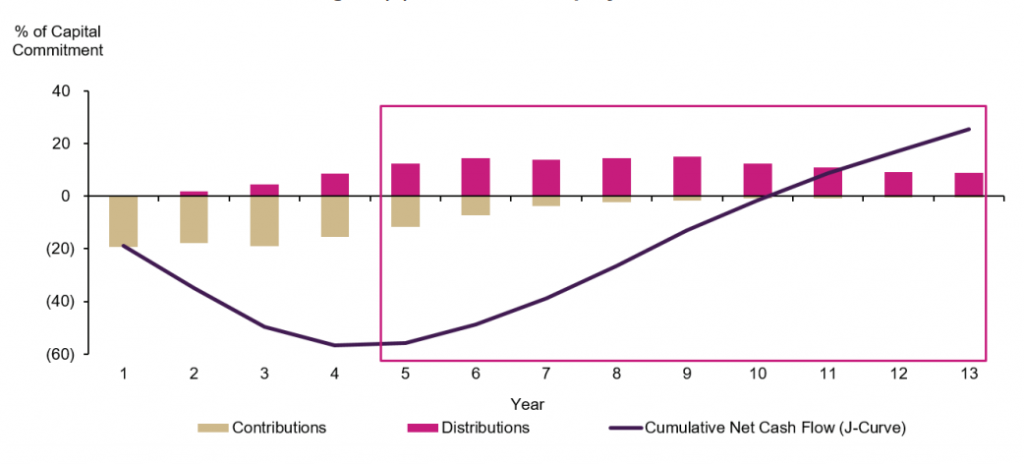
Figure 3: Age of Underlying Funds
Figure 4: Median Net IRR by Strategy
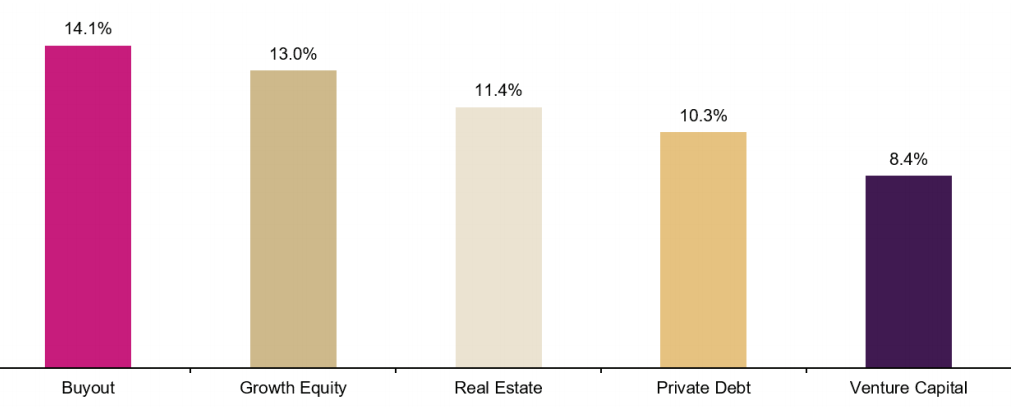
Figure 5: Portfolio Sector Breakdown
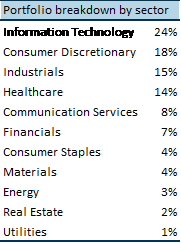
Figure 6: Private Equity Capital Quarterly Index Return versus S&P 500 (rebased = 100)
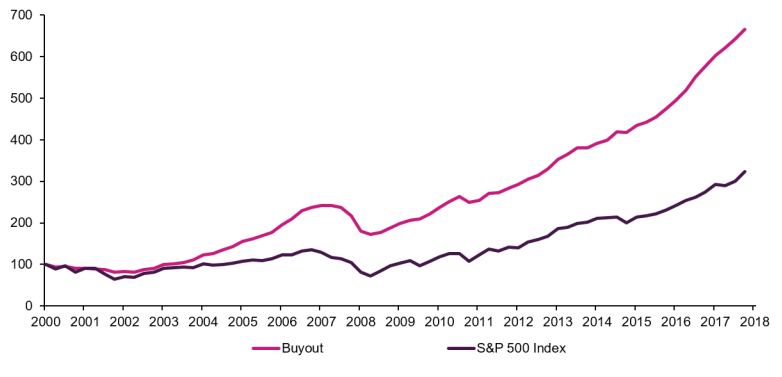
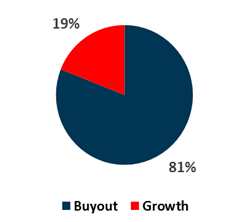
Figure 7: Portfolio Breakdown by Strategy
Cash flow, NAV, Capital Drawdowns, and Distributions
NAV of the portfolio will fluctuate over the life of the bond. NAV is increased by the drawn down of Committed Capital by invested companies (additional capital injected) and reduced by distributions (return in capital) and disposal of invested companies.
Cash inflows are generated mainly through the liquidation of or exit from investments by the PE Funds. After fulfilling capital calls, remaining cash flow will flow through the Priority of Payments (Clause 1 – 13).
In the event of any disposal of funds, Clause 7 ensures that proceeds from such sale flow to the Reserves Accounts and repayment of Class B.
Structural Safeguards
Reserves Accounts for Class A-1 and A-2 bonds (Clause 8)
After operational expenses and interest payments have been made in each distribution period (Clause 1 – 6), excess cash balances will be channeled into the Reserves Accounts for redemption of all Class A-1 and Class A- 2 Bonds on their Scheduled Call dates. The progressive build-up of capital in the Reserves Accounts provides visibility to the cash flows for bond principal repayment in 2024.
The Reserve Amount to be paid into the Reserves Account at every semi-annual distribution date (until Scheduled Call Date) is US$46.7m. Shortfalls to the Reserves Accounts (Unpaid Reserve Amount) will be carried over to the subsequent Distribution Dates. The Reserves Account Cap of US$467mn is sufficient to redeem all Class A-1 and A-2 bonds.
Maximum Loan-to-Value (LTV) Ratio of 50% (Clause 10)
The maximum LTV of 50% ensures that the debt is over collateralised. Should LTV breach the threshold, 100% of the remaining cash flow after Clause 1-9 are satisfied will flow to the Reserves Accounts until the Account Cap is met. Remaining cash flows will be used to redeem the outstanding Class B bonds (lowering the debt liability).
Credit Facility
Credit Facility (CF) not exceeding US$300m is available to fund operational needs and interest payment on bonds (Clause 1 – 6), or any shortfall in relation to Capital Calls. The CF comprises 2 parts, A and B, the sum of which should not exceed US$300m.
Part A is structured to step down as the bonds mature. The step-down schedule for part A is as follows:
Year 1 – 3: US$130m
Year 3 – 6: US$100m
Year 6 – 10: US$40m
Part B will be pegged to 50% of the outstanding Unfunded Capital commitment. The Unfunded Capital commitment will reduce as PE Funds call on capital.
Sponsor Sharing
If and after the Performance Threshold is met, instead of the Sponsor retaining all the cash flow remaining after payment of Clause 1 – 12, 50% of such cash flow is allocated to the Reserves Accounts (until the Reserves Accounts Cap is met) to enable a faster build-up of reserves for redeeming the Class A-1 Bonds on their Scheduled Call Date.
Performance Threshold and Bonus Payment on Scheduled Call Date
Once the Sponsor receives 50% of the total equity injected, c.US$406.6m (the Performance Threshold), Class A-1 and A-2 bonds are eligible to a bonus payment of 0.5% of principal when bonds are redeemed on the Scheduled Call Date.
Risks
As cash flows are generated mainly through the liquidation of or exit from investments by the PE Funds, and NAV is a reported metric implicit of the value of investments that cash flows are derived from, we find that risks relating to asset value and realization of cash flows to be most pertinent.
No certainty on the amount or timing of distributions
PE investments do not generate a determinable and scheduled stream of income, and the level of distribution is uncertain. This will affect the cash flows generated and needed to pay for incurred expenses. However, Credit Facilities in place to meet shortfalls hence mitigating the uncertainty of PE cash flows.
Adverse changes in macroeconomic or market conditions could result in falling PE valuation and/or reduced deal activity
Entry and exit valuations of PE investments have historically shown a high correlation to the public market valuations. Liquidation of Investee Companies during periods of declining asset valuation or deal activities may result in less attractive valuations compared to when normal or buoyant market prevail.
Illiquid nature of PE funds and lack of secondary market
PE Fund Portfolios typically have restriction that prohibit Asset-Owning Companies from encumbering, assigning, pledging, selling, exchanging or otherwise transferring or withdrawing any of their Fund Investments without the consent of the relevant GPs.
Additionally, there may be no secondary market for many or all of the Fund Investments, and any such markets, to the extent they exist, are likely to be highly illiquid.
Calculation of fund NAV may not be reliable
PE Funds typically do not have an active trading market. There is no single, uniform technique applied to the valuations reported by the different GPs because each GP performs its own valuation. As such, NAVs reported by the GPs may reflect the subjective determination by the GPs.
Reliance on General Partners (GPs)
The performance of the PE Funds, as well as the identification, completion and exit of PE investments is highly dependent on the skills and expertise of the GPs.
Figure 8: Astrea V Transaction Cash Flow and Priority of Payments
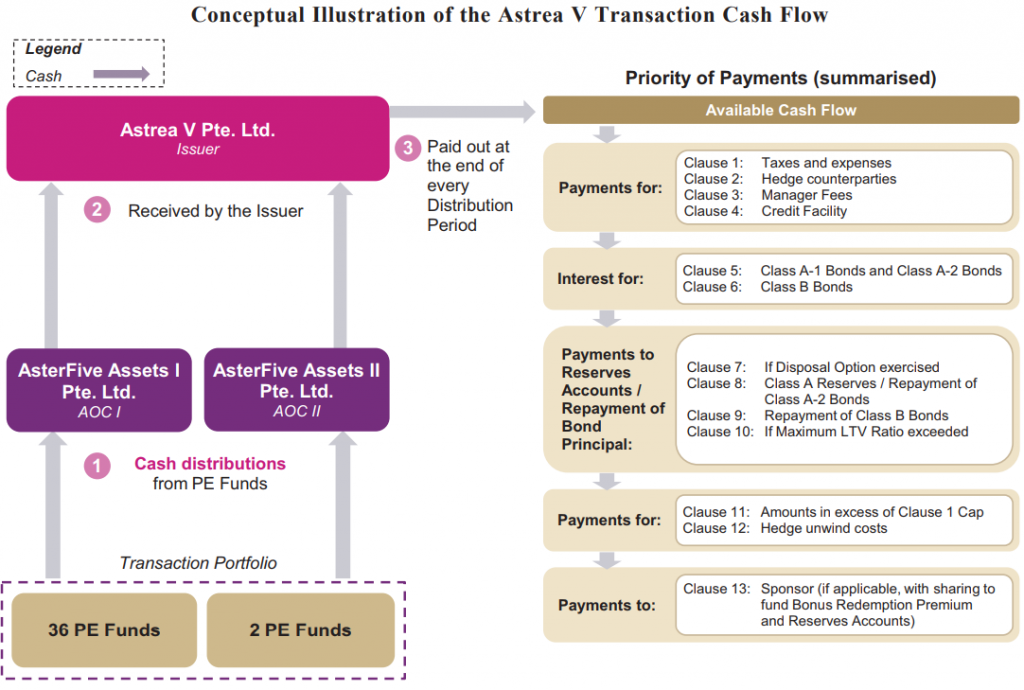
Figure 9: Illustration of Priority of payments

Figure 10: Comparables for Astrea V Class A-2 Bond for Accredited Investors
Important Information
This report is prepared and/or distributed by Phillip Securities Research Pte Ltd ("Phillip Securities Research"), which is a holder of a financial adviser’s licence under the Financial Advisers Act, Chapter 110 in Singapore.
By receiving or reading this report, you agree to be bound by the terms and limitations set out below. Any failure to comply with these terms and limitations may constitute a violation of law. This report has been provided to you for personal use only and shall not be reproduced, distributed or published by you in whole or in part, for any purpose. If you have received this report by mistake, please delete or destroy it, and notify the sender immediately.
The information and any analysis, forecasts, projections, expectations and opinions (collectively, the “Research”) contained in this report has been obtained from public sources which Phillip Securities Research believes to be reliable. However, Phillip Securities Research does not make any representation or warranty, express or implied that such information or Research is accurate, complete or appropriate or should be relied upon as such. Any such information or Research contained in this report is subject to change, and Phillip Securities Research shall not have any responsibility to maintain or update the information or Research made available or to supply any corrections, updates or releases in connection therewith.
Any opinions, forecasts, assumptions, estimates, valuations and prices contained in this report are as of the date indicated and are subject to change at any time without prior notice. Past performance of any product referred to in this report is not indicative of future results.
This report does not constitute, and should not be used as a substitute for, tax, legal or investment advice. This report should not be relied upon exclusively or as authoritative, without further being subject to the recipient’s own independent verification and exercise of judgment. The fact that this report has been made available constitutes neither a recommendation to enter into a particular transaction, nor a representation that any product described in this report is suitable or appropriate for the recipient. Recipients should be aware that many of the products, which may be described in this report involve significant risks and may not be suitable for all investors, and that any decision to enter into transactions involving such products should not be made, unless all such risks are understood and an independent determination has been made that such transactions would be appropriate. Any discussion of the risks contained herein with respect to any product should not be considered to be a disclosure of all risks or a complete discussion of such risks.
Nothing in this report shall be construed to be an offer or solicitation for the purchase or sale of any product. Any decision to purchase any product mentioned in this report should take into account existing public information, including any registered prospectus in respect of such product.
Phillip Securities Research, or persons associated with or connected to Phillip Securities Research, including but not limited to its officers, directors, employees or persons involved in the issuance of this report, may provide an array of financial services to a large number of corporations in Singapore and worldwide, including but not limited to commercial / investment banking activities (including sponsorship, financial advisory or underwriting activities), brokerage or securities trading activities. Phillip Securities Research, or persons associated with or connected to Phillip Securities Research, including but not limited to its officers, directors, employees or persons involved in the issuance of this report, may have participated in or invested in transactions with the issuer(s) of the securities mentioned in this report, and may have performed services for or solicited business from such issuers. Additionally, Phillip Securities Research, or persons associated with or connected to Phillip Securities Research, including but not limited to its officers, directors, employees or persons involved in the issuance of this report, may have provided advice or investment services to such companies and investments or related investments, as may be mentioned in this report.
Phillip Securities Research or persons associated with or connected to Phillip Securities Research, including but not limited to its officers, directors, employees or persons involved in the issuance of this report may, from time to time maintain a long or short position in securities referred to herein, or in related futures or options, purchase or sell, make a market in, or engage in any other transaction involving such securities, and earn brokerage or other compensation in respect of the foregoing. Investments will be denominated in various currencies including US dollars and Euro and thus will be subject to any fluctuation in exchange rates between US dollars and Euro or foreign currencies and the currency of your own jurisdiction. Such fluctuations may have an adverse effect on the value, price or income return of the investment.
To the extent permitted by law, Phillip Securities Research, or persons associated with or connected to Phillip Securities Research, including but not limited to its officers, directors, employees or persons involved in the issuance of this report, may at any time engage in any of the above activities as set out above or otherwise hold an interest, whether material or not, in respect of companies and investments or related investments, which may be mentioned in this report. Accordingly, information may be available to Phillip Securities Research, or persons associated with or connected to Phillip Securities Research, including but not limited to its officers, directors, employees or persons involved in the issuance of this report, which is not reflected in this report, and Phillip Securities Research, or persons associated with or connected to Phillip Securities Research, including but not limited to its officers, directors, employees or persons involved in the issuance of this report, may, to the extent permitted by law, have acted upon or used the information prior to or immediately following its publication. Phillip Securities Research, or persons associated with or connected to Phillip Securities Research, including but not limited its officers, directors, employees or persons involved in the issuance of this report, may have issued other material that is inconsistent with, or reach different conclusions from, the contents of this report.
The information, tools and material presented herein are not directed, intended for distribution to or use by, any person or entity in any jurisdiction or country where such distribution, publication, availability or use would be contrary to the applicable law or regulation or which would subject Phillip Securities Research to any registration or licensing or other requirement, or penalty for contravention of such requirements within such jurisdiction.
This report is intended for general circulation only and does not take into account the specific investment objectives, financial situation or particular needs of any particular person. The products mentioned in this report may not be suitable for all investors and a person receiving or reading this report should seek advice from a professional and financial adviser regarding the legal, business, financial, tax and other aspects including the suitability of such products, taking into account the specific investment objectives, financial situation or particular needs of that person, before making a commitment to invest in any of such products.
This report is not intended for distribution, publication to or use by any person in any jurisdiction outside of Singapore or any other jurisdiction as Phillip Securities Research may determine in its absolute discretion.
IMPORTANT DISCLOSURES FOR INCLUDED RESEARCH ANALYSES OR REPORTS OF FOREIGN RESEARCH HOUSE
Where the report contains research analyses or reports from a foreign research house, please note:
