Company Background
Alphabet Inc. operates as a holding company with subsidiaries providing web-based search (Google), advertisements, maps, software applications, mobile operating systems (Android), consumer content (YouTube), enterprise solutions, commerce, and hardware products.
Investment Merits
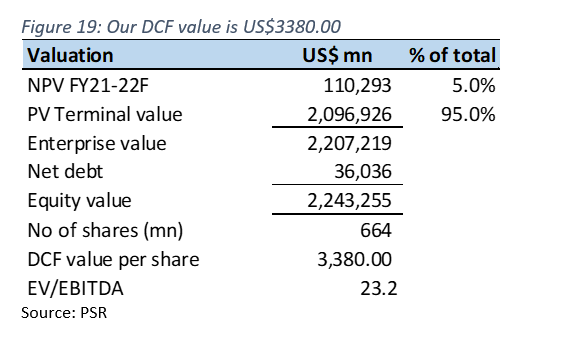
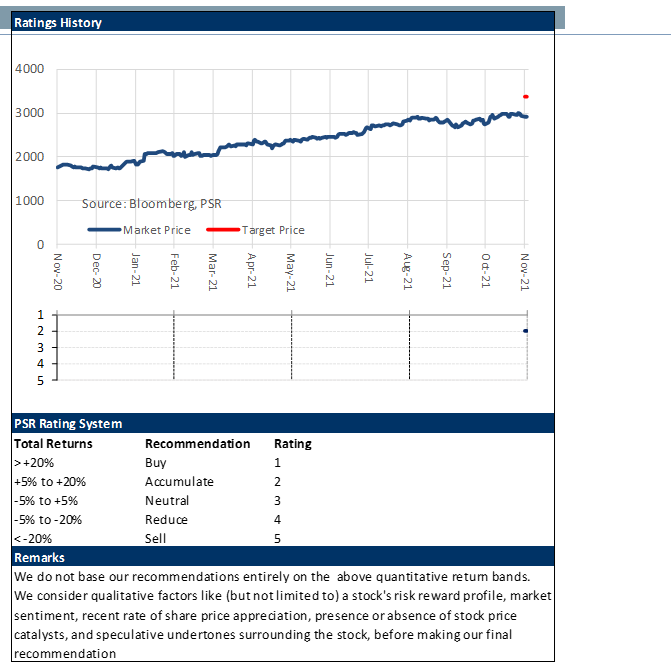
We Initiate coverage with an ACCUMULATE rating and a target price of US$3380.00 based on DCF valuation, with a WACC of 6.9% and terminal growth of 4%.
REVENUE
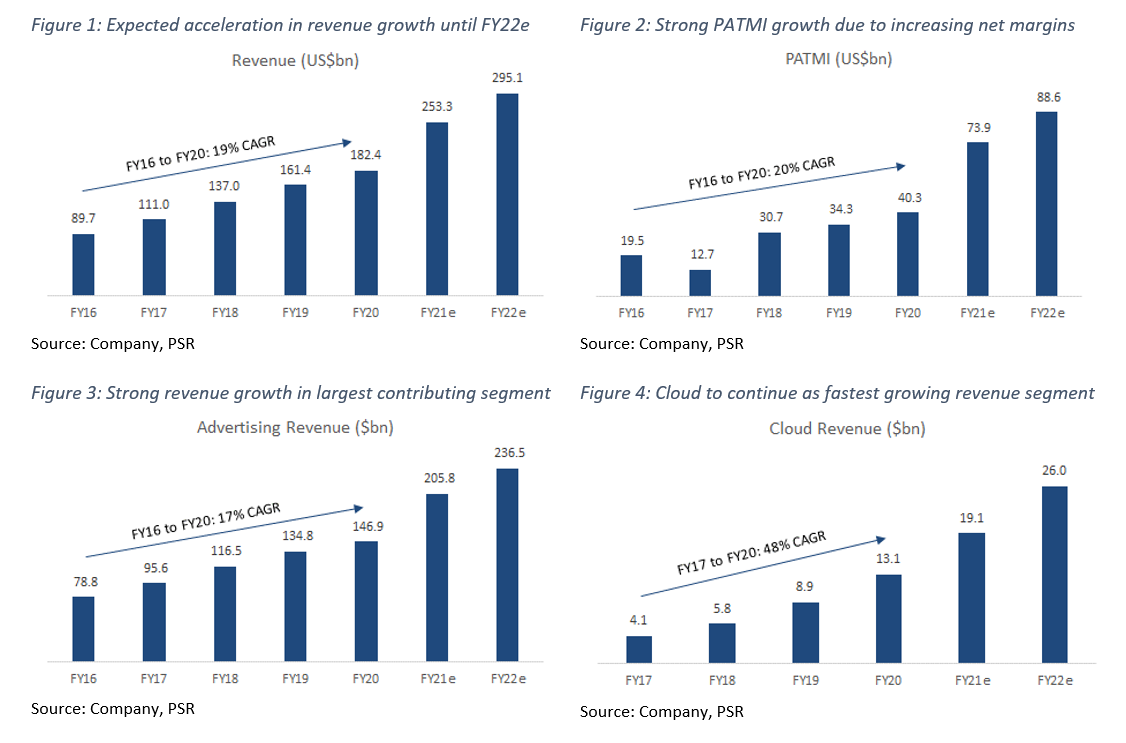
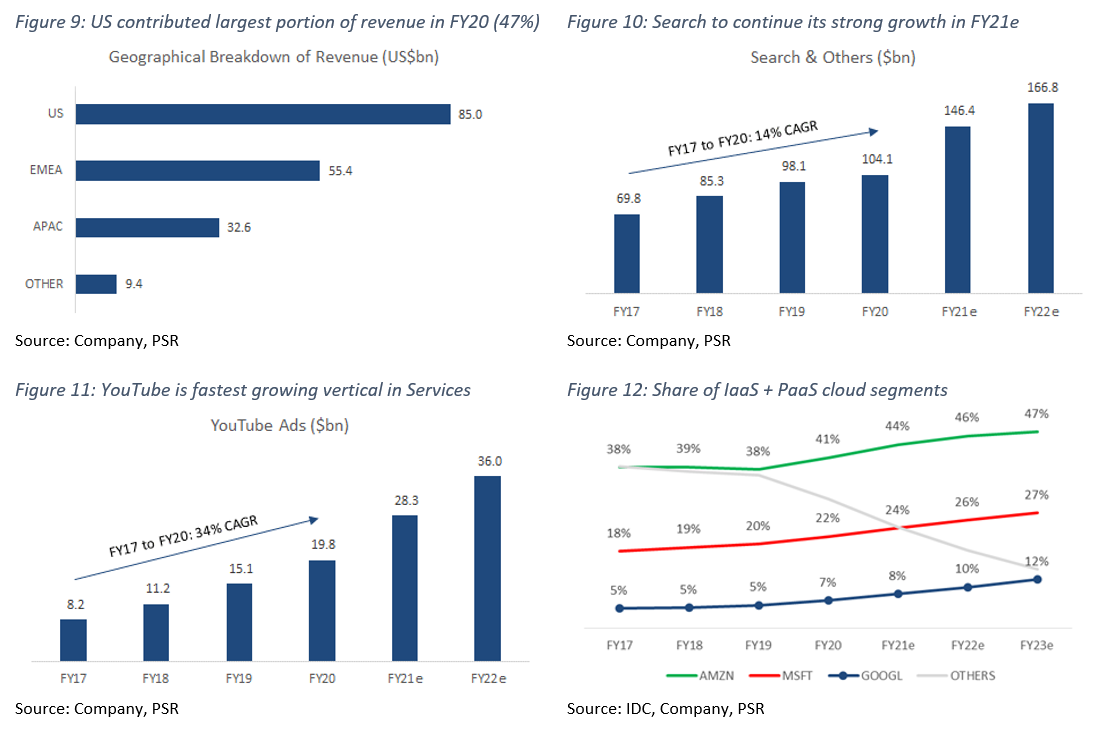
GOOGL posted US$182bn in revenue for FY20 – growing 13% YoY, with 92.5% of its total revenue coming from its Google Services segment, 7.2% from its Cloud segment, and the remaining 0.3% from Other Bets (Figure 5). In terms of revenue breakdown by geography, 47% of revenue comes from the US, 30% from EMEA, 18% from APAC, and 5% from other regions (Figure 9). Gross Profit for FY20 was US$98bn, with gross margins of 53.6%. PATMI was US$40bn, with net margins of 22.1%.
Google Services: This segment can be divided into two portions, Advertising (87%), and Other Services (13%). As the name suggests, revenue derived from all forms of advertising fall into the first portion, and revenue from in-app purchases, hardware sales, and subscription fees fall into Other Services. Advertising brought in US$147bn in revenue for FY20, with Other Services recording US$22bn in revenue. Advertising can be further broken down into three main components: Google Search, YouTube Ads, and Google Network Members’ Properties.
Google Search is the segment’s main revenue driver, with revenue of US$104bn in FY20 (62% of services revenue, and 57% of total revenue), and includes advertising revenue generated on Google search properties, as well as revenue from other products like Gmail, Maps, and Google Play (Figure 10).
YouTube brought in US$20bn of revenue in FY20, and mainly consists of ad revenue generated on YouTube properties. It has been the fastest growing vertical within Google Services for the last 3 years, with revenue increasing at a 3-year CAGR of 34% (Figure 11), compared to overall segment growth of 17%. The platform has seen an increase in adoption rate, both from content creators, as well as users, with more than 2 million content creators, an estimated 2
billion monthly users, and over a billion hours of video watched daily. This strong growth in adoption has been a result of GOOGL’s increasing efforts to commercialise YouTube through digital ad placements, which are placed on every video content on the platform. These ad placements incentivize content creators – who get paid with each additional ad-click on their videos, to generate more content, which in turn attracts more users onto the platform. We expect YouTube revenue to continue its high growth rate, supported by strength in user reach and advertising effectiveness.
Google Network Members’ Properties recorded revenues of US$23bn for FY20, and they are mainly derived from revenue generated from Google Ad Manager, AdSense, AdMob. The products in this component are generally geared towards helping publishers create, manage, and track their direct ad response campaigns.
Revenue from the entire Google Services segment was US$168bn for FY20, increasing 11% YoY, driven mainly by retail advertisers as global spending continues to increase.
Google Cloud: This segment includes Google’s infrastructure and data analytics platforms, as well as other enterprise solutions, and are split into two main properties: Google Cloud Platform (GCP), and Google Workspace – formerly known as G Suite. Google Cloud recorded revenue of US$13bn in FY20, and is currently the fastest growing segment in the company, with a YoY growth rate of 46%. The company focuses on building products in the IaaS, PaaS, and Cyber Security space.
Other Bets: This segment contributes the smallest portion to total revenue, at only US$0.7bn in FY20. Revenue in this segment is primarily derived through licensing and R&D services.
Growth Trajectory: We see strong growth potential in a couple of segments and verticals. In terms of digital advertising, we expect YouTube Ads to continue being the fastest growing vertical in the Google Services segment, with revenues projected to grow 82% and hit US$36bn by the end of FY22e. This comes as we see continued adoption of smartphones and streaming services acting as tailwinds for increasing spend in video advertising moving forward.
In terms of cloud opportunities, we continue to see Google Cloud as an undervalued opportunity for GOOGL moving forward. Google Cloud has firmly positioned itself in 3rd place in the global cloud market, and is growing as fast, or faster than its main competitors Microsoft Azure and Amazon Web Services (figure 12). Google Cloud has also been the company’s fastest growing segment for the last 3 years, growing at a 3-yr CAGR of 48%. We expect this to continue moving forward, as the company rides tailwinds from the overall cloud industry which is still in its early stage of growth.
Revenue Growth: We expect total revenue growth for FY21e to hit US$253bn, which would represent a 39% YoY growth. In terms of revenue growth by segment, we forecast Google Services to increase 38% YoY (US$233bn), Google Cloud to jump 46% YoY (US$19bn), and Other Bets to rise 17% (US$0.8bn).
Other Income: GOOGL recorded other income of almost US$7bn for FY20, increasing 27% YoY, representing almost 4% of total revenue. This was mainly due to net interest income of US$1.7bn, and a US$5.6bn net gain on equity securities.
RULE OF 40
The “Rule of 40” was first introduced as a benchmark to measure the balance between growth and profitability of SaaS companies, taking into account both revenue growth, as well as profitability (Revenue Growth + EBITDA Margins), with the addition of both metrics needing to exceed the 40% threshold. We have modified this slightly by averaging revenue growth over a 3-year period compared to just a single period growth rate. Adding together GOOGL’s 3-year average revenue growth of 18.1% and its EBITDA margin of 30.1%, the total of 48.2% is > than our required threshold of 40% (Figure 8).
EXPENSES
The cost of sales grew 18% in FY20 to US$85bn, largely due to an increase in content acquisition for YouTube, as well as increasing Traffic Acquisition Costs paid to distribution partners. Operating expenses include research and development (15% of revenue), sales and marketing (10%), and general and administrative (6%). Total Operating Expense as a percentage of revenue has been reducing over the last 4 years, from 35% in FY16 to 31% in FY20, and we expect this trend to continue as the company grows its high operating leverage businesses.
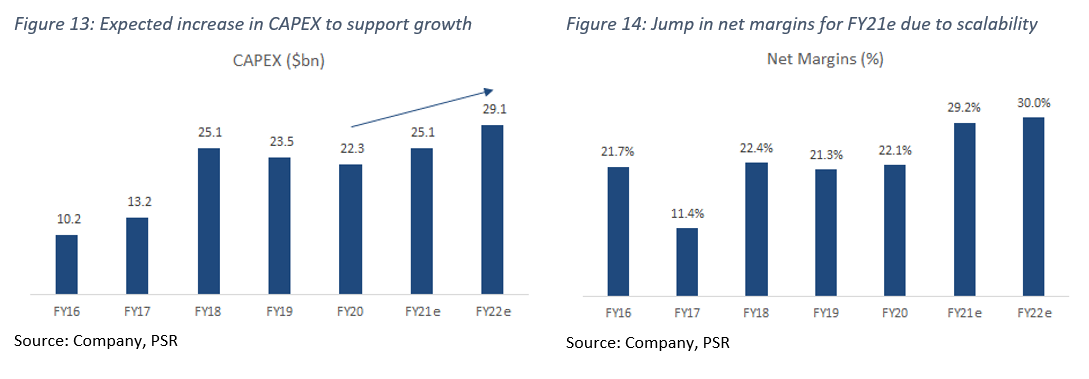
CAPEX for FY20 was US$23.3bn (12% of revenue), a slight decrease from US$23.5 in the previous year. We expect CAPEX to increase moving forward, in line with GOOGL’s guidance about bolstering its IT infrastructure to better support its services (Figure 13).
MARGINS
GOOGL has seen a steady decline in gross margins over the last few years, decreasing from 61% in FY16 to 54% in FY20. This was largely due to the company’s aggressive investments in expanding its Cloud business as they play catch-up with cloud leaders Amazon and Microsoft. However, we do see GOOGL’s gross margins reversing this trend moving forward, as its Cloud business turns the corner on profitability.
Net margins in FY20 were 21%, remaining relatively flat over the last few years. We expect net margins to jump significantly in FY21e to about 29%, based on increases in efficiency and scalability of its high operating leverage businesses (Figure 14).
BALANCE SHEET
Assets: Cash and cash equivalents increased by about US$8bn YoY in FY20, largely due to significant increases in cash flow from operations, partially offset by an increase in purchases of non-marketable securities. Marketable securities increased US$9bn, led by a combination of increasing net purchases, and increases in unrealized gains on securities held. Plant, property and equipment for FY20 was US$85bn, an increase of US$9bn from the previous year, largely due to continued CAPEX spending on IT infrastructure and facilities. The company’s current ratio for FY20 was 3.1.
Liabilities: Current liabilities for FY20 were US$57bn, almost US$12bn more than FY19. This increase was mainly due to a rise in accruals. Non-current liabilities saw a jump of US$11bn in FY20, largely due to a US$10bn issuance of fixed-rate senior unsecured notes. GOOGL’s debt-to-equity ratio remains low at only 0.06.
CASH-FLOW
Free Cash Flow (FCF) in FY20 was US$43bn, a 38% increase from FY19. We expect FCF to continue growing well due to an exponential increase in cash from operations.
BUSINESS MODEL
GOOGL has evolved over time from a company that provides answers to peoples’ questions, into one that now helps resolve these questions. GOOGL’s revenue is driven by 2 main segments categorized under Google Services, and Google Cloud. It’s 3rd segment, Other Bets, include projects with a long term view in mind.
Within the Google Services segment, the products on offer cover almost the entire internet, ranging from services that provide answers to people who seek them — Search, and navigation services – Maps, to on-demand entertainment – YouTube. The strength of this segment is a combination of a heavily diversified products portfolio, and its scalability and reach. Most of the revenue generated from Google Services falls into advertising revenue, which the company generates from selling ad-placements, as well as targeted ad campaigns to advertisers. The segment generated US$55bn in operating income for FY20, an 11% YoY increase.
GOOGL’s other main segment, Google Cloud, has become the company’s fastest growing segment in recent times, growing at a 3-year CAGR of 48%, with revenue from this segment as a percentage of total revenue almost doubling from 3.7% in FY17, to 7.2% in FY20. Products within this segment are geared towards enterprise solutions, with a focus on IaaS, PaaS, and Cyber Security. The two main components are GCP and Google Workspace – formerly known as G Suite, focusing on producing collaborative tools that leverage Artificial Intelligence and Machine Learning technologies to improve business efficiency. Revenue for this segment is primarily generated through subscription fees received for the use of its services.
When it comes to data privacy, GOOGL has also taken several initiatives in an effort to support its users, while preserving strength in its core businesses. The company has promised to remove 3rd party cookies on Chrome by late FY23e, while also refusing to implement alternative tracking methods. We believe GOOGL also has the capacity to collect sufficient first-party data through its multiple touch points to maintain effective advertising campaigns, which should position them well in an environment with stricter data privacy standards.
INDUSTRY
Due to the plethora of products covering multiple industries, GOOGL faces competition from other search engines, social media companies, video service providers, cloud providers, tech hardware manufacturers, and a host of competitors in smaller verticals. However, GOOGL is still the industry leader in its two main segments: Digital Advertising, and Cloud Services. It also holds a significant market share for many of its products.
Google Search. Search is by far the most dominant general online search engine, with over 92% market share globally, and 87% domestically in the US. It has high barriers to entry due to the high fixed costs of servers associated with crawling and indexing the entire internet. It is also the default search provider on 87% of desktop computers.
Android. Android is the most dominant mobile operating system in the world, running on roughly 75% of the world’s mobile devices. Even though GOOGL does not monetize Android, it does require mobile phone manufacturers seeking to use Android as an operating system to sign licensing agreements that dictate how certain GOOGL apps have to be pre-installed, and placed in prominent spaces on these devices, extending the visibility of such products from desktop to mobile. In addition, Android provides GOOGL with real-time market data on its users and developers which GOOGL can monetize through its advertising business.
Play Store. Play Store is the primary app store on all Android devices, essentially serving as a sentinel for software distribution on mobile devices. It generates revenue by charging developers commissions of up to 30% on application downloads, as well as in-app purchases.
Chrome. Chrome is the default web browser for all things GOOGL, and has become a global leader in web browsers since its inception in 2008. It is estimated to have about 66% of overall web browser usage globally, partly because it is the default web browser on all Android devices. It also has strong network effects which act as its moat, where web developers are attracted to Chrome because of its large user base, and users are attracted to the browser because of its usability and compatability in running an array of webpages. While GOOGL does not monetize Chrome, the product acts as a gateway for users to other GOOGL products such as Google Search and Google Workspace.
Maps. It is estimated that GOOGL dominates the digital maps market with over 80% market share split between Google Maps and Waze – which it acquired in 2013. It is likely to maintain this dominance moving forward due to the high barriers to entry – high fixed costs for mapping data. GOOGL is in the early stages of monetizing its digital maps products, by selling map advertising to businesses aiming to maximize foot traffic.
YouTube. YouTube is GOOGL’s fastest growing product, and revolves primarily around video entertainment. With more than 2 million content creators, an estimated 2 billion monthly users, and over a billion hours of video watched daily, YouTube is the 2nd most used social media platform globally. Revenue is mainly generated through sales of digital advertising placements to marketers, although it recently introduced a premium subscription service that allows users ad-free videos and music, as well as other premium features. The increasing preference and consumer adoption of short-form and on-demand video services should support growth for this product moving forward.
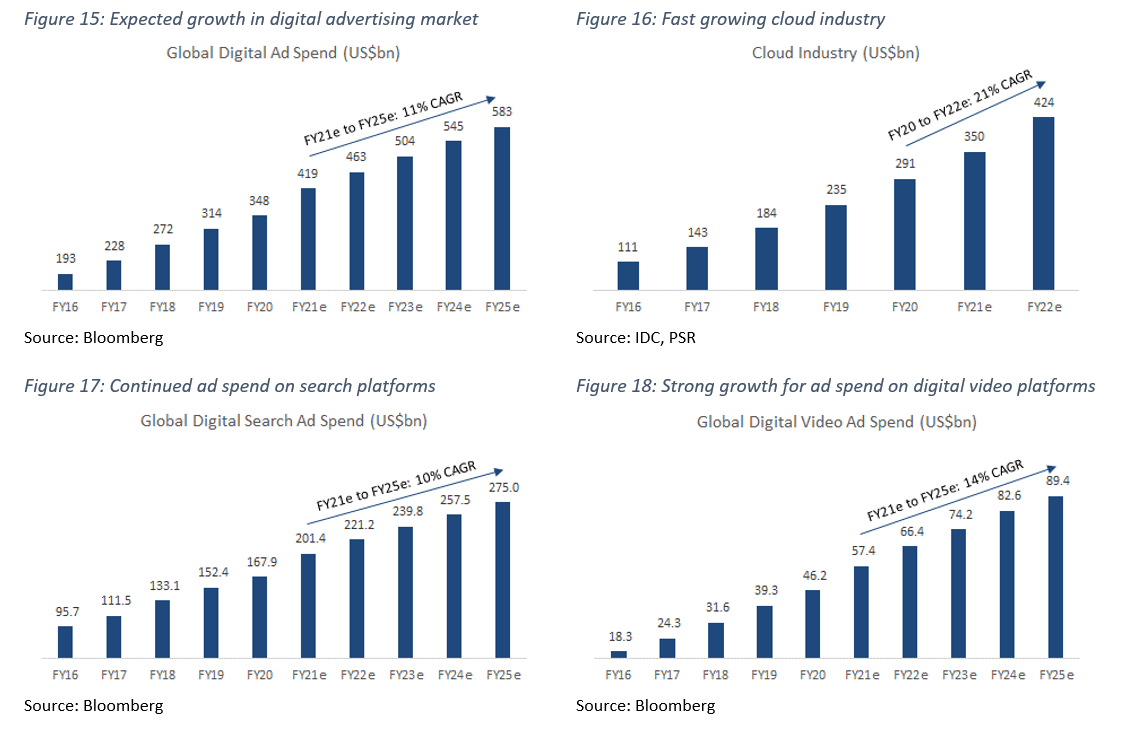
GOOGL has been riding the tailwinds in the digital advertising industry, and we expect this trend to continue moving forward, based on changing consumer behaviour and increased digitalization globally. Worldwide digital advertising spend is expected to continue increasing over the next 4 years at a 11% CAGR (Figure 15), which we believe GOOGL is well positioned to capture as the industry leader. It’s main competitors in this space are Facebook, Twitter, Snapchat, and Amazon.
For Cloud, GOOGL has been outpacing its competitors in terms of growth, with a 3-year CAGR of 48%. Within the IaaS and PaaS sectors, GOOGL is currently in 3rd place with a 7% market share, behind Microsoft’s Azure and Amazon’s AWS, and we expect them to solidify this position with its increasing CAPEX spending on cloud infrastructure. With the overall cloud industry expected to see a 21% CAGR over the next 3 years (Figure 16), we believe there is ample room and tailwinds from the industry to support an expansion of GOOGL’s services and market share in the industry. Competitors in this segment include Amazon, Microsoft and Alibaba.
RISKS
|
VALUATION We initiate coverage on Alphabet Inc. with an ACCUMULATE rating and a price target of US$3380.00. Our valuation is based on DCF, using a 6.9% WACC and 4.0% terminal growth rate.
|
Important Information
This report is prepared and/or distributed by Phillip Securities Research Pte Ltd ("Phillip Securities Research"), which is a holder of a financial adviser’s licence under the Financial Advisers Act, Chapter 110 in Singapore.
By receiving or reading this report, you agree to be bound by the terms and limitations set out below. Any failure to comply with these terms and limitations may constitute a violation of law. This report has been provided to you for personal use only and shall not be reproduced, distributed or published by you in whole or in part, for any purpose. If you have received this report by mistake, please delete or destroy it, and notify the sender immediately.
The information and any analysis, forecasts, projections, expectations and opinions (collectively, the “Research”) contained in this report has been obtained from public sources which Phillip Securities Research believes to be reliable. However, Phillip Securities Research does not make any representation or warranty, express or implied that such information or Research is accurate, complete or appropriate or should be relied upon as such. Any such information or Research contained in this report is subject to change, and Phillip Securities Research shall not have any responsibility to maintain or update the information or Research made available or to supply any corrections, updates or releases in connection therewith.
Any opinions, forecasts, assumptions, estimates, valuations and prices contained in this report are as of the date indicated and are subject to change at any time without prior notice. Past performance of any product referred to in this report is not indicative of future results.
This report does not constitute, and should not be used as a substitute for, tax, legal or investment advice. This report should not be relied upon exclusively or as authoritative, without further being subject to the recipient’s own independent verification and exercise of judgment. The fact that this report has been made available constitutes neither a recommendation to enter into a particular transaction, nor a representation that any product described in this report is suitable or appropriate for the recipient. Recipients should be aware that many of the products, which may be described in this report involve significant risks and may not be suitable for all investors, and that any decision to enter into transactions involving such products should not be made, unless all such risks are understood and an independent determination has been made that such transactions would be appropriate. Any discussion of the risks contained herein with respect to any product should not be considered to be a disclosure of all risks or a complete discussion of such risks.
Nothing in this report shall be construed to be an offer or solicitation for the purchase or sale of any product. Any decision to purchase any product mentioned in this report should take into account existing public information, including any registered prospectus in respect of such product.
Phillip Securities Research, or persons associated with or connected to Phillip Securities Research, including but not limited to its officers, directors, employees or persons involved in the issuance of this report, may provide an array of financial services to a large number of corporations in Singapore and worldwide, including but not limited to commercial / investment banking activities (including sponsorship, financial advisory or underwriting activities), brokerage or securities trading activities. Phillip Securities Research, or persons associated with or connected to Phillip Securities Research, including but not limited to its officers, directors, employees or persons involved in the issuance of this report, may have participated in or invested in transactions with the issuer(s) of the securities mentioned in this report, and may have performed services for or solicited business from such issuers. Additionally, Phillip Securities Research, or persons associated with or connected to Phillip Securities Research, including but not limited to its officers, directors, employees or persons involved in the issuance of this report, may have provided advice or investment services to such companies and investments or related investments, as may be mentioned in this report.
Phillip Securities Research or persons associated with or connected to Phillip Securities Research, including but not limited to its officers, directors, employees or persons involved in the issuance of this report may, from time to time maintain a long or short position in securities referred to herein, or in related futures or options, purchase or sell, make a market in, or engage in any other transaction involving such securities, and earn brokerage or other compensation in respect of the foregoing. Investments will be denominated in various currencies including US dollars and Euro and thus will be subject to any fluctuation in exchange rates between US dollars and Euro or foreign currencies and the currency of your own jurisdiction. Such fluctuations may have an adverse effect on the value, price or income return of the investment.
To the extent permitted by law, Phillip Securities Research, or persons associated with or connected to Phillip Securities Research, including but not limited to its officers, directors, employees or persons involved in the issuance of this report, may at any time engage in any of the above activities as set out above or otherwise hold an interest, whether material or not, in respect of companies and investments or related investments, which may be mentioned in this report. Accordingly, information may be available to Phillip Securities Research, or persons associated with or connected to Phillip Securities Research, including but not limited to its officers, directors, employees or persons involved in the issuance of this report, which is not reflected in this report, and Phillip Securities Research, or persons associated with or connected to Phillip Securities Research, including but not limited to its officers, directors, employees or persons involved in the issuance of this report, may, to the extent permitted by law, have acted upon or used the information prior to or immediately following its publication. Phillip Securities Research, or persons associated with or connected to Phillip Securities Research, including but not limited its officers, directors, employees or persons involved in the issuance of this report, may have issued other material that is inconsistent with, or reach different conclusions from, the contents of this report.
The information, tools and material presented herein are not directed, intended for distribution to or use by, any person or entity in any jurisdiction or country where such distribution, publication, availability or use would be contrary to the applicable law or regulation or which would subject Phillip Securities Research to any registration or licensing or other requirement, or penalty for contravention of such requirements within such jurisdiction.
This report is intended for general circulation only and does not take into account the specific investment objectives, financial situation or particular needs of any particular person. The products mentioned in this report may not be suitable for all investors and a person receiving or reading this report should seek advice from a professional and financial adviser regarding the legal, business, financial, tax and other aspects including the suitability of such products, taking into account the specific investment objectives, financial situation or particular needs of that person, before making a commitment to invest in any of such products.
This report is not intended for distribution, publication to or use by any person in any jurisdiction outside of Singapore or any other jurisdiction as Phillip Securities Research may determine in its absolute discretion.
IMPORTANT DISCLOSURES FOR INCLUDED RESEARCH ANALYSES OR REPORTS OF FOREIGN RESEARCH HOUSE
Where the report contains research analyses or reports from a foreign research house, please note:

Jonathan covers the US technology sector focusing on internet companies. Formerly a national and professional athlete, he graduated from the University of Oregon with a Bachelor’s Degree in Social Sciences.
