
This article was published in Business Times’ column “Chart Point” on 4 December 2017.
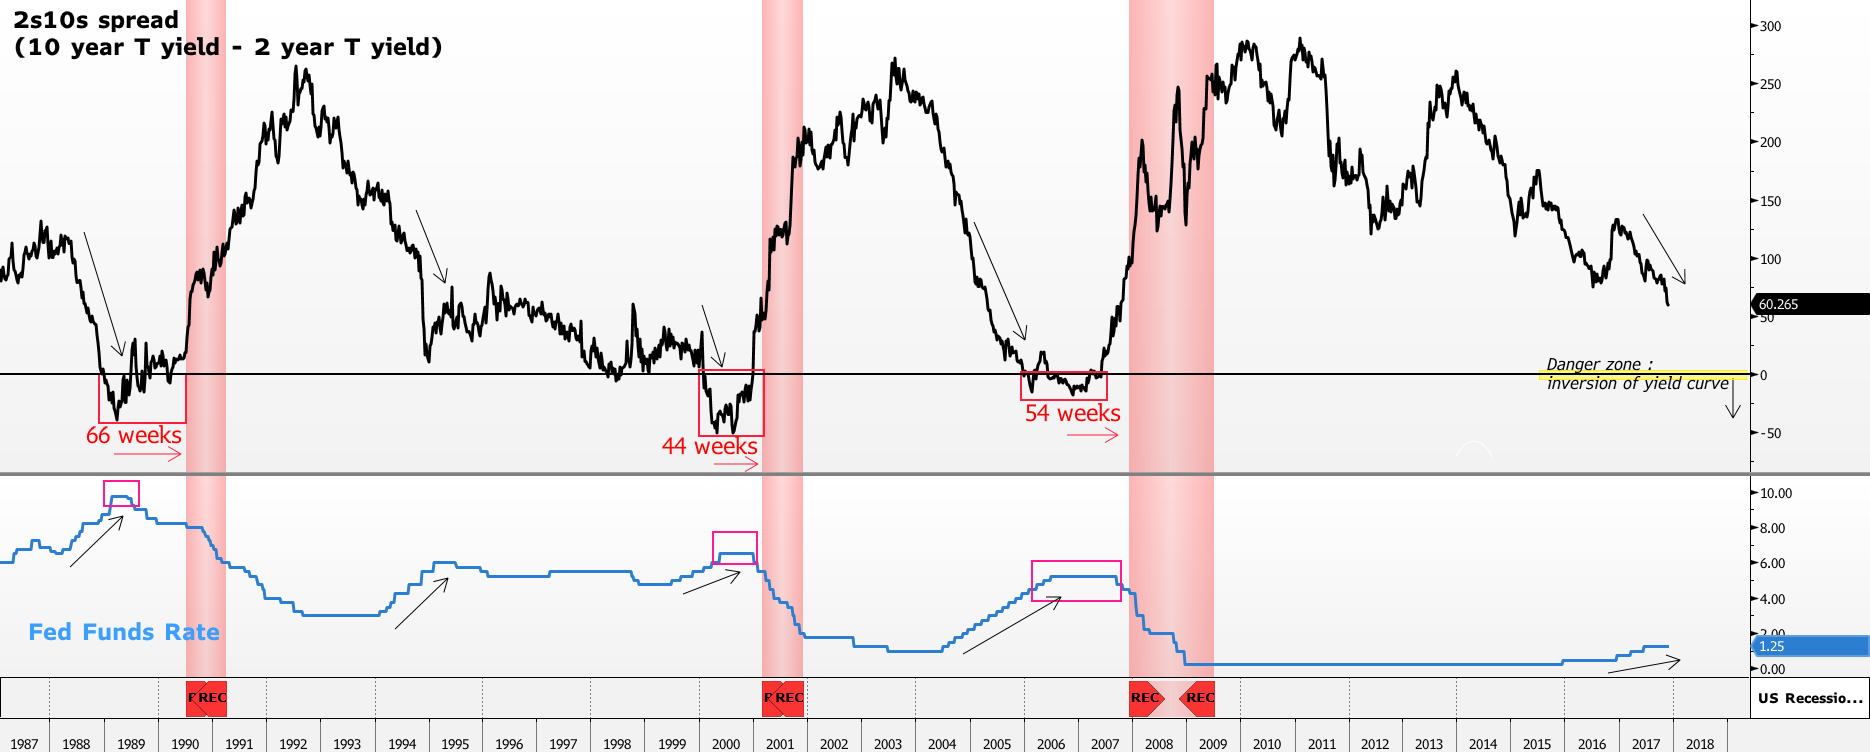
2s10s spread vs Fed Funds Rate chart Source: Bloomberg, PSR
Note a) Red Vertical highlighted area demarcates the US recessionary period; b) Up arrow depicts the start of the rate hike cycle; c) Highlighted box shows the period where the 2s10s spread is inverted leading to the halting of the rate hike cycle
The 2s10s spread shows the difference between the 10-year treasury yield and the 2-year treasury yield. The 2s10s spread is a proxy for the yield curve, and much attention is placed on it when the 2s10s spread falls below 0 because it provides a good indication of an impending recession. Historically, when the 2s10s spread falls into the negative territory, a recession tends to follow within a few months. At the same time when the 2s10s spread is below 0, the yield curve would invert. In other words, the short end of the curve is higher than the long end of the curve, usually signalling market panic and expectations of anaemic growth in the future. Alternatively, when the 2s10s spread is negative, liquidity becomes scarce due to the unwillingness of banks to lend. As banks borrow short and lend long, under a negative 2s10s spread environment would lead to losses when the banks make a loan. Therefore, liquidity dries up when the yield curve inverts which then exacerbates the general market selloff.
Amid the interest rate hike cycle that began in December 2015 where the Federal Reserve (FED) brought the Fed Funds Rate (FFR) up from 0.25% to 0.50%, the 2s10s spread began the decline lower. Since then, the FED has hiked the FFR three more times to 1.25%, leading to a lower 2s10s spread, falling from 1.24% to the current low of 0.57%.
There is a strong negative relationship between the FFR and 2s10s spread where the prolonged rate hike cycle inevitably leads to the inversion of the 2s10s spread. For example, the rate hike cycle in the housing boom period of the 2000s. The FED began the rate hike cycle only in July 2004 where the FFR was lifted from 1% to 1.25%. At the same time, the 2s10s spread was still trading at a high of 1.92%. Subsequent rate hikes to 4.25% in the following 17 months finally dragged the 2s10s spread into negative territory in December 2005. The FED only realised the problem with the negative 2s10s spread six months later in June 2006 where they were forced to halt the rate hike cycle at a high of 5.25%. The halting of the rate hike cycle also signalled to the market that something was amiss. Ultimately, the market fell sharply in the latter part of 2007 as recession ensued in December 2007. Both the inversion of the 2s10s spread and the subsequent halting of the rate hike cycle provided ample warning of a major market downturn. Historically, this pattern has played out perfectly since the 1970s where:
Fast forward to today, the FED is still well on track on their rate hike cycle. One more rate hike is expected in December 2017 according to the Fed Fund Futures implying a 98% probability of a rate hike to 1.50%. Furthermore, based on the Fed’s dot plot projection, three more rate hikes are expected in 2018. If the Fed follows through with this projection, then the current rate hike cycle would resemble the rate hike cycle in 2004. Using the data back in 2005 where the 2s10s spread was also trading at the current 0.61%, extrapolating the pace of the decline suggests 34 weeks before the 2s10s spread drops below the danger zone of 0. Even if the 2s10s spread falls into negative territory, the fall out in the market will not be immediate. On average, the recession occurs with a lag time of 54 weeks after the inversion of the yield curve.
In conclusion, we believe the equity market has further room to rise until the inversion of the yield curve happens. Our base case scenario points to a lengthy 34 weeks before the inversion of the 2s10s spread happens. All remains well for now.
Important Information
This report is prepared and/or distributed by Phillip Securities Research Pte Ltd ("Phillip Securities Research"), which is a holder of a financial adviser’s licence under the Financial Advisers Act, Chapter 110 in Singapore.
By receiving or reading this report, you agree to be bound by the terms and limitations set out below. Any failure to comply with these terms and limitations may constitute a violation of law. This report has been provided to you for personal use only and shall not be reproduced, distributed or published by you in whole or in part, for any purpose. If you have received this report by mistake, please delete or destroy it, and notify the sender immediately.
The information and any analysis, forecasts, projections, expectations and opinions (collectively, the “Research”) contained in this report has been obtained from public sources which Phillip Securities Research believes to be reliable. However, Phillip Securities Research does not make any representation or warranty, express or implied that such information or Research is accurate, complete or appropriate or should be relied upon as such. Any such information or Research contained in this report is subject to change, and Phillip Securities Research shall not have any responsibility to maintain or update the information or Research made available or to supply any corrections, updates or releases in connection therewith.
Any opinions, forecasts, assumptions, estimates, valuations and prices contained in this report are as of the date indicated and are subject to change at any time without prior notice. Past performance of any product referred to in this report is not indicative of future results.
This report does not constitute, and should not be used as a substitute for, tax, legal or investment advice. This report should not be relied upon exclusively or as authoritative, without further being subject to the recipient’s own independent verification and exercise of judgment. The fact that this report has been made available constitutes neither a recommendation to enter into a particular transaction, nor a representation that any product described in this report is suitable or appropriate for the recipient. Recipients should be aware that many of the products, which may be described in this report involve significant risks and may not be suitable for all investors, and that any decision to enter into transactions involving such products should not be made, unless all such risks are understood and an independent determination has been made that such transactions would be appropriate. Any discussion of the risks contained herein with respect to any product should not be considered to be a disclosure of all risks or a complete discussion of such risks.
Nothing in this report shall be construed to be an offer or solicitation for the purchase or sale of any product. Any decision to purchase any product mentioned in this report should take into account existing public information, including any registered prospectus in respect of such product.
Phillip Securities Research, or persons associated with or connected to Phillip Securities Research, including but not limited to its officers, directors, employees or persons involved in the issuance of this report, may provide an array of financial services to a large number of corporations in Singapore and worldwide, including but not limited to commercial / investment banking activities (including sponsorship, financial advisory or underwriting activities), brokerage or securities trading activities. Phillip Securities Research, or persons associated with or connected to Phillip Securities Research, including but not limited to its officers, directors, employees or persons involved in the issuance of this report, may have participated in or invested in transactions with the issuer(s) of the securities mentioned in this report, and may have performed services for or solicited business from such issuers. Additionally, Phillip Securities Research, or persons associated with or connected to Phillip Securities Research, including but not limited to its officers, directors, employees or persons involved in the issuance of this report, may have provided advice or investment services to such companies and investments or related investments, as may be mentioned in this report.
Phillip Securities Research or persons associated with or connected to Phillip Securities Research, including but not limited to its officers, directors, employees or persons involved in the issuance of this report may, from time to time maintain a long or short position in securities referred to herein, or in related futures or options, purchase or sell, make a market in, or engage in any other transaction involving such securities, and earn brokerage or other compensation in respect of the foregoing. Investments will be denominated in various currencies including US dollars and Euro and thus will be subject to any fluctuation in exchange rates between US dollars and Euro or foreign currencies and the currency of your own jurisdiction. Such fluctuations may have an adverse effect on the value, price or income return of the investment.
To the extent permitted by law, Phillip Securities Research, or persons associated with or connected to Phillip Securities Research, including but not limited to its officers, directors, employees or persons involved in the issuance of this report, may at any time engage in any of the above activities as set out above or otherwise hold an interest, whether material or not, in respect of companies and investments or related investments, which may be mentioned in this report. Accordingly, information may be available to Phillip Securities Research, or persons associated with or connected to Phillip Securities Research, including but not limited to its officers, directors, employees or persons involved in the issuance of this report, which is not reflected in this report, and Phillip Securities Research, or persons associated with or connected to Phillip Securities Research, including but not limited to its officers, directors, employees or persons involved in the issuance of this report, may, to the extent permitted by law, have acted upon or used the information prior to or immediately following its publication. Phillip Securities Research, or persons associated with or connected to Phillip Securities Research, including but not limited its officers, directors, employees or persons involved in the issuance of this report, may have issued other material that is inconsistent with, or reach different conclusions from, the contents of this report.
The information, tools and material presented herein are not directed, intended for distribution to or use by, any person or entity in any jurisdiction or country where such distribution, publication, availability or use would be contrary to the applicable law or regulation or which would subject Phillip Securities Research to any registration or licensing or other requirement, or penalty for contravention of such requirements within such jurisdiction.
This report is intended for general circulation only and does not take into account the specific investment objectives, financial situation or particular needs of any particular person. The products mentioned in this report may not be suitable for all investors and a person receiving or reading this report should seek advice from a professional and financial adviser regarding the legal, business, financial, tax and other aspects including the suitability of such products, taking into account the specific investment objectives, financial situation or particular needs of that person, before making a commitment to invest in any of such products.
This report is not intended for distribution, publication to or use by any person in any jurisdiction outside of Singapore or any other jurisdiction as Phillip Securities Research may determine in its absolute discretion.
IMPORTANT DISCLOSURES FOR INCLUDED RESEARCH ANALYSES OR REPORTS OF FOREIGN RESEARCH HOUSE
Where the report contains research analyses or reports from a foreign research house, please note:

Jeremy specialises in Technical Analysis and has 10 years of experience in studying price action. His areas of expertise include intermarket analysis on the equities, currencies, commodities and bonds market.
He is also a regular columnist on The Business Times - every Monday ChartPoint column.
He graduated with a Bachelor of Science in Banking and Finance from University of London.
