
Company Background
Airbnb (ABNB) is the leading marketplace for people to list, discover and book private or shared alternative accommodation. Its platform connects guests and hosts online to book unique places to stay and for experiences. Airbnb offers 6mn active listings from over 4mn hosts across 220 countries.
Investment Merits
We initiate coverage with a BUY rating. Our target price is US$119 based on a DCF valuation with a WACC of 6.8% and terminal growth of 4.0%.
REVENUE
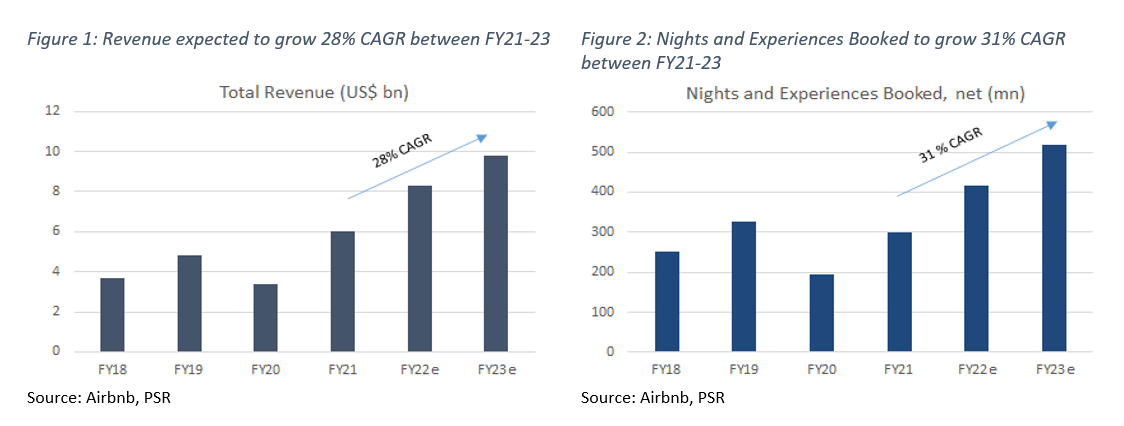
Airbnb’s revenue mainly comes from nights and experiences booked on its platform. For stays, customers (hosts and guests) are charged service fees as a percentage of the booking value, excluding taxes. Service fees vary depending on factors such as booking value, duration of stay, host type, and geography. For experiences, service fees are levied on hosts only. Total revenue expanded at 24% CAGR in the past four years (Figure 1) to US$6.0bn in FY21. Over FY18-21, Airbnb’s nights and experiences booked rose at a CAGR of 13% to 300.6mn in FY21 (Figure 2). The growth was mainly driven by travel demand recovery and alternative accommodation market share gains.
GEOGRAPHIC MIX
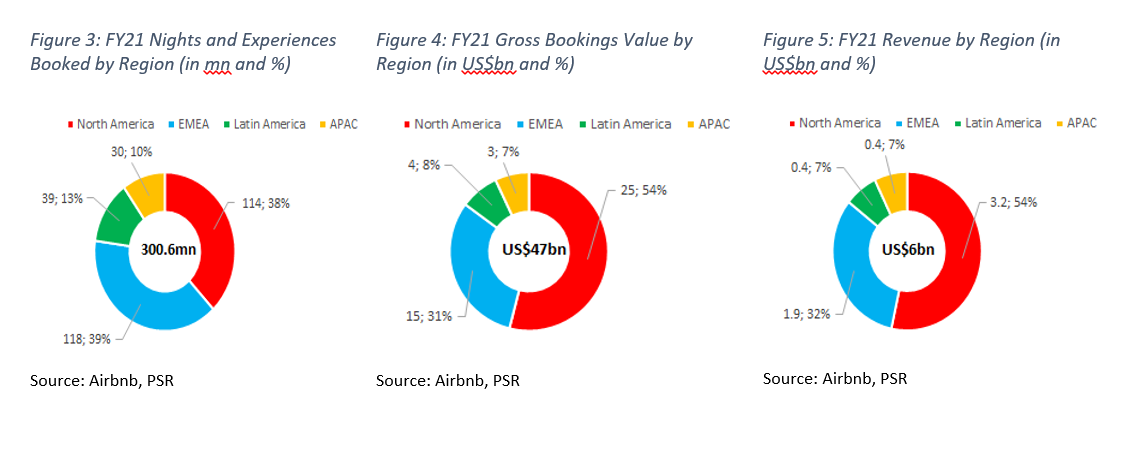
Airbnb’s business is geographically diversified with nearly half of its revenue from outside the US. In FY21, North America accounted for 38% of nights and experiences booked (Figure 3), and 54% of gross bookings value (Figure 4) and total revenue (Figure 5). North America held up the best through the COVID-19 pandemic, with nights and experiences booked only falling 21% YoY in 2020 compared with EMEA and Latin America which fell above 50%.
EXPENSES
Cost of sales expanded at a 16% CAGR in the past four years, compared with operating expenses growth of 22%. Operating expenses include operations and support (14% of FY21 revenue); product development (24%); sales and marketing (20%); and general and administrative (14%) costs. Total operating expenses as a percentage of revenue have reduced modestly from 78% in FY17 to 74% in FY21. We expect operating expenses as a percentage of revenue to be 62% in FY22e due to increased efficiency and lower product development costs.
MARGINS
Gross margins hit an all-time high of 81% in FY21, up by over 600 basis points (bps) from FY20. This was mainly driven by Airbnb’s top-line recovery due to a surge in nights and experiences booked and a higher average daily rate (ADRs). In FY21, Airbnb’s ADR grew 26% YoY to US$156 due to price appreciation and a business mix shift towards bookings in North America.
Net margins remained negative for FY21 at -6% compared with -136% in FY20. This has been largely due to revenue recovery and a significantly improved cost structure. Product development expenses decreased by 48% YoY in FY21 to US$1.4bn. This was mainly due to a US$1.3bn decline in payroll-related expenses. We expect Airbnb to report a maiden net profit of US$1.4bn in FY22e. This translates to a 17% net profit margin.
BALANCE SHEET
Assets: In FY21, cash and cash equivalents increased by 11% YoY to US$6.1bn. Marketable securities also increased by US$1.3bn. Airbnb is an asset light business and doesn’t need to make heavy investments in fixed assets. In FY21, the company reported fixed assets of US$0.4bn. Airbnb’s current ratio for FY21 is 1.9x.
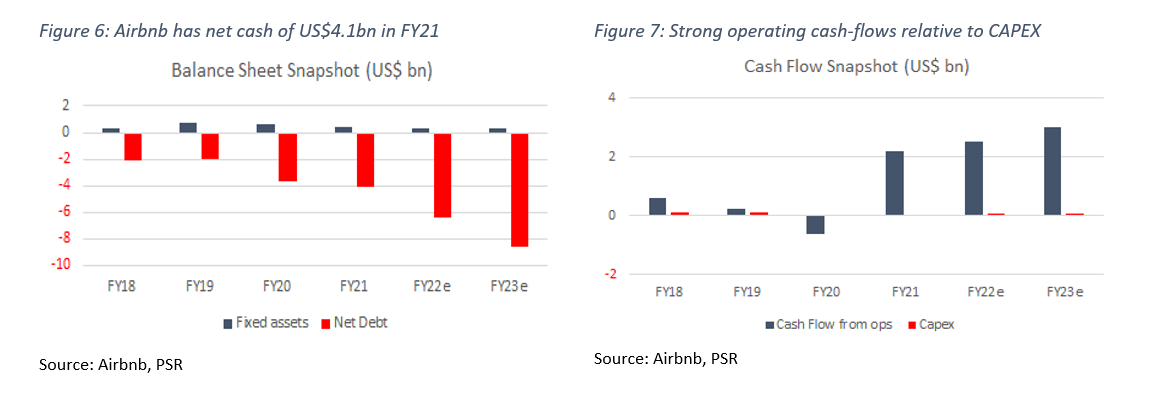
Liabilities: Current liabilities for FY21 were US$6.4bn, almost US$1.2bn more than FY20. This increase was mainly due to a rise in funds payable to customers. Non-current liabilities saw a jump of US$124mn in FY21. Airbnb had a net cash position of US$4.1bn in FY21 (Figure 6). Airbnb’s debt-to-equity ratio remains low at only 0.4x.
CASH-FLOW
Cash-flow from operations has steadily risen at 54% CAGR to US$2.2bn (Figure 7) from FY19 to FY21. Airbnb has almost insignificant CAPEX spending as the company doesn’t have to build or lease properties. In FY21, CAPEX stood at US$25mn. The company generated US$2.2bn in free cash flow in FY21. This translates to a 36% free cash flow margin.
BUSINESS MODEL
Airbnb generates revenue through service fees charged to guests and hosts. Airbnb service fees are applied to the booking subtotal (the rate per night plus cleaning fee and extra guest fee, if applicable, but excluding local occupancy taxes and Airbnb service fees). Host service fees are automatically deducted from the host payout. Airbnb offers two monetization models for accomodations and one for experiences (Figure 8).
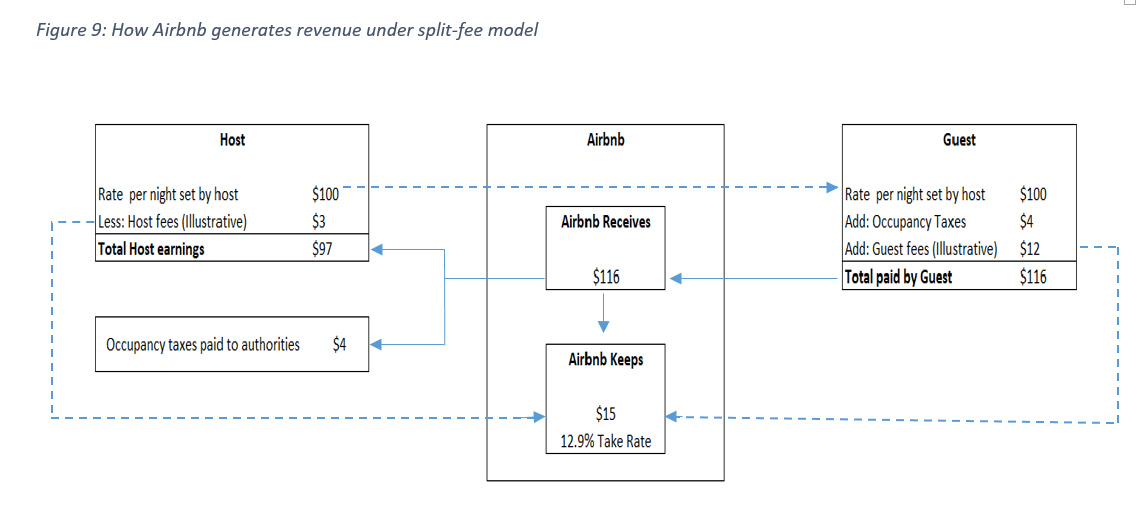
As shown in Figure 9 above, on a rental of US$100 per night set by the host, the guest pays US$116, which includes US$12 as guest fees and US$4 for taxes. Meanwhile, the host will make US$97 compared with the rate per night set at US$100 as Airbnb might collect US$3 hosting fee. Airbnb might make as much as US$15 (take rate of 13%), split between guest and host fees.
INDUSTRY
In 2020, the global tourism industry witnessed an unparalleled demand contraction, with March and April 2020 down 80% to 90% across all the travel industry segments and regions. This is mainly because countries worldwide implemented travel restrictions and other mandatory shutdowns to prevent the spread of the coronavirus. Since then, the travel demand recovery has been rocky and uneven due to fluctuations in COVID-19 case counts, lockdowns, and vaccination rates.
According to Statista, the global vacation rental industry’s total revenue is estimated to reach US$83bn in FY22, including US$18.6bn from the US. This hospitality segment is expected to rise at a CAGR of 6.3% between 2022 and 2026 to reach US$105.7bn, with 74% of that revenue generated through online sales. Additionally, the user penetration is expected to reach 11% by 2026 compared with 9% in 2022. The growth is mainly driven by significant pent-up demand to travel again.
Airbnb estimates its serviceable addressable market (SAM) to be US$1.5tn as of Dec. 2020, including US$1.2tn in short-term stays and US$239bn in experiences. Airbnb makes the following assumptions to determine the US$1.2tn for short-term stays (Figure 10):
11.8bn paid room nights at ADR of US$105 equals to US$1.2tn short-term rental SAM
Important Information
This report is prepared and/or distributed by Phillip Securities Research Pte Ltd ("Phillip Securities Research"), which is a holder of a financial adviser’s licence under the Financial Advisers Act, Chapter 110 in Singapore.
By receiving or reading this report, you agree to be bound by the terms and limitations set out below. Any failure to comply with these terms and limitations may constitute a violation of law. This report has been provided to you for personal use only and shall not be reproduced, distributed or published by you in whole or in part, for any purpose. If you have received this report by mistake, please delete or destroy it, and notify the sender immediately.
The information and any analysis, forecasts, projections, expectations and opinions (collectively, the “Research”) contained in this report has been obtained from public sources which Phillip Securities Research believes to be reliable. However, Phillip Securities Research does not make any representation or warranty, express or implied that such information or Research is accurate, complete or appropriate or should be relied upon as such. Any such information or Research contained in this report is subject to change, and Phillip Securities Research shall not have any responsibility to maintain or update the information or Research made available or to supply any corrections, updates or releases in connection therewith.
Any opinions, forecasts, assumptions, estimates, valuations and prices contained in this report are as of the date indicated and are subject to change at any time without prior notice. Past performance of any product referred to in this report is not indicative of future results.
This report does not constitute, and should not be used as a substitute for, tax, legal or investment advice. This report should not be relied upon exclusively or as authoritative, without further being subject to the recipient’s own independent verification and exercise of judgment. The fact that this report has been made available constitutes neither a recommendation to enter into a particular transaction, nor a representation that any product described in this report is suitable or appropriate for the recipient. Recipients should be aware that many of the products, which may be described in this report involve significant risks and may not be suitable for all investors, and that any decision to enter into transactions involving such products should not be made, unless all such risks are understood and an independent determination has been made that such transactions would be appropriate. Any discussion of the risks contained herein with respect to any product should not be considered to be a disclosure of all risks or a complete discussion of such risks.
Nothing in this report shall be construed to be an offer or solicitation for the purchase or sale of any product. Any decision to purchase any product mentioned in this report should take into account existing public information, including any registered prospectus in respect of such product.
Phillip Securities Research, or persons associated with or connected to Phillip Securities Research, including but not limited to its officers, directors, employees or persons involved in the issuance of this report, may provide an array of financial services to a large number of corporations in Singapore and worldwide, including but not limited to commercial / investment banking activities (including sponsorship, financial advisory or underwriting activities), brokerage or securities trading activities. Phillip Securities Research, or persons associated with or connected to Phillip Securities Research, including but not limited to its officers, directors, employees or persons involved in the issuance of this report, may have participated in or invested in transactions with the issuer(s) of the securities mentioned in this report, and may have performed services for or solicited business from such issuers. Additionally, Phillip Securities Research, or persons associated with or connected to Phillip Securities Research, including but not limited to its officers, directors, employees or persons involved in the issuance of this report, may have provided advice or investment services to such companies and investments or related investments, as may be mentioned in this report.
Phillip Securities Research or persons associated with or connected to Phillip Securities Research, including but not limited to its officers, directors, employees or persons involved in the issuance of this report may, from time to time maintain a long or short position in securities referred to herein, or in related futures or options, purchase or sell, make a market in, or engage in any other transaction involving such securities, and earn brokerage or other compensation in respect of the foregoing. Investments will be denominated in various currencies including US dollars and Euro and thus will be subject to any fluctuation in exchange rates between US dollars and Euro or foreign currencies and the currency of your own jurisdiction. Such fluctuations may have an adverse effect on the value, price or income return of the investment.
To the extent permitted by law, Phillip Securities Research, or persons associated with or connected to Phillip Securities Research, including but not limited to its officers, directors, employees or persons involved in the issuance of this report, may at any time engage in any of the above activities as set out above or otherwise hold an interest, whether material or not, in respect of companies and investments or related investments, which may be mentioned in this report. Accordingly, information may be available to Phillip Securities Research, or persons associated with or connected to Phillip Securities Research, including but not limited to its officers, directors, employees or persons involved in the issuance of this report, which is not reflected in this report, and Phillip Securities Research, or persons associated with or connected to Phillip Securities Research, including but not limited to its officers, directors, employees or persons involved in the issuance of this report, may, to the extent permitted by law, have acted upon or used the information prior to or immediately following its publication. Phillip Securities Research, or persons associated with or connected to Phillip Securities Research, including but not limited its officers, directors, employees or persons involved in the issuance of this report, may have issued other material that is inconsistent with, or reach different conclusions from, the contents of this report.
The information, tools and material presented herein are not directed, intended for distribution to or use by, any person or entity in any jurisdiction or country where such distribution, publication, availability or use would be contrary to the applicable law or regulation or which would subject Phillip Securities Research to any registration or licensing or other requirement, or penalty for contravention of such requirements within such jurisdiction.
This report is intended for general circulation only and does not take into account the specific investment objectives, financial situation or particular needs of any particular person. The products mentioned in this report may not be suitable for all investors and a person receiving or reading this report should seek advice from a professional and financial adviser regarding the legal, business, financial, tax and other aspects including the suitability of such products, taking into account the specific investment objectives, financial situation or particular needs of that person, before making a commitment to invest in any of such products.
This report is not intended for distribution, publication to or use by any person in any jurisdiction outside of Singapore or any other jurisdiction as Phillip Securities Research may determine in its absolute discretion.
IMPORTANT DISCLOSURES FOR INCLUDED RESEARCH ANALYSES OR REPORTS OF FOREIGN RESEARCH HOUSE
Where the report contains research analyses or reports from a foreign research house, please note:
