
10 year Treasury yield Daily Chart Source: Bloomberg, PSR
The bond rout scare has returned to the market as the 10 year Treasury yield flirts with the 3.00% psychological round number. Many analyst and pundits are calling for the end of the 30 years bond bull market if the 3.00% round number breaks to the upside which is partly the reason why the US equity market is also being negatively affected lately.
However, the exact level or threshold that needs to be breached in order to kickstart the bond bear market is the January 2014 high of 3.05%. The recent price action on the 10 year yield has broken above the 3.00% round number but has yet to test the 3.05%. In other words, the bond bull market is still currently intact until we get a daily close above the 3.05% followed by a weekly and monthly close above that level for further confirmation of a monumental trend shift. Keep in mind the bond price moves inversely to the bond yield. Hence, a rising yield represents a falling bond price while a falling yield represents a rising bond price.
Based on our study, a few factors are pointing to the 3.05% to remain intact.
Currently, the market is extremely positioned on the short side of the bond complex especially the 10 year Treasury bonds. Historically, when the net speculator Futures positions exceeded below the –210,000 contracts, short squeezes tend to happen leading to a rise in bond price and a drop in yield. Hence, with the current net speculator Futures positions entering into the extreme short side again at –372,000 contracts, a short squeeze in the 10 year Treasury bond is imminent. That should put a cap on the current bullish momentum with the 3.05% acting as the ceiling.
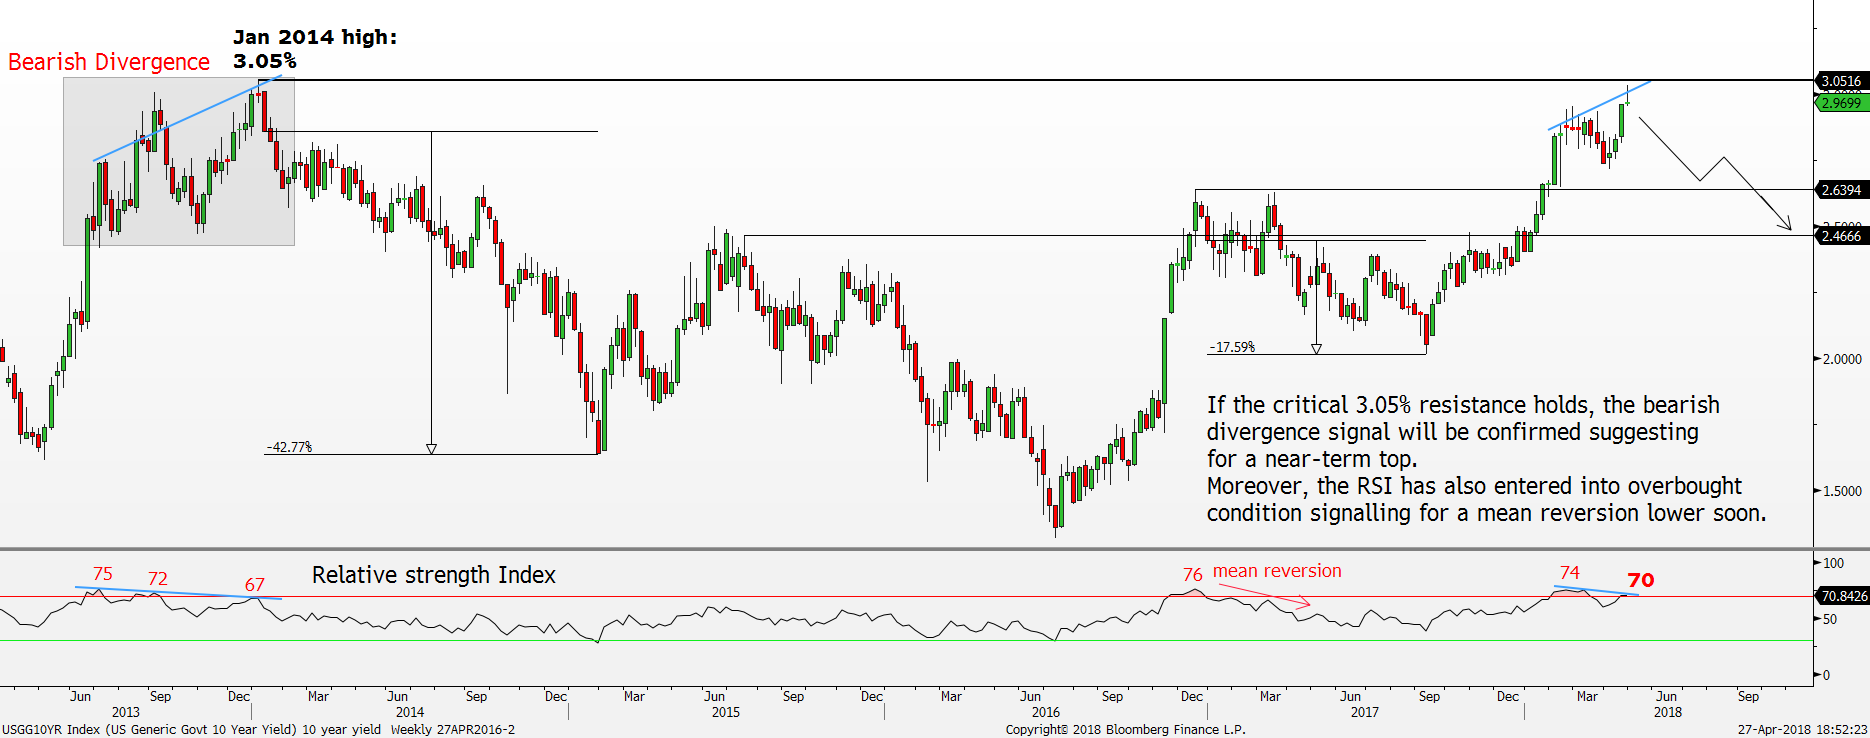
On the price front, the current picture looks supportive of seeing a near-term top too. With the recent break above the 3.00% psychological round number, the weekly RSI has entered into the overbought condition once again. RSI measures momentum. A reading above 70 represents overbought condition while a reading below 30 represents oversold condition. Historically, going back to 2000, the 10 year yield tends to react spontaneously to an overbought RSI. Whenever the weekly RSI exceeds the 70 overbought condition, a mean reversion lower inevitably happens. Since 2000, there were only five occasions where the 10 year yield entered into the overbought condition. All five occurrences perfectly signalled for near-term tops in yield. On average, the Yield fell -22%.
Therefore, with the recent rise in the 10 year yield leading to the RSI once again being in the overbought condition currently at 70, we expect a mean reversion lower to take place soon. Using the average mean reversion of -22% would translate into a 10 year yield of around 2.35%.
Taking an alternative view on the RSI also reveals another interesting bearish view on the 10 year yield. If the 3.05% resistance area holds, then we could very well be seeing a bearish divergence. In the week ended 16 February 2018 was when the weekly RSI hit a high of 74. Since then, the RSI has formed another Lower Highs (LH) while the 10 year yield continues to establish another Higher High (HH) shown by the diagonal line in the charts. The last time we saw a similar bearish divergence was in 2013 shown by the highlighted box. The 10 year yield topped out at 3.05% in January 2014 after forming a third Higher High (HH) point while the RSI completed the formation of the third Lower High (LH) point. As a result, the 10 year yield fell to a low of 1.64% over the following year.
In summary, with the extremely short positioning in the speculator space and overbought weekly RSI, we expect the 10 year treasury yield to find a near-term top near the 3.05% level with a reversal back below the 3% range.
On the flipside, as long as the 3.05% level holds in the 10 year treasury yield holds, the 200-day moving average in the Dow Jones Industrial Average, S&P 500 index and Nasdaq 100 index should hold too, thus bringing back the risk-on environment.
Important Information
This report is prepared and/or distributed by Phillip Securities Research Pte Ltd ("Phillip Securities Research"), which is a holder of a financial adviser’s licence under the Financial Advisers Act, Chapter 110 in Singapore.
By receiving or reading this report, you agree to be bound by the terms and limitations set out below. Any failure to comply with these terms and limitations may constitute a violation of law. This report has been provided to you for personal use only and shall not be reproduced, distributed or published by you in whole or in part, for any purpose. If you have received this report by mistake, please delete or destroy it, and notify the sender immediately.
The information and any analysis, forecasts, projections, expectations and opinions (collectively, the “Research”) contained in this report has been obtained from public sources which Phillip Securities Research believes to be reliable. However, Phillip Securities Research does not make any representation or warranty, express or implied that such information or Research is accurate, complete or appropriate or should be relied upon as such. Any such information or Research contained in this report is subject to change, and Phillip Securities Research shall not have any responsibility to maintain or update the information or Research made available or to supply any corrections, updates or releases in connection therewith.
Any opinions, forecasts, assumptions, estimates, valuations and prices contained in this report are as of the date indicated and are subject to change at any time without prior notice. Past performance of any product referred to in this report is not indicative of future results.
This report does not constitute, and should not be used as a substitute for, tax, legal or investment advice. This report should not be relied upon exclusively or as authoritative, without further being subject to the recipient’s own independent verification and exercise of judgment. The fact that this report has been made available constitutes neither a recommendation to enter into a particular transaction, nor a representation that any product described in this report is suitable or appropriate for the recipient. Recipients should be aware that many of the products, which may be described in this report involve significant risks and may not be suitable for all investors, and that any decision to enter into transactions involving such products should not be made, unless all such risks are understood and an independent determination has been made that such transactions would be appropriate. Any discussion of the risks contained herein with respect to any product should not be considered to be a disclosure of all risks or a complete discussion of such risks.
Nothing in this report shall be construed to be an offer or solicitation for the purchase or sale of any product. Any decision to purchase any product mentioned in this report should take into account existing public information, including any registered prospectus in respect of such product.
Phillip Securities Research, or persons associated with or connected to Phillip Securities Research, including but not limited to its officers, directors, employees or persons involved in the issuance of this report, may provide an array of financial services to a large number of corporations in Singapore and worldwide, including but not limited to commercial / investment banking activities (including sponsorship, financial advisory or underwriting activities), brokerage or securities trading activities. Phillip Securities Research, or persons associated with or connected to Phillip Securities Research, including but not limited to its officers, directors, employees or persons involved in the issuance of this report, may have participated in or invested in transactions with the issuer(s) of the securities mentioned in this report, and may have performed services for or solicited business from such issuers. Additionally, Phillip Securities Research, or persons associated with or connected to Phillip Securities Research, including but not limited to its officers, directors, employees or persons involved in the issuance of this report, may have provided advice or investment services to such companies and investments or related investments, as may be mentioned in this report.
Phillip Securities Research or persons associated with or connected to Phillip Securities Research, including but not limited to its officers, directors, employees or persons involved in the issuance of this report may, from time to time maintain a long or short position in securities referred to herein, or in related futures or options, purchase or sell, make a market in, or engage in any other transaction involving such securities, and earn brokerage or other compensation in respect of the foregoing. Investments will be denominated in various currencies including US dollars and Euro and thus will be subject to any fluctuation in exchange rates between US dollars and Euro or foreign currencies and the currency of your own jurisdiction. Such fluctuations may have an adverse effect on the value, price or income return of the investment.
To the extent permitted by law, Phillip Securities Research, or persons associated with or connected to Phillip Securities Research, including but not limited to its officers, directors, employees or persons involved in the issuance of this report, may at any time engage in any of the above activities as set out above or otherwise hold an interest, whether material or not, in respect of companies and investments or related investments, which may be mentioned in this report. Accordingly, information may be available to Phillip Securities Research, or persons associated with or connected to Phillip Securities Research, including but not limited to its officers, directors, employees or persons involved in the issuance of this report, which is not reflected in this report, and Phillip Securities Research, or persons associated with or connected to Phillip Securities Research, including but not limited to its officers, directors, employees or persons involved in the issuance of this report, may, to the extent permitted by law, have acted upon or used the information prior to or immediately following its publication. Phillip Securities Research, or persons associated with or connected to Phillip Securities Research, including but not limited its officers, directors, employees or persons involved in the issuance of this report, may have issued other material that is inconsistent with, or reach different conclusions from, the contents of this report.
The information, tools and material presented herein are not directed, intended for distribution to or use by, any person or entity in any jurisdiction or country where such distribution, publication, availability or use would be contrary to the applicable law or regulation or which would subject Phillip Securities Research to any registration or licensing or other requirement, or penalty for contravention of such requirements within such jurisdiction.
This report is intended for general circulation only and does not take into account the specific investment objectives, financial situation or particular needs of any particular person. The products mentioned in this report may not be suitable for all investors and a person receiving or reading this report should seek advice from a professional and financial adviser regarding the legal, business, financial, tax and other aspects including the suitability of such products, taking into account the specific investment objectives, financial situation or particular needs of that person, before making a commitment to invest in any of such products.
This report is not intended for distribution, publication to or use by any person in any jurisdiction outside of Singapore or any other jurisdiction as Phillip Securities Research may determine in its absolute discretion.
IMPORTANT DISCLOSURES FOR INCLUDED RESEARCH ANALYSES OR REPORTS OF FOREIGN RESEARCH HOUSE
Where the report contains research analyses or reports from a foreign research house, please note:

Jeremy specialises in Technical Analysis and has 10 years of experience in studying price action. His areas of expertise include intermarket analysis on the equities, currencies, commodities and bonds market.
He is also a regular columnist on The Business Times - every Monday ChartPoint column.
He graduated with a Bachelor of Science in Banking and Finance from University of London.
