
Gold Daily Timeframe Source: Bloomberg, PSR
After months of trying to break above the $1360 resistance area, the bears emerged victorious in April and kickstarted the current leg of selling. Gold has been falling for the past four months and has erased around -10% from the $1360 high in April. Nonetheless, we are expecting the selling momentum to fade away soon for the bulls to retake control.
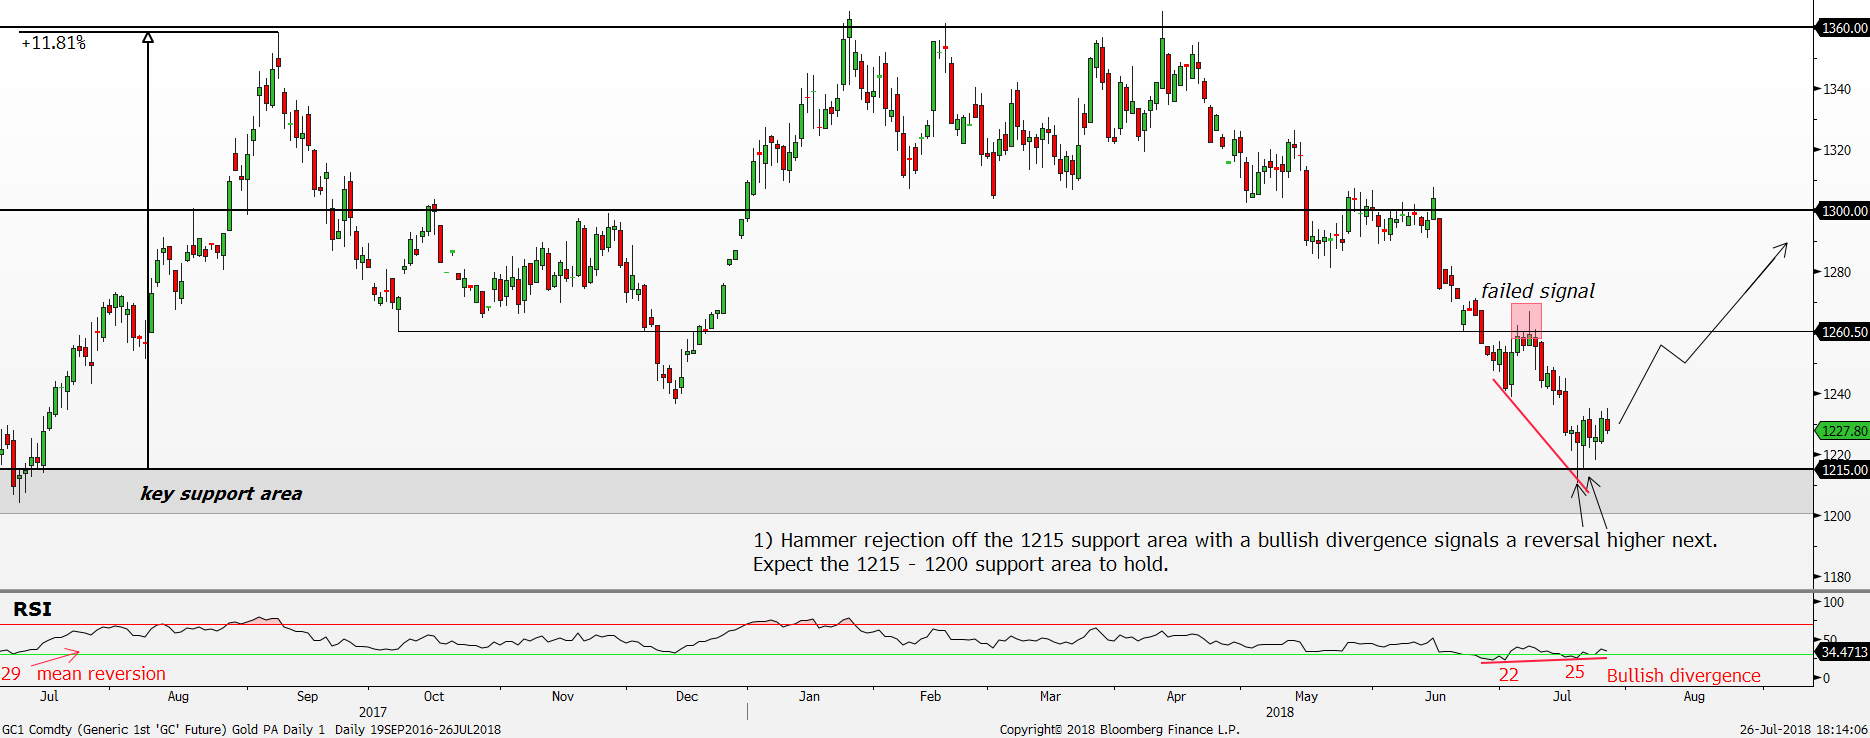
On the price action front, the heavy selling since April has taken Gold down to a key support area, between $1215 and $1200 psychological round numbers. Keep in mind the $1215 to $1200 support area is a pivotal point back in May 2016 and February 2017 as it succeeded in halting the selloff and subsequently lifted Gold back into the uptrend with +14% and 13% rally respectively. The current test of the $1215 support area shows a promising sign that the bulls are still present at this key support area. There were two days where price tested the $1215 support area and the bulls relentlessly halted the selling pressure each time. As a result, price formed hammer rejection bar off the $1215 support area on 19 and 20 July 2018 signalling a reversal higher.
Moreover, the Relative Strength Index (RSI) further substantiates for a reversal higher with the current oversold condition. The strong bearish momentum for the past four months has dragged the RSI into oversold condition since 20 June with the RSI hitting an extreme low of 22 on 28 June 2018 suggesting for a mean reversion higher next. RSI measures momentum. A reading above 70 represents overbought condition while a reading below 30 represents oversold condition.
With the recent hammer rejections off the $1215 support area, the RSI managed to recover back above the 30 oversold line suggests the possibility of the beginning of a mean reversion higher. Our 10-year historical study of the oversold RSI mean reversion pattern shows an average rebound of +6% when the signal is triggered, when the RSI rises back above the 30 oversold line. Hence, if the current bullish rejection off the $1215 support area ushers in the oversold RSI mean reversion, expect Gold to rally +6% in the near-term to test the $1300 psychological round number.
Bear in mind there was a failed oversold RSI mean reversion signal recently in July as the rebound was rather shallow shown by the red highlighted area. However, with that failed signal, price is setting up for an RSI Bullish Divergence signal. Instead of seeing a Lower Low in the RSI, it has formed a Higher Low on 19 July 2018 with the recent bullish rejection off the $1215 support area shown by the diagonal lines. This is contrary to what Gold price is doing with the formation of the Lower Low. Therefore, if the hammer rejection bar were to hold, the Bullish Divergence pattern should play out suggesting the start of a bigger move higher.
From the speculators positioning perspective, the current market dynamics are also supportive of a move higher in Gold due to the unloved sentiment. The current net speculator positioning stands at 57,841 contracts which is considered extremely low from a historical perspective. The last time we saw such a hated attitude towards Gold was in July 2017. The subsequent move in Gold was a sharp reversal higher by +7%, from $1268 to $1357. Historically, the net speculator positioning provides a good contrarian signal when the herd are heavily tilted on the long or short side. Thus, whenever, the net speculator positioning enters into the extreme ends, a mean reversion tends to happen, and a similar reversal move in Gold. Thus, expect the mean reversion to happen soon as the net speculators are once again extremely disinterested to Gold.
In summary, expect the key support area at $1215 to $1200 area to hold for the long-term uptrend to resume. The current hammer rejection off the $1215 support area with RSI bullish divergence suggests a rebound higher next for Gold to retest the $1260 resistance area followed by $1300.
Important Information
This report is prepared and/or distributed by Phillip Securities Research Pte Ltd ("Phillip Securities Research"), which is a holder of a financial adviser’s licence under the Financial Advisers Act, Chapter 110 in Singapore.
By receiving or reading this report, you agree to be bound by the terms and limitations set out below. Any failure to comply with these terms and limitations may constitute a violation of law. This report has been provided to you for personal use only and shall not be reproduced, distributed or published by you in whole or in part, for any purpose. If you have received this report by mistake, please delete or destroy it, and notify the sender immediately.
The information and any analysis, forecasts, projections, expectations and opinions (collectively, the “Research”) contained in this report has been obtained from public sources which Phillip Securities Research believes to be reliable. However, Phillip Securities Research does not make any representation or warranty, express or implied that such information or Research is accurate, complete or appropriate or should be relied upon as such. Any such information or Research contained in this report is subject to change, and Phillip Securities Research shall not have any responsibility to maintain or update the information or Research made available or to supply any corrections, updates or releases in connection therewith.
Any opinions, forecasts, assumptions, estimates, valuations and prices contained in this report are as of the date indicated and are subject to change at any time without prior notice. Past performance of any product referred to in this report is not indicative of future results.
This report does not constitute, and should not be used as a substitute for, tax, legal or investment advice. This report should not be relied upon exclusively or as authoritative, without further being subject to the recipient’s own independent verification and exercise of judgment. The fact that this report has been made available constitutes neither a recommendation to enter into a particular transaction, nor a representation that any product described in this report is suitable or appropriate for the recipient. Recipients should be aware that many of the products, which may be described in this report involve significant risks and may not be suitable for all investors, and that any decision to enter into transactions involving such products should not be made, unless all such risks are understood and an independent determination has been made that such transactions would be appropriate. Any discussion of the risks contained herein with respect to any product should not be considered to be a disclosure of all risks or a complete discussion of such risks.
Nothing in this report shall be construed to be an offer or solicitation for the purchase or sale of any product. Any decision to purchase any product mentioned in this report should take into account existing public information, including any registered prospectus in respect of such product.
Phillip Securities Research, or persons associated with or connected to Phillip Securities Research, including but not limited to its officers, directors, employees or persons involved in the issuance of this report, may provide an array of financial services to a large number of corporations in Singapore and worldwide, including but not limited to commercial / investment banking activities (including sponsorship, financial advisory or underwriting activities), brokerage or securities trading activities. Phillip Securities Research, or persons associated with or connected to Phillip Securities Research, including but not limited to its officers, directors, employees or persons involved in the issuance of this report, may have participated in or invested in transactions with the issuer(s) of the securities mentioned in this report, and may have performed services for or solicited business from such issuers. Additionally, Phillip Securities Research, or persons associated with or connected to Phillip Securities Research, including but not limited to its officers, directors, employees or persons involved in the issuance of this report, may have provided advice or investment services to such companies and investments or related investments, as may be mentioned in this report.
Phillip Securities Research or persons associated with or connected to Phillip Securities Research, including but not limited to its officers, directors, employees or persons involved in the issuance of this report may, from time to time maintain a long or short position in securities referred to herein, or in related futures or options, purchase or sell, make a market in, or engage in any other transaction involving such securities, and earn brokerage or other compensation in respect of the foregoing. Investments will be denominated in various currencies including US dollars and Euro and thus will be subject to any fluctuation in exchange rates between US dollars and Euro or foreign currencies and the currency of your own jurisdiction. Such fluctuations may have an adverse effect on the value, price or income return of the investment.
To the extent permitted by law, Phillip Securities Research, or persons associated with or connected to Phillip Securities Research, including but not limited to its officers, directors, employees or persons involved in the issuance of this report, may at any time engage in any of the above activities as set out above or otherwise hold an interest, whether material or not, in respect of companies and investments or related investments, which may be mentioned in this report. Accordingly, information may be available to Phillip Securities Research, or persons associated with or connected to Phillip Securities Research, including but not limited to its officers, directors, employees or persons involved in the issuance of this report, which is not reflected in this report, and Phillip Securities Research, or persons associated with or connected to Phillip Securities Research, including but not limited to its officers, directors, employees or persons involved in the issuance of this report, may, to the extent permitted by law, have acted upon or used the information prior to or immediately following its publication. Phillip Securities Research, or persons associated with or connected to Phillip Securities Research, including but not limited its officers, directors, employees or persons involved in the issuance of this report, may have issued other material that is inconsistent with, or reach different conclusions from, the contents of this report.
The information, tools and material presented herein are not directed, intended for distribution to or use by, any person or entity in any jurisdiction or country where such distribution, publication, availability or use would be contrary to the applicable law or regulation or which would subject Phillip Securities Research to any registration or licensing or other requirement, or penalty for contravention of such requirements within such jurisdiction.
This report is intended for general circulation only and does not take into account the specific investment objectives, financial situation or particular needs of any particular person. The products mentioned in this report may not be suitable for all investors and a person receiving or reading this report should seek advice from a professional and financial adviser regarding the legal, business, financial, tax and other aspects including the suitability of such products, taking into account the specific investment objectives, financial situation or particular needs of that person, before making a commitment to invest in any of such products.
This report is not intended for distribution, publication to or use by any person in any jurisdiction outside of Singapore or any other jurisdiction as Phillip Securities Research may determine in its absolute discretion.
IMPORTANT DISCLOSURES FOR INCLUDED RESEARCH ANALYSES OR REPORTS OF FOREIGN RESEARCH HOUSE
Where the report contains research analyses or reports from a foreign research house, please note:

Jeremy specialises in Technical Analysis and has 10 years of experience in studying price action. His areas of expertise include intermarket analysis on the equities, currencies, commodities and bonds market.
He is also a regular columnist on The Business Times - every Monday ChartPoint column.
He graduated with a Bachelor of Science in Banking and Finance from University of London.
