
This article was published in Business Times’ column “Chart Point” on 26 March 2018.
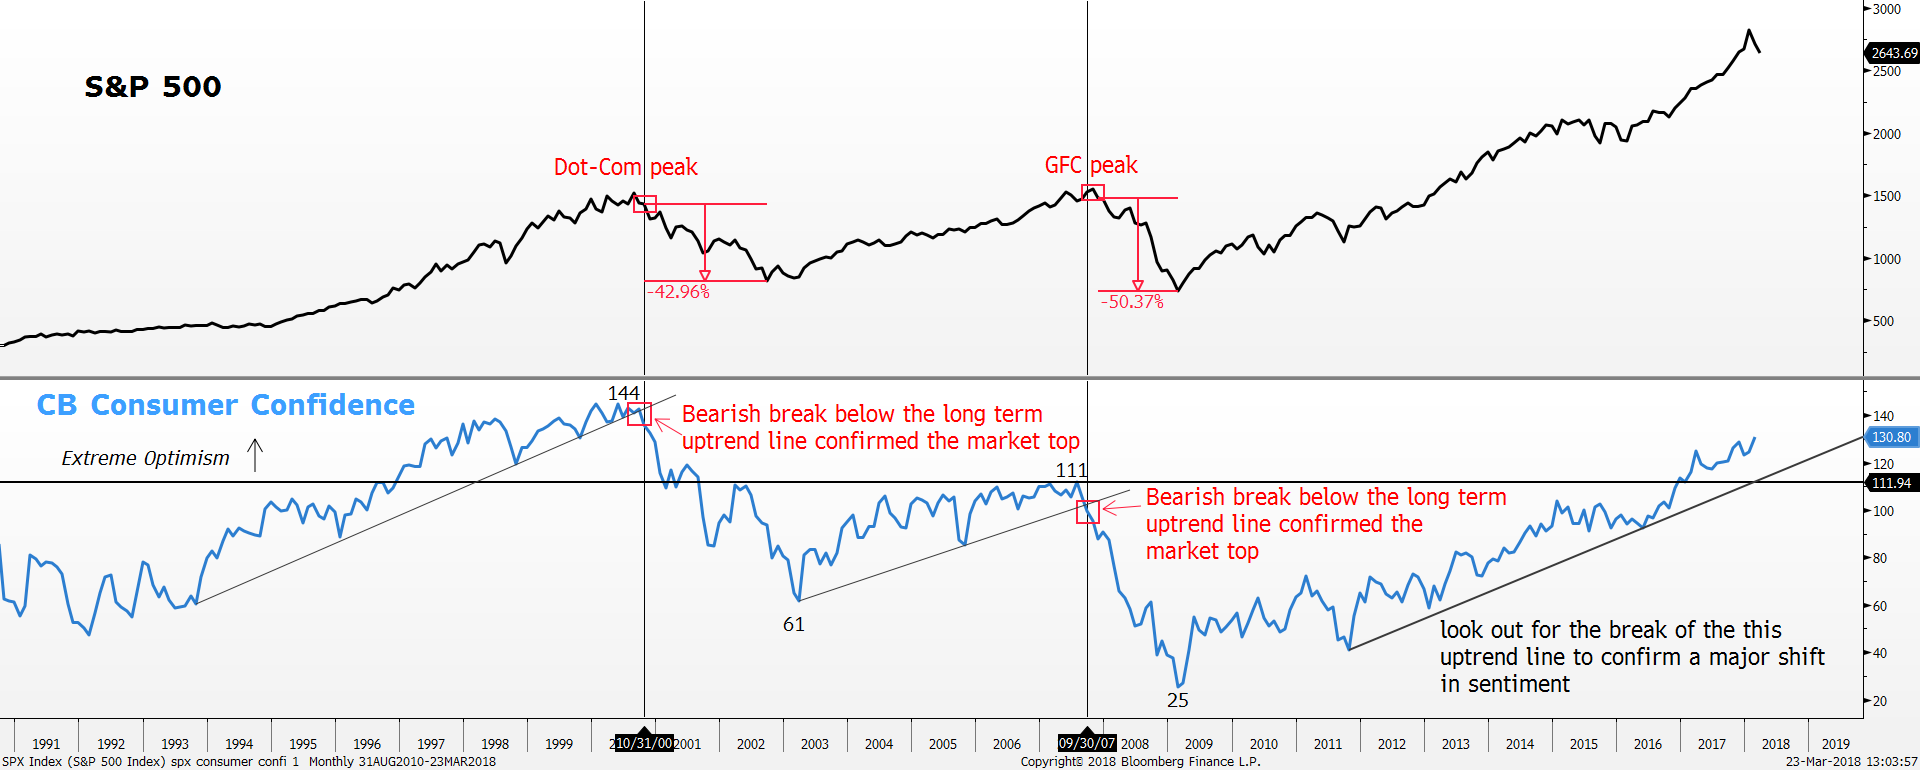
S&P 500 index vs CB Consumer Confidence Index Monthly Chart
Source: Bloomberg, PSR
*Vertical line demarcates the point when the CB Consumer Confidence Index broke below the multi-year uptrend line
The news flow on trade wars recently has been weighing down on the US equity market. For the past two weeks, the US equity market moved in a depressed manner. On 9 March, President Trump signed an order to impose 25% tariffs on steel imports and 10% tariffs on aluminium imports with Canada and Mexico exempted. On top of that, back in January, President Trump had also imposed tariffs on imported washing machines and solar cells. More recently, US unveiled tariffs on $50 billion worth of imports from China over the intellectual property theft.
Despite all the talks about how trade war is bad for the economy, the current outlook on the US economic data remained robust. More specifically, consumer sentiment are at multi-decade high confirmed by all three survey providers, Conference Board, University of Michigan and Bloomberg. Our study has shown that consumer sentiment and the S&P 500 index have a strong positive correlation. When consumer sentiment is soaring, it means that the animal spirit is kicking in high gear and people are feeling overly optimistic. That should feedback into greater aggregate demand from the economic perspective and greater willingness to participate in the stock markets as the risk-on sentiment flourishes. All in all, when the consumer sentiments are rising and accelerating, we should see a pick-up in economic activity as well as a bullish equity market.
For this article, we will be referencing the Conference Board (CB) Consumer Confidence Index as the proxy for the consumer sentiment. The results of the consumer sentiment are tabulated from a random sample of approximately 300 US households. Do note that the other consumer sentiment indicators such as University of Michigan Consumer Sentiment and Bloomberg Consumer Comfort index do track a similar movement to the CB Consumer Confidence Index. Both the Dot-Com bubble and Global Financial Crisis tops were forewarned by the CB Consumer Confidence Index when the multi-year uptrend broke to the downside shown by the vertical line. For instance, since 1994, the S&P 500 index has been moving in a steep uptrend as the consumer sentiment supported the optimistic view. A multi-year uptrend line was established as a result, and it kept the general equity bull market alive until late 2000. Somewhere in October 2000 was when the CB Consumer Confidence broke below the multi-year uptrend line and confirmed a reversal of the overly optimistic view of the general public. As soon as the CB Consumer Confidence broke below the key multi-year uptrend line, the market went into a severe risk-off mode and tumbled -42% over the next two years.
A similar warning shot happened in September 2007 when the CB Consumer Confidence Index broke the multi-year uptrend line that started in 2003. The break below the multi-year uptrend line reversed the prior upbeat outlook into a gloomy one where the CB Consumer Confidence Index fell precipitously from a high of 111.94 to a low of 25.3 in February 2009. As a result, the global financial crisis unfolded and shook the world adversely. The S&P 500 index fell as much as 50% after the CB Consumer Confidence Index broke below the multi-year uptrend line.
Fast forward to today, the CB Consumer Confidence Index is exhibiting strong growth and optimistic view once again. It has been rising firmly since 2011 from a low of 40.87 to the current high of 130.8. Note the last time the CB Consumer Confidence Index was at such an extreme height, the market was in the midst of the Dot-Com bubble. Hence, from the consumer sentiment perspective, we might be in another euphoric market.
The general trend of the S&P 500 index has also mirrored the move in the CB Consumer Confidence Index since 2011, and it is currently trading at a record high. Thus, as long as the CB Consumer Confidence Index continues to improve and stay above the multi-year uptrend line, we believe the US general equity market should continue with the ascend. The bull market in the S&P 500 index should stay intact until a sharp reversal in the CB Consumer Confidence Index occurs. The confirmation for that would be a drop in the CB Consumer Confidence Index below the multi-year uptrend line at 116. Keep a close look out on that. When the CB Consumer Confidence Index breaches below the multi-year uptrend line, the other consumer sentiment gauges from University of Michigan and Bloomberg should also triggered the bearish signal of moving below their multi-year uptrend line. As of now, all the consumer sentiment indicators remain exceptionally rosy suggesting all is well.
With the recent trade war related sell-down in the S&P 500 index, some key levels to watch for a rebound back into the uptrend are the 200-day moving average at 2600 points and 2550 support area.
Important Information
This report is prepared and/or distributed by Phillip Securities Research Pte Ltd ("Phillip Securities Research"), which is a holder of a financial adviser’s licence under the Financial Advisers Act, Chapter 110 in Singapore.
By receiving or reading this report, you agree to be bound by the terms and limitations set out below. Any failure to comply with these terms and limitations may constitute a violation of law. This report has been provided to you for personal use only and shall not be reproduced, distributed or published by you in whole or in part, for any purpose. If you have received this report by mistake, please delete or destroy it, and notify the sender immediately.
The information and any analysis, forecasts, projections, expectations and opinions (collectively, the “Research”) contained in this report has been obtained from public sources which Phillip Securities Research believes to be reliable. However, Phillip Securities Research does not make any representation or warranty, express or implied that such information or Research is accurate, complete or appropriate or should be relied upon as such. Any such information or Research contained in this report is subject to change, and Phillip Securities Research shall not have any responsibility to maintain or update the information or Research made available or to supply any corrections, updates or releases in connection therewith.
Any opinions, forecasts, assumptions, estimates, valuations and prices contained in this report are as of the date indicated and are subject to change at any time without prior notice. Past performance of any product referred to in this report is not indicative of future results.
This report does not constitute, and should not be used as a substitute for, tax, legal or investment advice. This report should not be relied upon exclusively or as authoritative, without further being subject to the recipient’s own independent verification and exercise of judgment. The fact that this report has been made available constitutes neither a recommendation to enter into a particular transaction, nor a representation that any product described in this report is suitable or appropriate for the recipient. Recipients should be aware that many of the products, which may be described in this report involve significant risks and may not be suitable for all investors, and that any decision to enter into transactions involving such products should not be made, unless all such risks are understood and an independent determination has been made that such transactions would be appropriate. Any discussion of the risks contained herein with respect to any product should not be considered to be a disclosure of all risks or a complete discussion of such risks.
Nothing in this report shall be construed to be an offer or solicitation for the purchase or sale of any product. Any decision to purchase any product mentioned in this report should take into account existing public information, including any registered prospectus in respect of such product.
Phillip Securities Research, or persons associated with or connected to Phillip Securities Research, including but not limited to its officers, directors, employees or persons involved in the issuance of this report, may provide an array of financial services to a large number of corporations in Singapore and worldwide, including but not limited to commercial / investment banking activities (including sponsorship, financial advisory or underwriting activities), brokerage or securities trading activities. Phillip Securities Research, or persons associated with or connected to Phillip Securities Research, including but not limited to its officers, directors, employees or persons involved in the issuance of this report, may have participated in or invested in transactions with the issuer(s) of the securities mentioned in this report, and may have performed services for or solicited business from such issuers. Additionally, Phillip Securities Research, or persons associated with or connected to Phillip Securities Research, including but not limited to its officers, directors, employees or persons involved in the issuance of this report, may have provided advice or investment services to such companies and investments or related investments, as may be mentioned in this report.
Phillip Securities Research or persons associated with or connected to Phillip Securities Research, including but not limited to its officers, directors, employees or persons involved in the issuance of this report may, from time to time maintain a long or short position in securities referred to herein, or in related futures or options, purchase or sell, make a market in, or engage in any other transaction involving such securities, and earn brokerage or other compensation in respect of the foregoing. Investments will be denominated in various currencies including US dollars and Euro and thus will be subject to any fluctuation in exchange rates between US dollars and Euro or foreign currencies and the currency of your own jurisdiction. Such fluctuations may have an adverse effect on the value, price or income return of the investment.
To the extent permitted by law, Phillip Securities Research, or persons associated with or connected to Phillip Securities Research, including but not limited to its officers, directors, employees or persons involved in the issuance of this report, may at any time engage in any of the above activities as set out above or otherwise hold an interest, whether material or not, in respect of companies and investments or related investments, which may be mentioned in this report. Accordingly, information may be available to Phillip Securities Research, or persons associated with or connected to Phillip Securities Research, including but not limited to its officers, directors, employees or persons involved in the issuance of this report, which is not reflected in this report, and Phillip Securities Research, or persons associated with or connected to Phillip Securities Research, including but not limited to its officers, directors, employees or persons involved in the issuance of this report, may, to the extent permitted by law, have acted upon or used the information prior to or immediately following its publication. Phillip Securities Research, or persons associated with or connected to Phillip Securities Research, including but not limited its officers, directors, employees or persons involved in the issuance of this report, may have issued other material that is inconsistent with, or reach different conclusions from, the contents of this report.
The information, tools and material presented herein are not directed, intended for distribution to or use by, any person or entity in any jurisdiction or country where such distribution, publication, availability or use would be contrary to the applicable law or regulation or which would subject Phillip Securities Research to any registration or licensing or other requirement, or penalty for contravention of such requirements within such jurisdiction.
This report is intended for general circulation only and does not take into account the specific investment objectives, financial situation or particular needs of any particular person. The products mentioned in this report may not be suitable for all investors and a person receiving or reading this report should seek advice from a professional and financial adviser regarding the legal, business, financial, tax and other aspects including the suitability of such products, taking into account the specific investment objectives, financial situation or particular needs of that person, before making a commitment to invest in any of such products.
This report is not intended for distribution, publication to or use by any person in any jurisdiction outside of Singapore or any other jurisdiction as Phillip Securities Research may determine in its absolute discretion.
IMPORTANT DISCLOSURES FOR INCLUDED RESEARCH ANALYSES OR REPORTS OF FOREIGN RESEARCH HOUSE
Where the report contains research analyses or reports from a foreign research house, please note:

Jeremy specialises in Technical Analysis and has 10 years of experience in studying price action. His areas of expertise include intermarket analysis on the equities, currencies, commodities and bonds market.
He is also a regular columnist on The Business Times - every Monday ChartPoint column.
He graduated with a Bachelor of Science in Banking and Finance from University of London.
