
This article was published in Business Times’ column “Chart Point” on 26 February 2018.
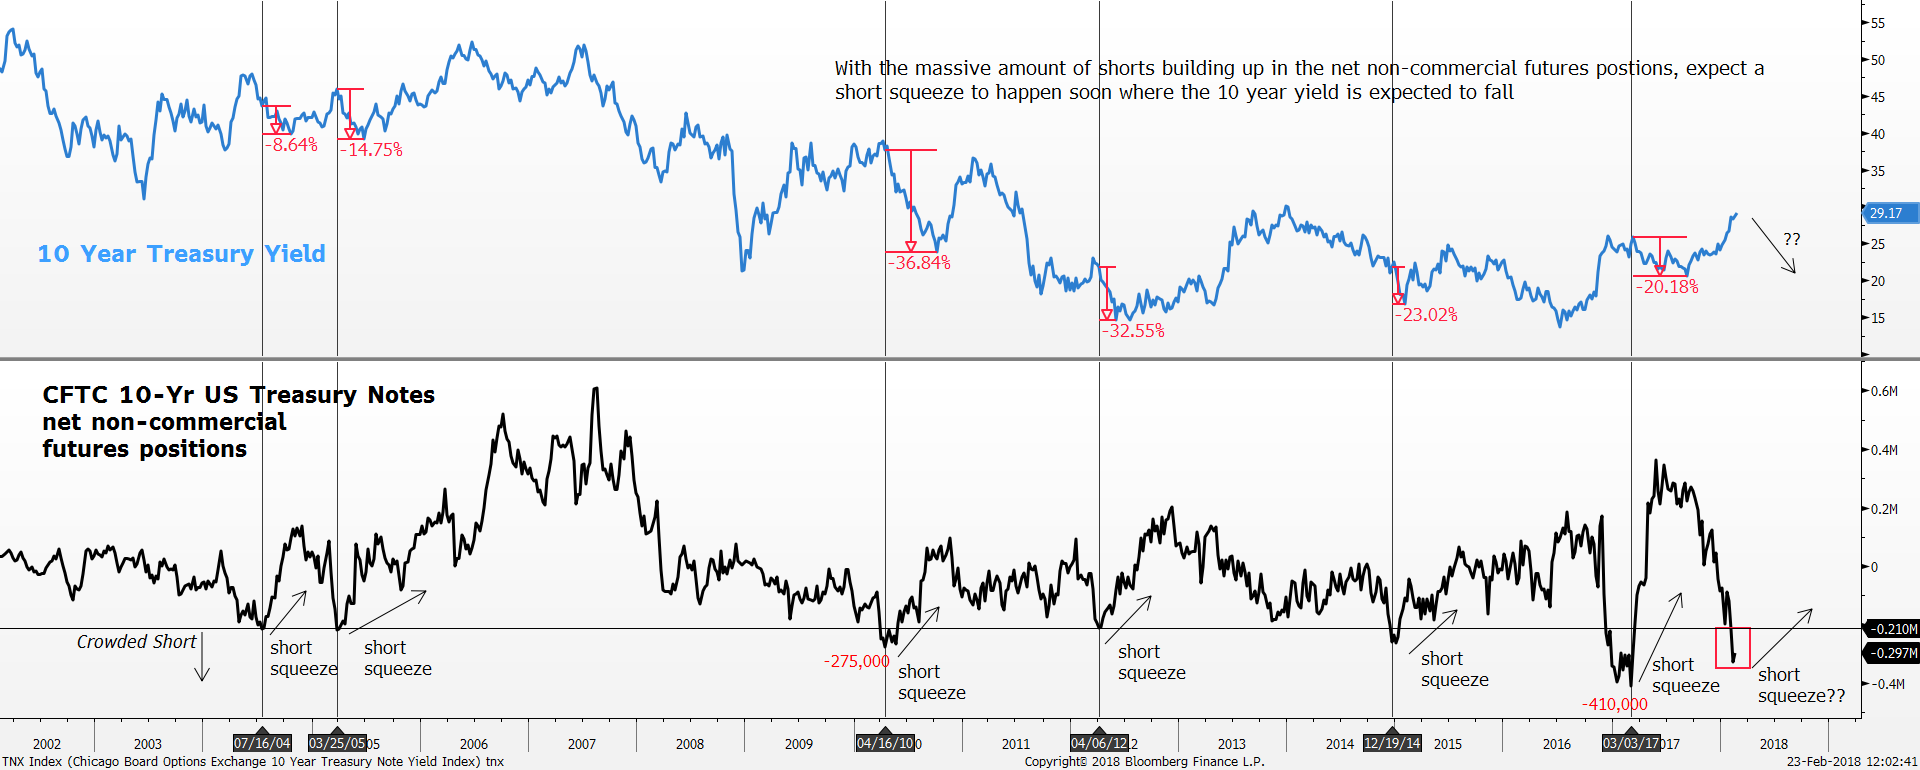
10-year Treasury yield vs CFTC 10-Yr US Treasury Notes net non-commercial futures positions Weekly Timeframe Chart
*Vertical line demarcates the point the where the short squeeze began
Since January 2018, the 10-year Treasury yield has risen 49 basis points to the current high of 2.92% as the market anticipates three more rate hikes this year. However, moving forward, we do not expect this trend to continue and see limited upside in 10-year Treasury yield due to the overcrowded shorts in the bond complex that has been building up since February.
Keep in mind the correlation between bond yield and bond price are inverse. In other words, a rising bond yield will equate to a falling bond price, vice versa. The 10-year yield is closely watched as a key benchmark that prices other interest rates such as mortgage rates.
The Commodity Futures Trading Commission (CFTC) net speculative positioning barely exceeds below –210,000 contracts. When it does, short squeeze tends to happen as the market is heavily tilted on the short side. There were six occasions when the market was massively short the 10-year Treasury bond, and the implication was a rise in bond price and a fall in yield as the market goes into a period of short squeeze. On average, the 10-year yield fell -22%.
The short squeezes were more pronounced when the bond yield is near a high (relatively low bond price) as speculators are more susceptible to a sudden rise in bond price or drop in bond yield. During a short squeeze, the crowd is forced to unwind their positions as they are caught by surprise. As more of the short speculators unwind their shorts, further buying enters into the market triggering more stop losses. Thus, lifting the bond price higher and bond yield lower.
For example, in April 2010, the CFTC net non-commercial futures positions exceeded the extreme short side and hit a low of -275,000 contracts. Prior to that, the 10-year yield was rising from 3.21% to 3.88%. Therefore, when the short squeeze occurred, we saw a sharp drop in the 10-year Treasury yield. Once the short covering happened after April 2010, the 10-year yield fell 36% from 3.77% to 2.38% over the next six months.
A more recent example a short squeeze happened somewhere in March 2017 where the CFTC net non-commercial futures positions breached new record lows at -410,000 contracts, way exceeding the extreme zone of -210,000 contracts. Just before the market experienced the short squeeze, the 10-year yield was moving in an uptrend too, moving from 1.36% to a high of 2.59%. Hence, with the huge move up in yield together with the extreme shorts in the futures positions, a short squeeze was unavoidable. That happened after the first week of May 2017 where the yield topped over and fell -20% from 2.58% to 2.06% over the next six months.
The current view of the futures positioning is once again building up for another imminent short squeeze on the 10-year treasury bonds as the expectations of rising inflation, growth and further rate hikes in the US led to extreme short positioning in the bond complex. The CFTC net non-commercial futures positions have once again built up to the extreme short side and currently hovers at -297,000 contracts. Thus, we expect the 10-year yield to have limited upside as the masses are already short the bond complex. Any sharp movement lower within the 10-year yield would then spark the beginning of the short squeeze and the fall in the 10-year yield. As the 10-year yield is currently trading at a relative high, this coming short squeeze is going to be a larger one, in the range of -30%. In other words, when the short squeeze happens, we expect the 10-year yield to trade back to the range of 2.20% to 2.00% area.
Keep in mind there is a strong confluence of resistance overhead as well at the 150-month moving average (i.e. 2.93%) and 3.00% psychological round number which should cap the upside movement. Moreover, the daily Relative Strength Index (RSI) had recently signalled overbought condition too at a high of 79 suggesting for a correction soon.
Important Information
This report is prepared and/or distributed by Phillip Securities Research Pte Ltd ("Phillip Securities Research"), which is a holder of a financial adviser’s licence under the Financial Advisers Act, Chapter 110 in Singapore.
By receiving or reading this report, you agree to be bound by the terms and limitations set out below. Any failure to comply with these terms and limitations may constitute a violation of law. This report has been provided to you for personal use only and shall not be reproduced, distributed or published by you in whole or in part, for any purpose. If you have received this report by mistake, please delete or destroy it, and notify the sender immediately.
The information and any analysis, forecasts, projections, expectations and opinions (collectively, the “Research”) contained in this report has been obtained from public sources which Phillip Securities Research believes to be reliable. However, Phillip Securities Research does not make any representation or warranty, express or implied that such information or Research is accurate, complete or appropriate or should be relied upon as such. Any such information or Research contained in this report is subject to change, and Phillip Securities Research shall not have any responsibility to maintain or update the information or Research made available or to supply any corrections, updates or releases in connection therewith.
Any opinions, forecasts, assumptions, estimates, valuations and prices contained in this report are as of the date indicated and are subject to change at any time without prior notice. Past performance of any product referred to in this report is not indicative of future results.
This report does not constitute, and should not be used as a substitute for, tax, legal or investment advice. This report should not be relied upon exclusively or as authoritative, without further being subject to the recipient’s own independent verification and exercise of judgment. The fact that this report has been made available constitutes neither a recommendation to enter into a particular transaction, nor a representation that any product described in this report is suitable or appropriate for the recipient. Recipients should be aware that many of the products, which may be described in this report involve significant risks and may not be suitable for all investors, and that any decision to enter into transactions involving such products should not be made, unless all such risks are understood and an independent determination has been made that such transactions would be appropriate. Any discussion of the risks contained herein with respect to any product should not be considered to be a disclosure of all risks or a complete discussion of such risks.
Nothing in this report shall be construed to be an offer or solicitation for the purchase or sale of any product. Any decision to purchase any product mentioned in this report should take into account existing public information, including any registered prospectus in respect of such product.
Phillip Securities Research, or persons associated with or connected to Phillip Securities Research, including but not limited to its officers, directors, employees or persons involved in the issuance of this report, may provide an array of financial services to a large number of corporations in Singapore and worldwide, including but not limited to commercial / investment banking activities (including sponsorship, financial advisory or underwriting activities), brokerage or securities trading activities. Phillip Securities Research, or persons associated with or connected to Phillip Securities Research, including but not limited to its officers, directors, employees or persons involved in the issuance of this report, may have participated in or invested in transactions with the issuer(s) of the securities mentioned in this report, and may have performed services for or solicited business from such issuers. Additionally, Phillip Securities Research, or persons associated with or connected to Phillip Securities Research, including but not limited to its officers, directors, employees or persons involved in the issuance of this report, may have provided advice or investment services to such companies and investments or related investments, as may be mentioned in this report.
Phillip Securities Research or persons associated with or connected to Phillip Securities Research, including but not limited to its officers, directors, employees or persons involved in the issuance of this report may, from time to time maintain a long or short position in securities referred to herein, or in related futures or options, purchase or sell, make a market in, or engage in any other transaction involving such securities, and earn brokerage or other compensation in respect of the foregoing. Investments will be denominated in various currencies including US dollars and Euro and thus will be subject to any fluctuation in exchange rates between US dollars and Euro or foreign currencies and the currency of your own jurisdiction. Such fluctuations may have an adverse effect on the value, price or income return of the investment.
To the extent permitted by law, Phillip Securities Research, or persons associated with or connected to Phillip Securities Research, including but not limited to its officers, directors, employees or persons involved in the issuance of this report, may at any time engage in any of the above activities as set out above or otherwise hold an interest, whether material or not, in respect of companies and investments or related investments, which may be mentioned in this report. Accordingly, information may be available to Phillip Securities Research, or persons associated with or connected to Phillip Securities Research, including but not limited to its officers, directors, employees or persons involved in the issuance of this report, which is not reflected in this report, and Phillip Securities Research, or persons associated with or connected to Phillip Securities Research, including but not limited to its officers, directors, employees or persons involved in the issuance of this report, may, to the extent permitted by law, have acted upon or used the information prior to or immediately following its publication. Phillip Securities Research, or persons associated with or connected to Phillip Securities Research, including but not limited its officers, directors, employees or persons involved in the issuance of this report, may have issued other material that is inconsistent with, or reach different conclusions from, the contents of this report.
The information, tools and material presented herein are not directed, intended for distribution to or use by, any person or entity in any jurisdiction or country where such distribution, publication, availability or use would be contrary to the applicable law or regulation or which would subject Phillip Securities Research to any registration or licensing or other requirement, or penalty for contravention of such requirements within such jurisdiction.
This report is intended for general circulation only and does not take into account the specific investment objectives, financial situation or particular needs of any particular person. The products mentioned in this report may not be suitable for all investors and a person receiving or reading this report should seek advice from a professional and financial adviser regarding the legal, business, financial, tax and other aspects including the suitability of such products, taking into account the specific investment objectives, financial situation or particular needs of that person, before making a commitment to invest in any of such products.
This report is not intended for distribution, publication to or use by any person in any jurisdiction outside of Singapore or any other jurisdiction as Phillip Securities Research may determine in its absolute discretion.
IMPORTANT DISCLOSURES FOR INCLUDED RESEARCH ANALYSES OR REPORTS OF FOREIGN RESEARCH HOUSE
Where the report contains research analyses or reports from a foreign research house, please note:

Jeremy specialises in Technical Analysis and has 10 years of experience in studying price action. His areas of expertise include intermarket analysis on the equities, currencies, commodities and bonds market.
He is also a regular columnist on The Business Times - every Monday ChartPoint column.
He graduated with a Bachelor of Science in Banking and Finance from University of London.
