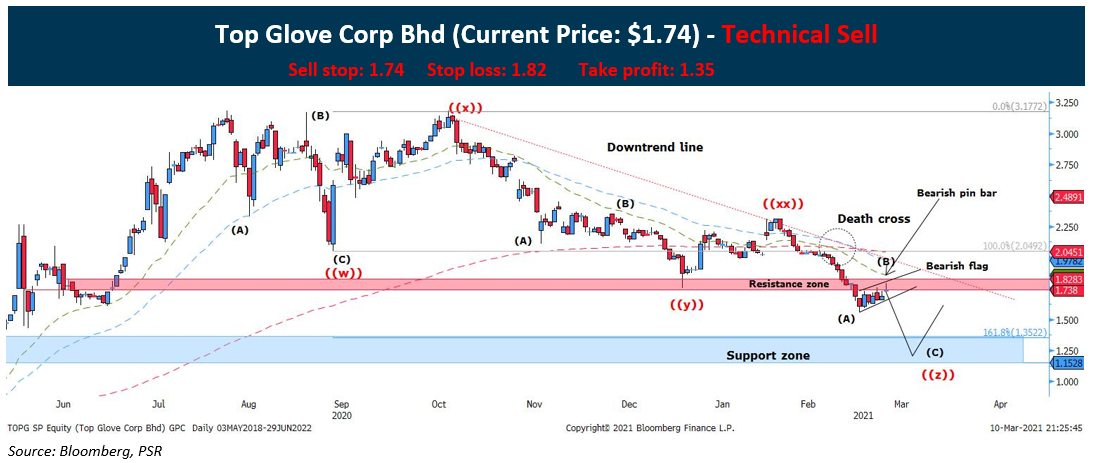
Top Glove (SGX: BVA) has been on a long correction since September 2020 last year when prices were at their highest at $3.17. Initial wave analysis pointed out to a double three corrective wave. A lack of momentum indicating the ongoing last leg of wave ((z)) of the triple corrective wave:
- The upside rebound last Wednesday after a bullish engulfing candle was not convincing as the successive candles were weak, hence, the formation of a bearish flag.
- Bearish pin bar was spotted on Wednesday after it rejected key resistance zone at $1.73-$1.82.
- Prices on a downtrend as prices still falling within the trend line.
- Prices are seen trending below all major moving averages after the death cross was formed on 18th February 2021.
- The support zone confluence with 161.8% extension level of wave ((w)). Making it an attractive area of value for a potential rebound.
*Timeline of the trade is 4 weeks from the date issued.
CHART LEGENDS
Moving Average (Exponential)
Red dotted line = 200 Periods Moving Average
Blue dotted line = 50 Periods Moving Average
Green Line B= 26 periods Moving Average