Tesla Inc (US: TSLA) Technical indicate that it is poised for an upside after a series of consolidation last week. :
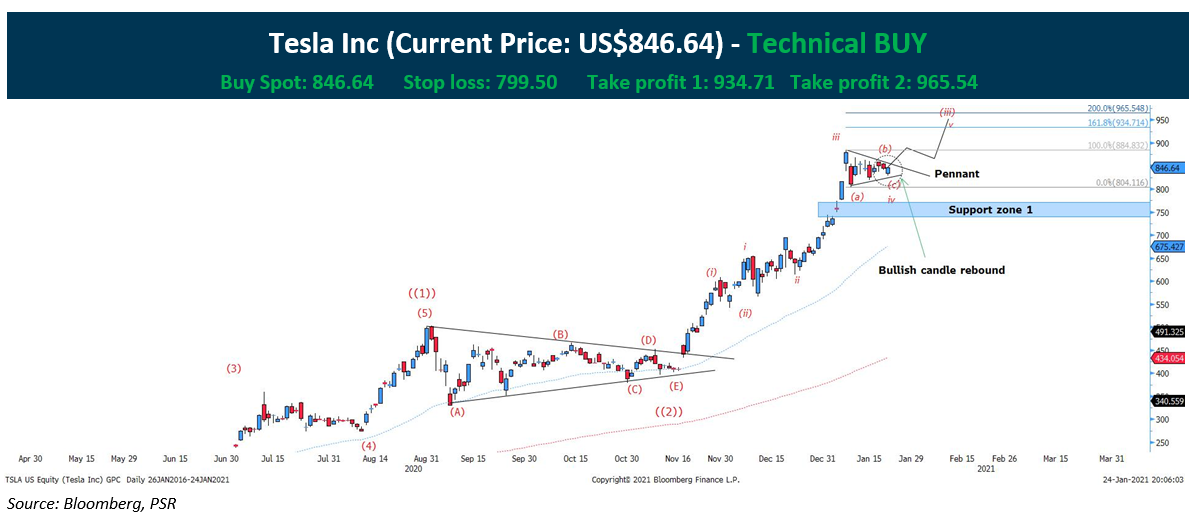
- Tesla has completed wave ((1)) of the primary phase and current wave count indicate that the wave ((3)) is far from complete. Diving into the sub-waves count, we are facing sub-extended wave (iii) which currently we have completed corrective sub-wave abc which represent wave iv of the sub-extended wave.
- The pennant formation is a smaller fractal image of the 5-wave symmetrical triangle from August 2020- November 2020. Also, the smaller pennant is an indication of a bullish continuation pattern.
- On the 3rd touch of the pennant, Tesla display a strong full body of the bullish candle, which signify a strong bullish return.
- Tesla has been making a series of higher highs and lows and with prices trending both the 50 and 200-day moving average, and the mean distance is far from the current price to the 50-day MA, which means that the stock is still in a strong bullish uptrend.
*Timeline of the trade is 4 weeks from the date issued.
*Should the stock fails to break the top of the pennant at US$884.83, the stock may revert and test the support zone at US$750 region.
CHART LEGENDS
Moving averages
Red dotted line = 200 Periods MA
Blue dotted line = 50 Periods MA
