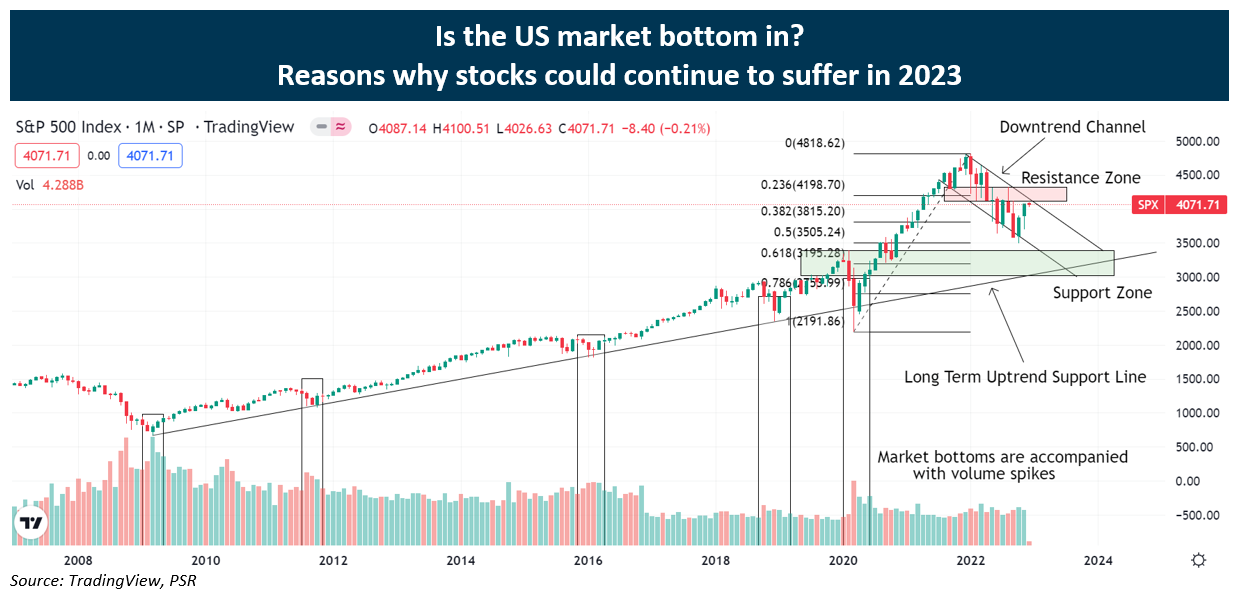
CHART LEGEND
Red box = Resistance zone
Green box = Potential market bottom zone
Since the S&P 500 sank to its year-low level at 3,491.58 points on 13 October this year, the index has rallied over 15% and is now holding above the 4,000 mark. The Volatility S&P 500 Index (VIX) or Wall Street’s “fear gauge” also fell back under 20, one of its lowest levels this year. Just recently, the Federal Reserve Chair Jerome Powell signaled for a slower pace of interest rate hikes going forward, which the central bank could implement as soon as the upcoming Fed meeting in mid December. This recent wave of positivity has led many investors to ponder if we have witnessed the bottom for stocks in this inflation crisis, and if we are finally on the upswing for good or whether they should brace for yet another temporary bear market rally.
Looking at S&P 500’s monthly chart, we are still trading within a downtrend channel formed since the market peaked in January this year, with the 4,100-4,300 points zone a strong immediate resistance area. To make a strong case that the US market has bottomed, it is preferred the index continues to pull back in this downtrend channel closer to the 3,200 mark in the support zone of 3,000-3,300 points where it meets a confluence of a 61.8% Fibonacci retracement level measuring from the March 2020 bottom to the January 2022 peak, and also a retest of the long-term uptrend support line, which dates back to the market bottom after the 2007-08 Financial Crisis. This uptrend support line has proven to be an accurate gauge for market bottoms spanning back to the bottom in 2009, as since then it has called for the bottoms that occurred in 2011, 2016, 2018 and 2020. In addition, market bottoms are accompanied with a spike in trading volumes, a sign we have not witnessed yet. The surge in volume is a good indcicator of a market bottom as it is known as “capitulation volume”. It is the dramatic surge in selling pressure in a declining market which signals the masses have thrown in the towel, and that can mark the end of a significant market downturn when a price rebound follows once the panic selling has run its course.
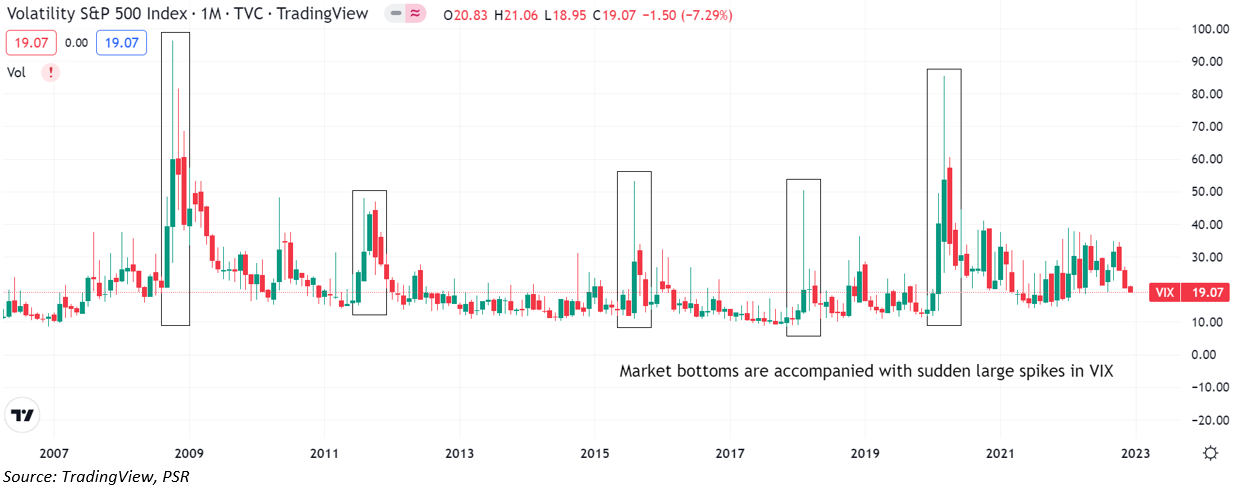
When we examine the Volatility S&P 500 Index (VIX) chart, past market bottoms have also been accompanied with sudden large spikes in the fear gauge, something we have not witnessed this year yet.
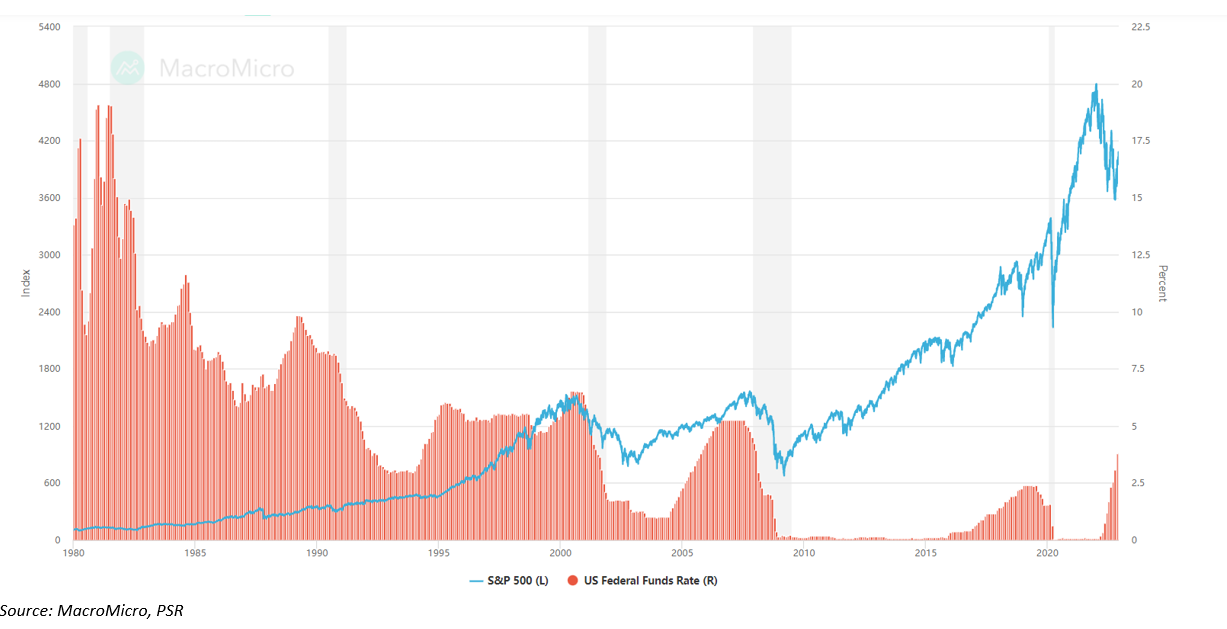
Also, investors who look forward to a Fed pivot as a signal of bear market bottoms might be disappointed by what history has to say about the performance of the stock market following it. US stocks tend not to bottom until the Fed has cut interest rates and not immediately so. Since the turn of the century, it took time for the stock market to bottom out after the central bank enacted the first rate cut in a monetary easing cycle. In the rate cut cycles that began in 2001, 2007 and 2019, it took over 600,500 and 200 calendar days respectively between the initial rate cut and the actual market bottom. Considering the lag effect for interest rate changes to exert its effects on the US economy, it makes sense that market bottoms occur much later. If the current Fed funds rate forecast holds and history repeats itself, a stock market bottom might not be in the cards until sometime after the Fed begins rate cuts in future.
All in all, things might need to get worse before they get better, and investors may have to remain patient before deciding whether an investable low in stocks has truly arrived, or not. With the VIX near the year’s support levels, it is no time to be risk on especially with so much uncertainty plaguing the outlook for stocks – dimming expectations around corporate profits with many corporations cutting their profit guidance; inflation and recessionary fears; and the Russia-Ukraine conflict among the many factors. I don’t think we have seen the bottom of this bear market yet, and it is more likely we are going through yet another bear market rally with a lower low plausible before the S&P 500 could bottom out between 3,000-3,200 points.
Important Information
This report is prepared and/or distributed by Phillip Securities Research Pte Ltd ("Phillip Securities Research"), which is a holder of a financial adviser’s licence under the Financial Advisers Act, Chapter 110 in Singapore.
By receiving or reading this report, you agree to be bound by the terms and limitations set out below. Any failure to comply with these terms and limitations may constitute a violation of law. This report has been provided to you for personal use only and shall not be reproduced, distributed or published by you in whole or in part, for any purpose. If you have received this report by mistake, please delete or destroy it, and notify the sender immediately.
The information and any analysis, forecasts, projections, expectations and opinions (collectively, the “Research”) contained in this report has been obtained from public sources which Phillip Securities Research believes to be reliable. However, Phillip Securities Research does not make any representation or warranty, express or implied that such information or Research is accurate, complete or appropriate or should be relied upon as such. Any such information or Research contained in this report is subject to change, and Phillip Securities Research shall not have any responsibility to maintain or update the information or Research made available or to supply any corrections, updates or releases in connection therewith.
Any opinions, forecasts, assumptions, estimates, valuations and prices contained in this report are as of the date indicated and are subject to change at any time without prior notice. Past performance of any product referred to in this report is not indicative of future results.
This report does not constitute, and should not be used as a substitute for, tax, legal or investment advice. This report should not be relied upon exclusively or as authoritative, without further being subject to the recipient’s own independent verification and exercise of judgment. The fact that this report has been made available constitutes neither a recommendation to enter into a particular transaction, nor a representation that any product described in this report is suitable or appropriate for the recipient. Recipients should be aware that many of the products, which may be described in this report involve significant risks and may not be suitable for all investors, and that any decision to enter into transactions involving such products should not be made, unless all such risks are understood and an independent determination has been made that such transactions would be appropriate. Any discussion of the risks contained herein with respect to any product should not be considered to be a disclosure of all risks or a complete discussion of such risks.
Nothing in this report shall be construed to be an offer or solicitation for the purchase or sale of any product. Any decision to purchase any product mentioned in this report should take into account existing public information, including any registered prospectus in respect of such product.
Phillip Securities Research, or persons associated with or connected to Phillip Securities Research, including but not limited to its officers, directors, employees or persons involved in the issuance of this report, may provide an array of financial services to a large number of corporations in Singapore and worldwide, including but not limited to commercial / investment banking activities (including sponsorship, financial advisory or underwriting activities), brokerage or securities trading activities. Phillip Securities Research, or persons associated with or connected to Phillip Securities Research, including but not limited to its officers, directors, employees or persons involved in the issuance of this report, may have participated in or invested in transactions with the issuer(s) of the securities mentioned in this report, and may have performed services for or solicited business from such issuers. Additionally, Phillip Securities Research, or persons associated with or connected to Phillip Securities Research, including but not limited to its officers, directors, employees or persons involved in the issuance of this report, may have provided advice or investment services to such companies and investments or related investments, as may be mentioned in this report.
Phillip Securities Research or persons associated with or connected to Phillip Securities Research, including but not limited to its officers, directors, employees or persons involved in the issuance of this report may, from time to time maintain a long or short position in securities referred to herein, or in related futures or options, purchase or sell, make a market in, or engage in any other transaction involving such securities, and earn brokerage or other compensation in respect of the foregoing. Investments will be denominated in various currencies including US dollars and Euro and thus will be subject to any fluctuation in exchange rates between US dollars and Euro or foreign currencies and the currency of your own jurisdiction. Such fluctuations may have an adverse effect on the value, price or income return of the investment.
To the extent permitted by law, Phillip Securities Research, or persons associated with or connected to Phillip Securities Research, including but not limited to its officers, directors, employees or persons involved in the issuance of this report, may at any time engage in any of the above activities as set out above or otherwise hold an interest, whether material or not, in respect of companies and investments or related investments, which may be mentioned in this report. Accordingly, information may be available to Phillip Securities Research, or persons associated with or connected to Phillip Securities Research, including but not limited to its officers, directors, employees or persons involved in the issuance of this report, which is not reflected in this report, and Phillip Securities Research, or persons associated with or connected to Phillip Securities Research, including but not limited to its officers, directors, employees or persons involved in the issuance of this report, may, to the extent permitted by law, have acted upon or used the information prior to or immediately following its publication. Phillip Securities Research, or persons associated with or connected to Phillip Securities Research, including but not limited its officers, directors, employees or persons involved in the issuance of this report, may have issued other material that is inconsistent with, or reach different conclusions from, the contents of this report.
The information, tools and material presented herein are not directed, intended for distribution to or use by, any person or entity in any jurisdiction or country where such distribution, publication, availability or use would be contrary to the applicable law or regulation or which would subject Phillip Securities Research to any registration or licensing or other requirement, or penalty for contravention of such requirements within such jurisdiction.
This report is intended for general circulation only and does not take into account the specific investment objectives, financial situation or particular needs of any particular person. The products mentioned in this report may not be suitable for all investors and a person receiving or reading this report should seek advice from a professional and financial adviser regarding the legal, business, financial, tax and other aspects including the suitability of such products, taking into account the specific investment objectives, financial situation or particular needs of that person, before making a commitment to invest in any of such products.
This report is not intended for distribution, publication to or use by any person in any jurisdiction outside of Singapore or any other jurisdiction as Phillip Securities Research may determine in its absolute discretion.
IMPORTANT DISCLOSURES FOR INCLUDED RESEARCH ANALYSES OR REPORTS OF FOREIGN RESEARCH HOUSE
Where the report contains research analyses or reports from a foreign research house, please note:

I analyze the stock market and conduct technical analysis to provide investment recommendations. I look forward to having a conversation with you in our in-house seminars and presentations to identify good risk-reward trading strategies together. I graduated from Nanyang Technological University with a Bachelor of Accountancy (Honours).
