*Smart money refers to capital controlled by institutional investor like the big banks, central banks and large funds.
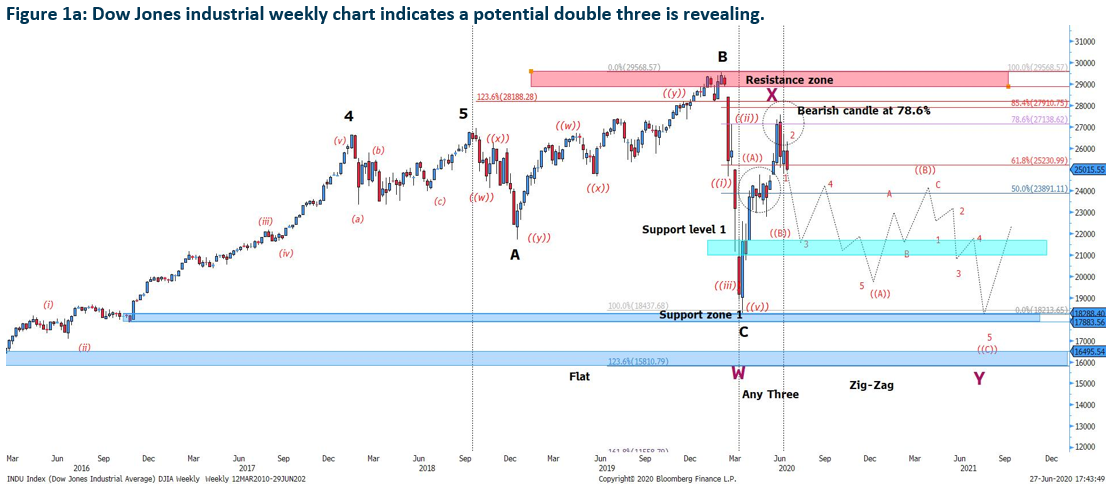
After the index reached the 78.6% Fibonacci retracement of wave W (highlighted in purple), the sell-down last week is moving closer to a potential wave 3 ahead should the immediate support at 24,681 is broken.
Potential immediate rebound will be at 21,430-20,744 region (highlighted in teal).
Future movement of the zig-zag wave of the double three still holds unless the resistance zone at 28,889 and 29,548 is invalidated.
*Double three is a complex corrective wave which consists of Flat, Any Three and Zig-Zag
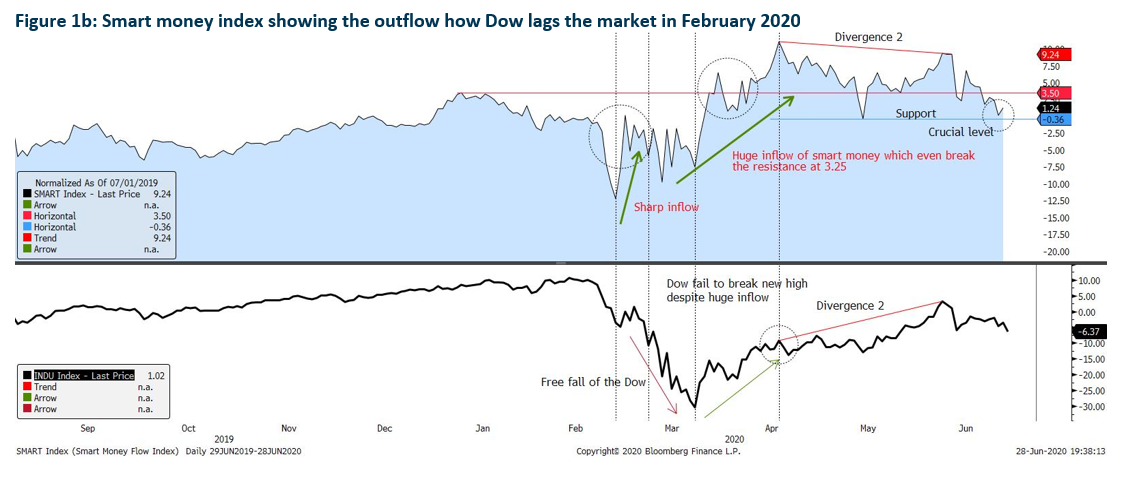
The smart money flow index indicates that prices had a major divergence point since February 2020 during the sell down which saw Dow plunged more than 10,000 points within 3 weeks. Despite sharp inflow in February 2020, the Dow continued to fall. This means the smart money is not enough to support the market. Next, the market began to recover after Dow hit rock bottom at the 18,000 region. The smart money did break the resistance at 3.50%. However, Dow still significantly lacks behind the market with the momentum corrective with flat lines.
The Divergence 2 shows for the first time that Dow continues to rise with the smart money inflow reluctantly flowing out below 10.00. Which in turn forms a divergence. Whenever a divergence happens, it signifies a mismatch and the Dow soon find itself unable to sustain and prices begin to fall.
Crucial support level at -0.36% indicates a break will see further stronger outflow which may see the Dow falling further.
*The value on the y-axis is describing the % percentage rate of change.
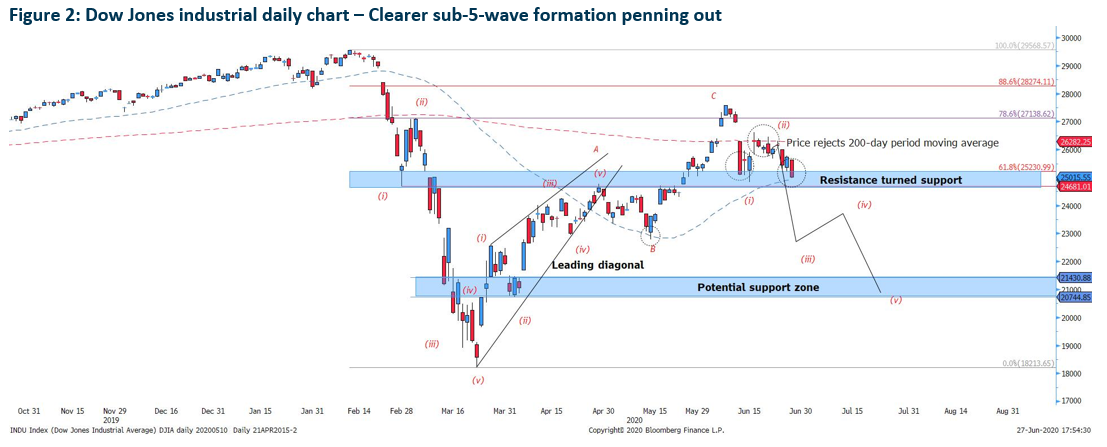
The momentum on Dow’s daily chart played out according to our report on 15th June when prices reverse at 26,586 after filling the gap. The continuous rejection of the 200-day period moving average indicates a weakness in the bullish momentum.
The ultimate test is when prices remain within the support zone at 24,681-25,015. Should it break below the support zone, prices could travel to 23,000 psychological support to form wave 3. However, should 23,000 be strongly broken, there is a likelihood of Wave 3 terminating at the support zone at 21,430-20,744.
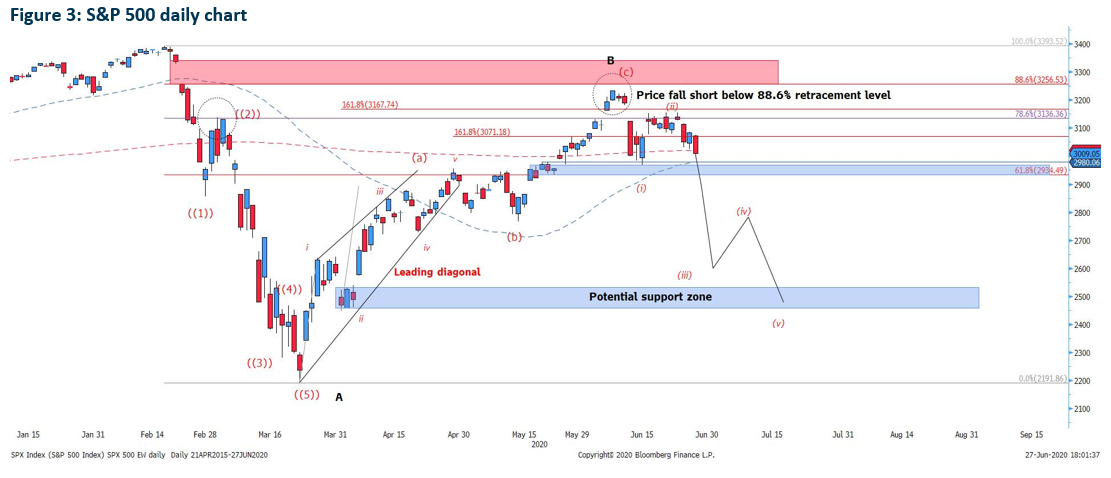
Unlike the Dow Jones Industrial Average, the S&P 500 is still far from the support zone, with the index hovering above it by 29 points and still closing above the 3,000 psychological level along with the 200-day period moving average. However, the momentum and price action suggest that the S&P 500 should be testing and breaking the support zone at 2,980-2,934.
Potential mid-term rebound is at 2,330-2,522
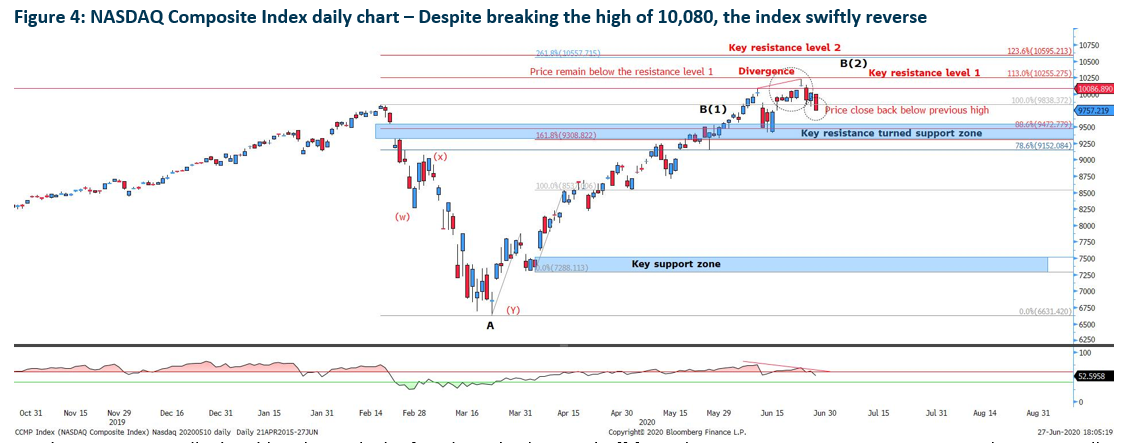
Nasdaq Composite rallied and break new high after the index bounced off from the support at 9,500 region. Despite the strong rally, Nasdaq swiftly reversed after hitting the psychological resistance at 10,250, forming a graveyard doji. The index subsequently moved below 10,000 and the index may be testing the key resistance turned support zone at 9,308-9,500.
Should the index find itself supported at 9,308-9,500, the possibility of an expanding/running flat is still possible as it may gather enough momentum to test the high at 10,595, which is the extension level 123.6% of wave A.
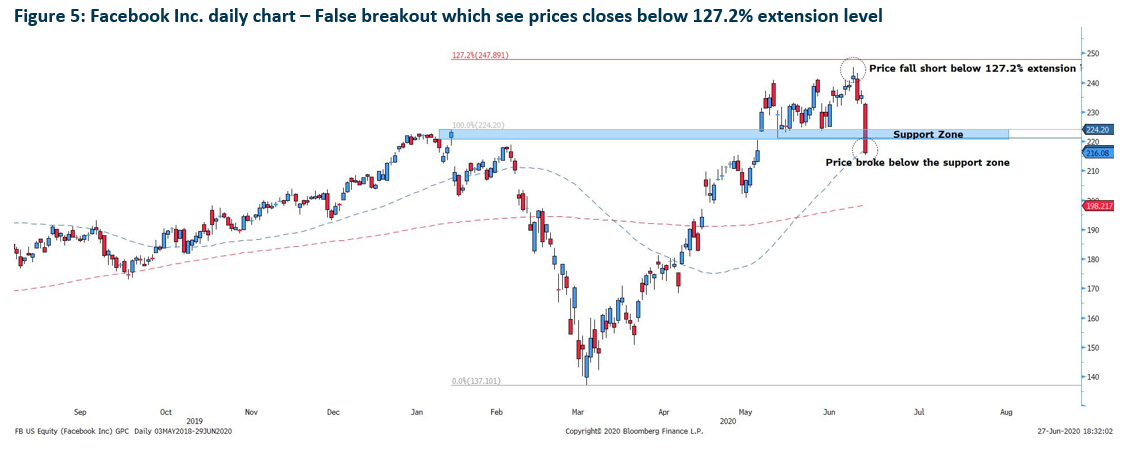
Facebook had a false breakout when the stock made a final attempt to rally after a bullish engulfing candle after the hammer on 16th June which we mention on 15th June report. Facebook strong sell-down on Friday sees the prices close below the support zone at US$224.20. As such, we believe that Facebook will test the next support level at US$199.22.
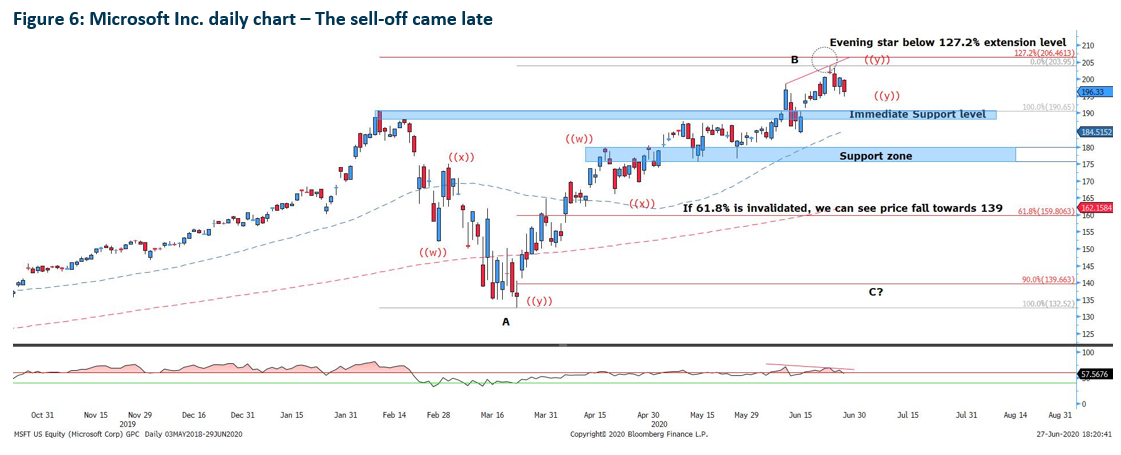
Microsoft sell-off came 2 days later after the stock failed to cross above US$204.00. There was a divergence based on our recent report on 22nd June but the price rallied nonetheless. The rally was nothing but a false breakout with the Relative Strength index (RSI) showing a bearish divergence still. Furthermore, the failure to reach 127.2% and an evening star formation below it strengthen the selling further.
With prices closing back below the US$200.00 psychological level, the stock is looking to test the immediate support level at US$190.65-US$188.00.
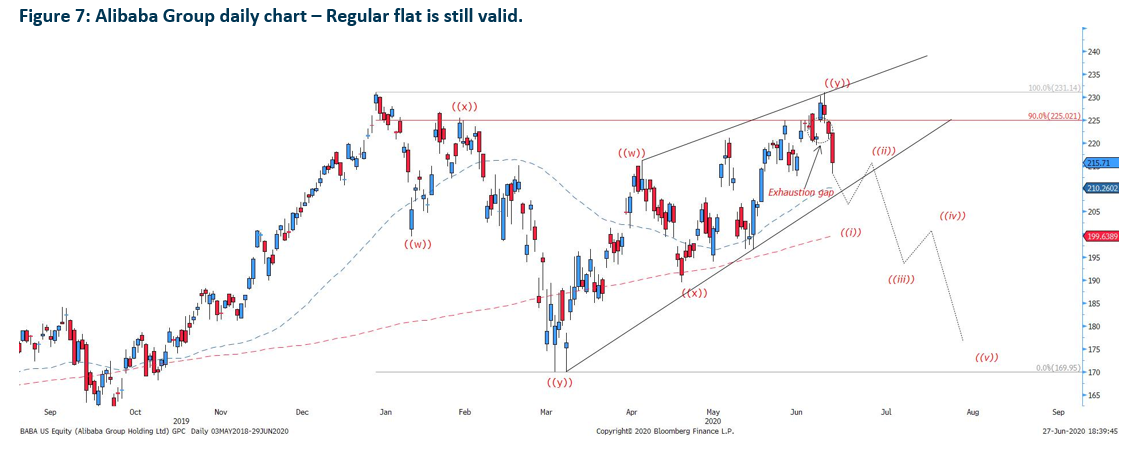
In our recent report on 22nd June, the report indicated that Alibaba is on the 3-3-5 regular flat after a strong bearish candle rejecting 90% of wave A. Despite the price reversing higher, the stock failed to close above US$230.00 and it actually forms a tweezer top. The bearish sell-down thereafter closed up the gap. It shows that the gap is an exhaustion gap. In other words, the bullish momentum is seen to be weakening.
Subsequent sell-down sees price return below the psychological support at US$220.00 and the stock may attempt to break the lower bound of the rising wedge.
Important Information
This report is prepared and/or distributed by Phillip Securities Research Pte Ltd ("Phillip Securities Research"), which is a holder of a financial adviser’s licence under the Financial Advisers Act, Chapter 110 in Singapore.
By receiving or reading this report, you agree to be bound by the terms and limitations set out below. Any failure to comply with these terms and limitations may constitute a violation of law. This report has been provided to you for personal use only and shall not be reproduced, distributed or published by you in whole or in part, for any purpose. If you have received this report by mistake, please delete or destroy it, and notify the sender immediately.
The information and any analysis, forecasts, projections, expectations and opinions (collectively, the “Research”) contained in this report has been obtained from public sources which Phillip Securities Research believes to be reliable. However, Phillip Securities Research does not make any representation or warranty, express or implied that such information or Research is accurate, complete or appropriate or should be relied upon as such. Any such information or Research contained in this report is subject to change, and Phillip Securities Research shall not have any responsibility to maintain or update the information or Research made available or to supply any corrections, updates or releases in connection therewith.
Any opinions, forecasts, assumptions, estimates, valuations and prices contained in this report are as of the date indicated and are subject to change at any time without prior notice. Past performance of any product referred to in this report is not indicative of future results.
This report does not constitute, and should not be used as a substitute for, tax, legal or investment advice. This report should not be relied upon exclusively or as authoritative, without further being subject to the recipient’s own independent verification and exercise of judgment. The fact that this report has been made available constitutes neither a recommendation to enter into a particular transaction, nor a representation that any product described in this report is suitable or appropriate for the recipient. Recipients should be aware that many of the products, which may be described in this report involve significant risks and may not be suitable for all investors, and that any decision to enter into transactions involving such products should not be made, unless all such risks are understood and an independent determination has been made that such transactions would be appropriate. Any discussion of the risks contained herein with respect to any product should not be considered to be a disclosure of all risks or a complete discussion of such risks.
Nothing in this report shall be construed to be an offer or solicitation for the purchase or sale of any product. Any decision to purchase any product mentioned in this report should take into account existing public information, including any registered prospectus in respect of such product.
Phillip Securities Research, or persons associated with or connected to Phillip Securities Research, including but not limited to its officers, directors, employees or persons involved in the issuance of this report, may provide an array of financial services to a large number of corporations in Singapore and worldwide, including but not limited to commercial / investment banking activities (including sponsorship, financial advisory or underwriting activities), brokerage or securities trading activities. Phillip Securities Research, or persons associated with or connected to Phillip Securities Research, including but not limited to its officers, directors, employees or persons involved in the issuance of this report, may have participated in or invested in transactions with the issuer(s) of the securities mentioned in this report, and may have performed services for or solicited business from such issuers. Additionally, Phillip Securities Research, or persons associated with or connected to Phillip Securities Research, including but not limited to its officers, directors, employees or persons involved in the issuance of this report, may have provided advice or investment services to such companies and investments or related investments, as may be mentioned in this report.
Phillip Securities Research or persons associated with or connected to Phillip Securities Research, including but not limited to its officers, directors, employees or persons involved in the issuance of this report may, from time to time maintain a long or short position in securities referred to herein, or in related futures or options, purchase or sell, make a market in, or engage in any other transaction involving such securities, and earn brokerage or other compensation in respect of the foregoing. Investments will be denominated in various currencies including US dollars and Euro and thus will be subject to any fluctuation in exchange rates between US dollars and Euro or foreign currencies and the currency of your own jurisdiction. Such fluctuations may have an adverse effect on the value, price or income return of the investment.
To the extent permitted by law, Phillip Securities Research, or persons associated with or connected to Phillip Securities Research, including but not limited to its officers, directors, employees or persons involved in the issuance of this report, may at any time engage in any of the above activities as set out above or otherwise hold an interest, whether material or not, in respect of companies and investments or related investments, which may be mentioned in this report. Accordingly, information may be available to Phillip Securities Research, or persons associated with or connected to Phillip Securities Research, including but not limited to its officers, directors, employees or persons involved in the issuance of this report, which is not reflected in this report, and Phillip Securities Research, or persons associated with or connected to Phillip Securities Research, including but not limited to its officers, directors, employees or persons involved in the issuance of this report, may, to the extent permitted by law, have acted upon or used the information prior to or immediately following its publication. Phillip Securities Research, or persons associated with or connected to Phillip Securities Research, including but not limited its officers, directors, employees or persons involved in the issuance of this report, may have issued other material that is inconsistent with, or reach different conclusions from, the contents of this report.
The information, tools and material presented herein are not directed, intended for distribution to or use by, any person or entity in any jurisdiction or country where such distribution, publication, availability or use would be contrary to the applicable law or regulation or which would subject Phillip Securities Research to any registration or licensing or other requirement, or penalty for contravention of such requirements within such jurisdiction.
This report is intended for general circulation only and does not take into account the specific investment objectives, financial situation or particular needs of any particular person. The products mentioned in this report may not be suitable for all investors and a person receiving or reading this report should seek advice from a professional and financial adviser regarding the legal, business, financial, tax and other aspects including the suitability of such products, taking into account the specific investment objectives, financial situation or particular needs of that person, before making a commitment to invest in any of such products.
This report is not intended for distribution, publication to or use by any person in any jurisdiction outside of Singapore or any other jurisdiction as Phillip Securities Research may determine in its absolute discretion.
IMPORTANT DISCLOSURES FOR INCLUDED RESEARCH ANALYSES OR REPORTS OF FOREIGN RESEARCH HOUSE
Where the report contains research analyses or reports from a foreign research house, please note:
