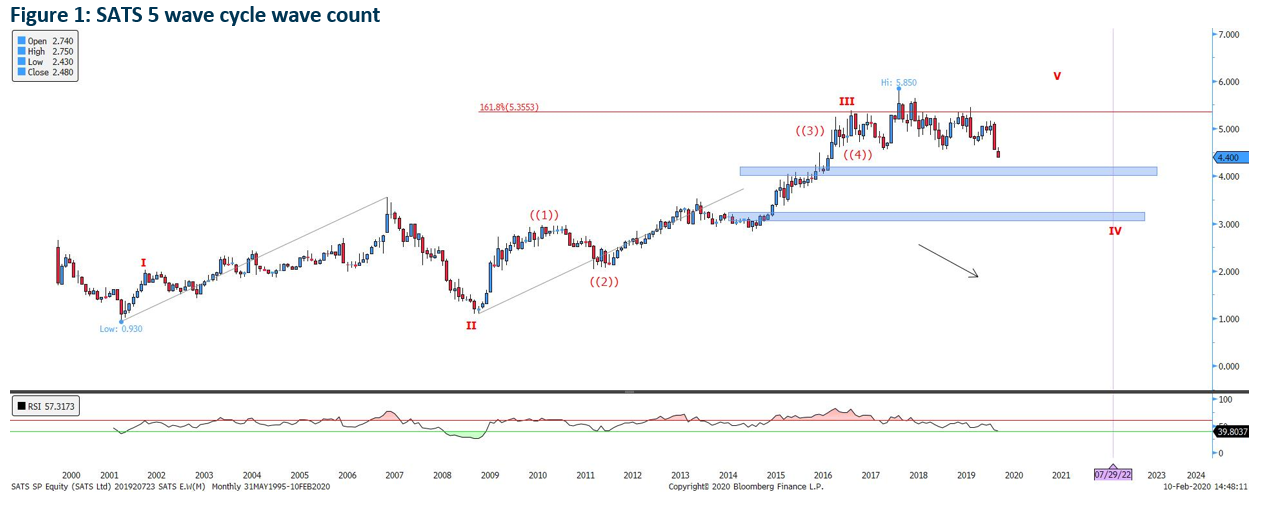
The cycle wave count of the Elliott wave suggests that SATS have completed its third wave at $5.35 in 2017 January. Subsequent formations of the head-and-shoulder as well as the wave analysis suggest that the stock may be heading into a complex flat (3-3-5) corrective action.
The two key potential reversal zones are between 3.05 – 3.24 and 4.10 – 4.20 that are highlighted in blue.
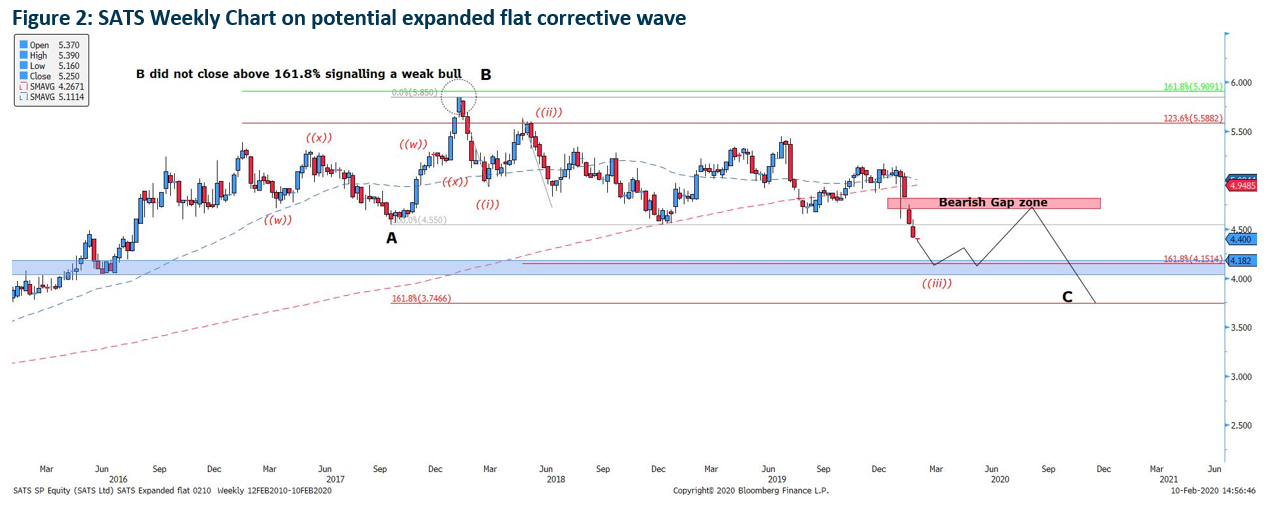
The weekly wave count of the potential expanded wave count shows a clearer direction of the stock price movement. Although wave B of the larger degree broke the supposed extension level of 123.6%, the price of SATS did not break or stabilise at the 161.8% invalidation level, hence the wave B is considered a weak bull run and can be regarded as a false breakout.
Subsequent wave momentum indicates that SATS is in a corrective 5-wave movement down and current price movement suggests that the stock price is on its way to form the ((iii)) leg of the greater wave C. Hence, we believe that prices may continue its further downside to between $4.10 – $4.20.
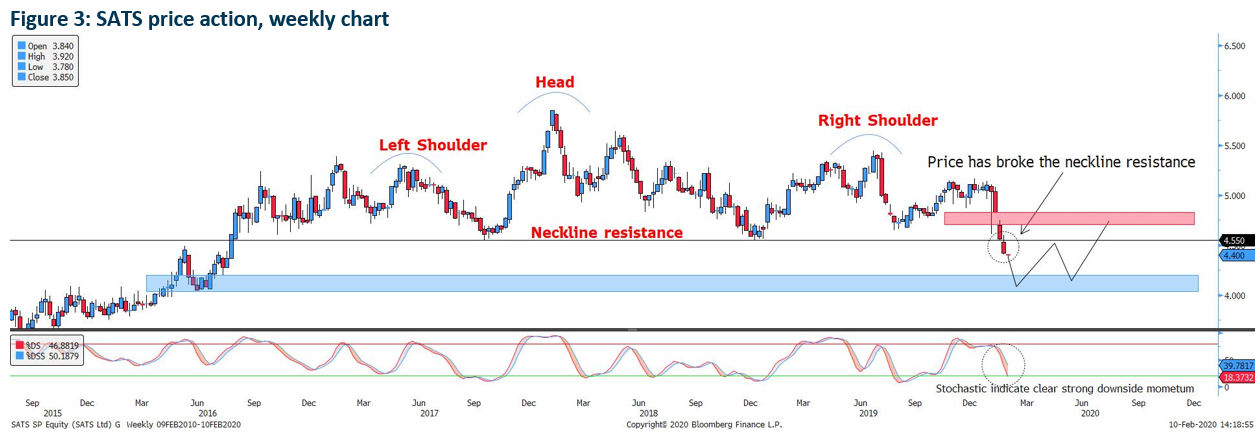
SATS’ price action analysis suggests that its price has broken the neckline resistance at $5.50 of the head-and-shoulder formation. The break below the neckline resistance suggests that the stock will continue a bearish downtrend. The stochastic oscillator also has an additional confirmation where the indicator shows a strong downside momentum whereby the K and D % line seem to be breaking below the 20 oversold line, suggesting that there is ample supply in the market to fuel the downtrend.
Therefore, investors should take a short bias trading the counter now and watch for the the potential corrective rebound between $4.10 – $4.20 highlighted in blue. However, investors should also note that there might be a swift reversal towards the bearish gap zone highlighted in red.
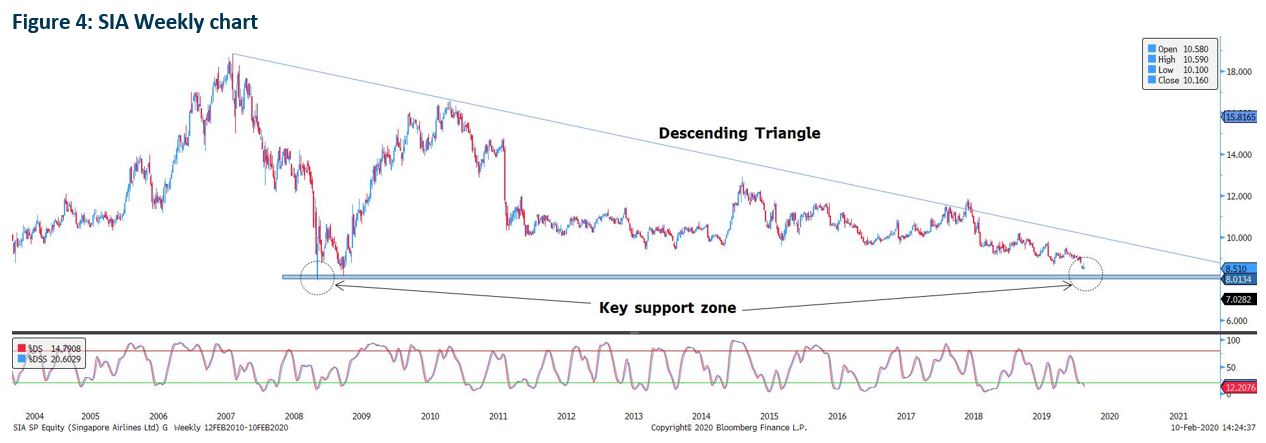
SIA has experienced a strong downtrend when prices failed to break higher in 2010 after the 2008 financial meltdown. The subsequent reversal at 16.52 in 2010 also indicates that SIA’s bullish momentum is limited. Chart pattern analysis suggests that the stock might be forming a descending triangle between 2008 – 2019. Although the key support zone highlighted has not been met, we believe that the rebound from the support zone may be short-lived as the dominant trend is still on the downside. The downtrend will continue unless the $9.50 psychological resistance level is broken to invalidate the descending triangle formation.
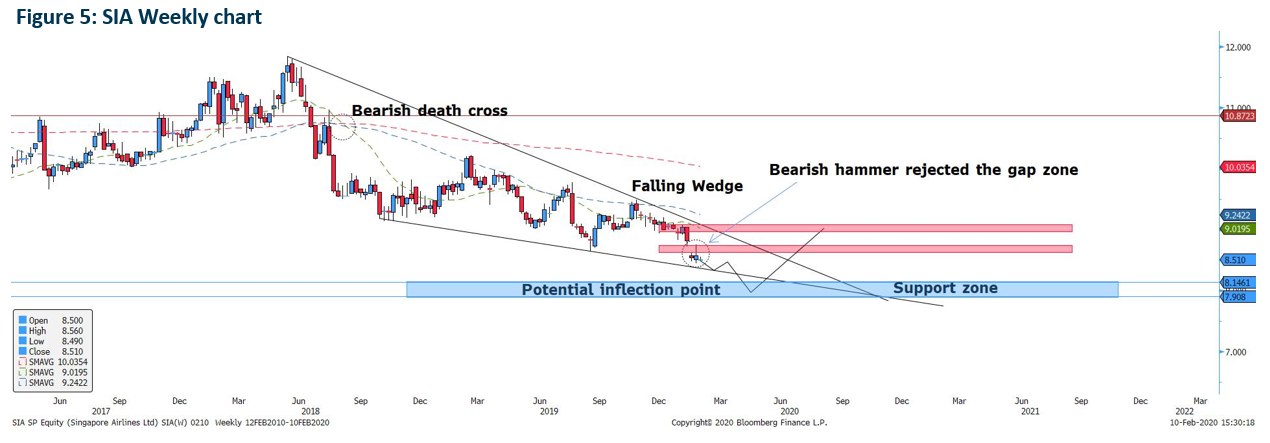
On a closer look, the stock is forming a falling wedge formation which indicates that prices may have a bullish outbreak soon. However, the bearish hammer last week shows a rejection of the gap zone which indicates a further sell down. Bearish death cross seen in July 2018 shows further evidence of a bearish trend with prices still trending below 200, 50 and 22-SMA.
Price action suggests that the potential inflection point remains at $7.90 – $8.14 as the falling wedge formation has not been invalidated. Traders looking to buy SIA could watch closely as price move towards the price zone. However, the bullish bias of the rebound may be short-lived as the supply level at 9.00 region seem to indicate a strong supply.
Important Information
This report is prepared and/or distributed by Phillip Securities Research Pte Ltd ("Phillip Securities Research"), which is a holder of a financial adviser’s licence under the Financial Advisers Act, Chapter 110 in Singapore.
By receiving or reading this report, you agree to be bound by the terms and limitations set out below. Any failure to comply with these terms and limitations may constitute a violation of law. This report has been provided to you for personal use only and shall not be reproduced, distributed or published by you in whole or in part, for any purpose. If you have received this report by mistake, please delete or destroy it, and notify the sender immediately.
The information and any analysis, forecasts, projections, expectations and opinions (collectively, the “Research”) contained in this report has been obtained from public sources which Phillip Securities Research believes to be reliable. However, Phillip Securities Research does not make any representation or warranty, express or implied that such information or Research is accurate, complete or appropriate or should be relied upon as such. Any such information or Research contained in this report is subject to change, and Phillip Securities Research shall not have any responsibility to maintain or update the information or Research made available or to supply any corrections, updates or releases in connection therewith.
Any opinions, forecasts, assumptions, estimates, valuations and prices contained in this report are as of the date indicated and are subject to change at any time without prior notice. Past performance of any product referred to in this report is not indicative of future results.
This report does not constitute, and should not be used as a substitute for, tax, legal or investment advice. This report should not be relied upon exclusively or as authoritative, without further being subject to the recipient’s own independent verification and exercise of judgment. The fact that this report has been made available constitutes neither a recommendation to enter into a particular transaction, nor a representation that any product described in this report is suitable or appropriate for the recipient. Recipients should be aware that many of the products, which may be described in this report involve significant risks and may not be suitable for all investors, and that any decision to enter into transactions involving such products should not be made, unless all such risks are understood and an independent determination has been made that such transactions would be appropriate. Any discussion of the risks contained herein with respect to any product should not be considered to be a disclosure of all risks or a complete discussion of such risks.
Nothing in this report shall be construed to be an offer or solicitation for the purchase or sale of any product. Any decision to purchase any product mentioned in this report should take into account existing public information, including any registered prospectus in respect of such product.
Phillip Securities Research, or persons associated with or connected to Phillip Securities Research, including but not limited to its officers, directors, employees or persons involved in the issuance of this report, may provide an array of financial services to a large number of corporations in Singapore and worldwide, including but not limited to commercial / investment banking activities (including sponsorship, financial advisory or underwriting activities), brokerage or securities trading activities. Phillip Securities Research, or persons associated with or connected to Phillip Securities Research, including but not limited to its officers, directors, employees or persons involved in the issuance of this report, may have participated in or invested in transactions with the issuer(s) of the securities mentioned in this report, and may have performed services for or solicited business from such issuers. Additionally, Phillip Securities Research, or persons associated with or connected to Phillip Securities Research, including but not limited to its officers, directors, employees or persons involved in the issuance of this report, may have provided advice or investment services to such companies and investments or related investments, as may be mentioned in this report.
Phillip Securities Research or persons associated with or connected to Phillip Securities Research, including but not limited to its officers, directors, employees or persons involved in the issuance of this report may, from time to time maintain a long or short position in securities referred to herein, or in related futures or options, purchase or sell, make a market in, or engage in any other transaction involving such securities, and earn brokerage or other compensation in respect of the foregoing. Investments will be denominated in various currencies including US dollars and Euro and thus will be subject to any fluctuation in exchange rates between US dollars and Euro or foreign currencies and the currency of your own jurisdiction. Such fluctuations may have an adverse effect on the value, price or income return of the investment.
To the extent permitted by law, Phillip Securities Research, or persons associated with or connected to Phillip Securities Research, including but not limited to its officers, directors, employees or persons involved in the issuance of this report, may at any time engage in any of the above activities as set out above or otherwise hold an interest, whether material or not, in respect of companies and investments or related investments, which may be mentioned in this report. Accordingly, information may be available to Phillip Securities Research, or persons associated with or connected to Phillip Securities Research, including but not limited to its officers, directors, employees or persons involved in the issuance of this report, which is not reflected in this report, and Phillip Securities Research, or persons associated with or connected to Phillip Securities Research, including but not limited to its officers, directors, employees or persons involved in the issuance of this report, may, to the extent permitted by law, have acted upon or used the information prior to or immediately following its publication. Phillip Securities Research, or persons associated with or connected to Phillip Securities Research, including but not limited its officers, directors, employees or persons involved in the issuance of this report, may have issued other material that is inconsistent with, or reach different conclusions from, the contents of this report.
The information, tools and material presented herein are not directed, intended for distribution to or use by, any person or entity in any jurisdiction or country where such distribution, publication, availability or use would be contrary to the applicable law or regulation or which would subject Phillip Securities Research to any registration or licensing or other requirement, or penalty for contravention of such requirements within such jurisdiction.
This report is intended for general circulation only and does not take into account the specific investment objectives, financial situation or particular needs of any particular person. The products mentioned in this report may not be suitable for all investors and a person receiving or reading this report should seek advice from a professional and financial adviser regarding the legal, business, financial, tax and other aspects including the suitability of such products, taking into account the specific investment objectives, financial situation or particular needs of that person, before making a commitment to invest in any of such products.
This report is not intended for distribution, publication to or use by any person in any jurisdiction outside of Singapore or any other jurisdiction as Phillip Securities Research may determine in its absolute discretion.
IMPORTANT DISCLOSURES FOR INCLUDED RESEARCH ANALYSES OR REPORTS OF FOREIGN RESEARCH HOUSE
Where the report contains research analyses or reports from a foreign research house, please note:
