Market breadth, often known as an internal market indicator, is commonly used in the financial markets to provide insights on the overall health of an index, helping investors gauge the level of participation and broad-based buying or selling in the market. It refers to the number and performance of individual stocks within an index, analyzing the number of securities advancing relative to those declining.
Positive breadth occurs when more stocks are advancing than are declining which suggests the market’s bullish momentum and helps confirm a price rise in the index. Conversely, negative breadth is present with a greater number of declining securities and is used to confirm bearish momentum and a downside move in the index. Certain breadth indicators also incorporate volume as price moves on larger volume are considered to be more significant than price moves on lower volume.
Example of Breadth Indicators:
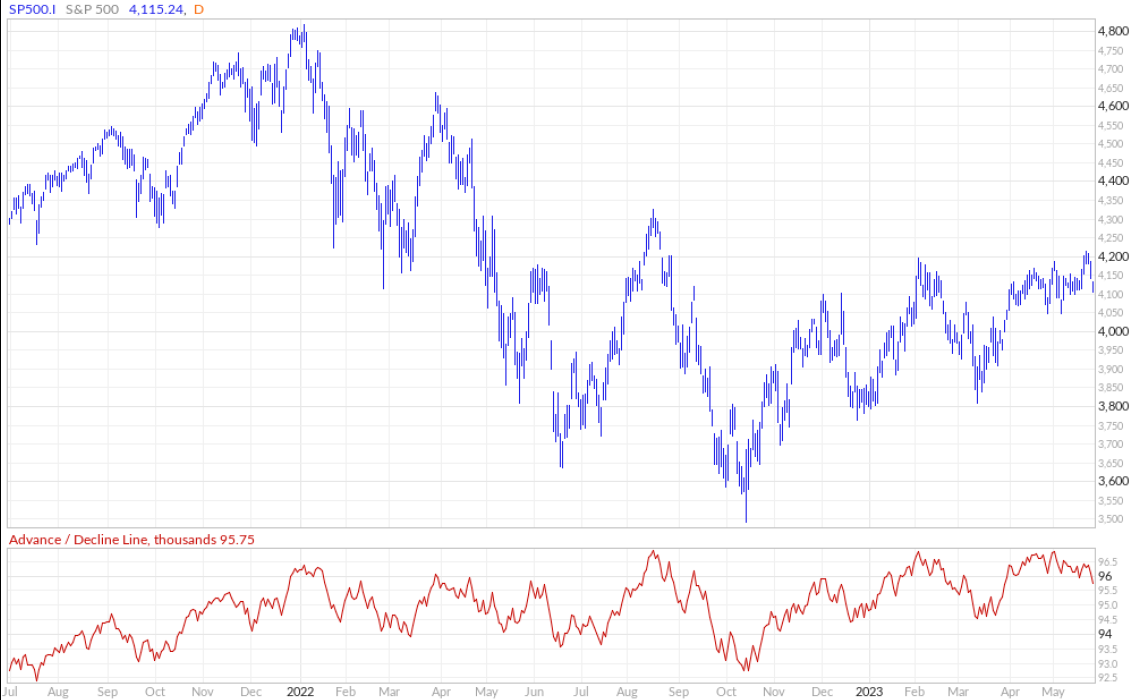
The Advance-Decline (A/D) Line
The Advance-Decline (A/D) Line is a breadth indicator calculated by taking the difference between the number of advancers and decliners for an index, and adding the result to the previous value. It rises when advances exceed declines and falls when declines exceed advances.
Looking at Advance-Decline (A/D) chart, the market tends to reverse from a swing high when the A/D reaches 96,000 and above while an A/D value of 94,000 and below tends to mark a swing low in the index. While the A/D indicator tends to be more accurate to predict short term peaks when it reaches the 96,000 mark, it can hover at the area for a prolonged period as shown in the past 2 months leading the index to sideways instead of retracing. Also, the index can mark short-term bottoms only when the A/D goes further below the 94,000 level sometimes. Thus, this indicator does not serve as a good lead indicator of the upcoming market direction.
Source: MarketInOut, PSR
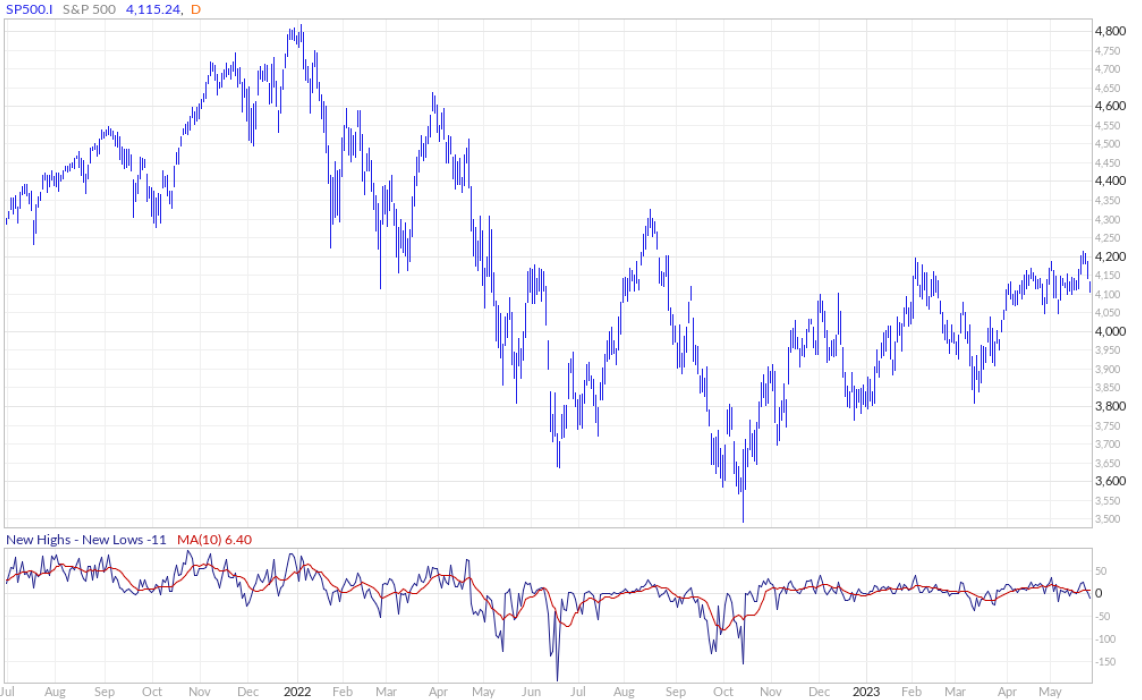
New Highs-Lows Index
The New Highs-Lows indicator displays the daily difference between the number of stocks reaching new 52-week highs and the number of stocks reaching new 52-week lows.
Looking at the New Highs-Lows chart, it is a weaker breadth indicator than the Advance Decline (A/D) Line as there is no specific threshold figure to mark short term peaks and troughs in the S&P 500. In 2022, a reading of -100 and below tended to put in short term troughs in the index and a reading of slightly above 0 tended to point towards a short-term peak. However, this was not the case this year as the index marked a short-term high with a reading close to 50, while a short term low tended to form with a reading close to -50. With that, this indicator does not serve as a good lead indicator of the upcoming market direction too.
Source: MarketInOut, PSR
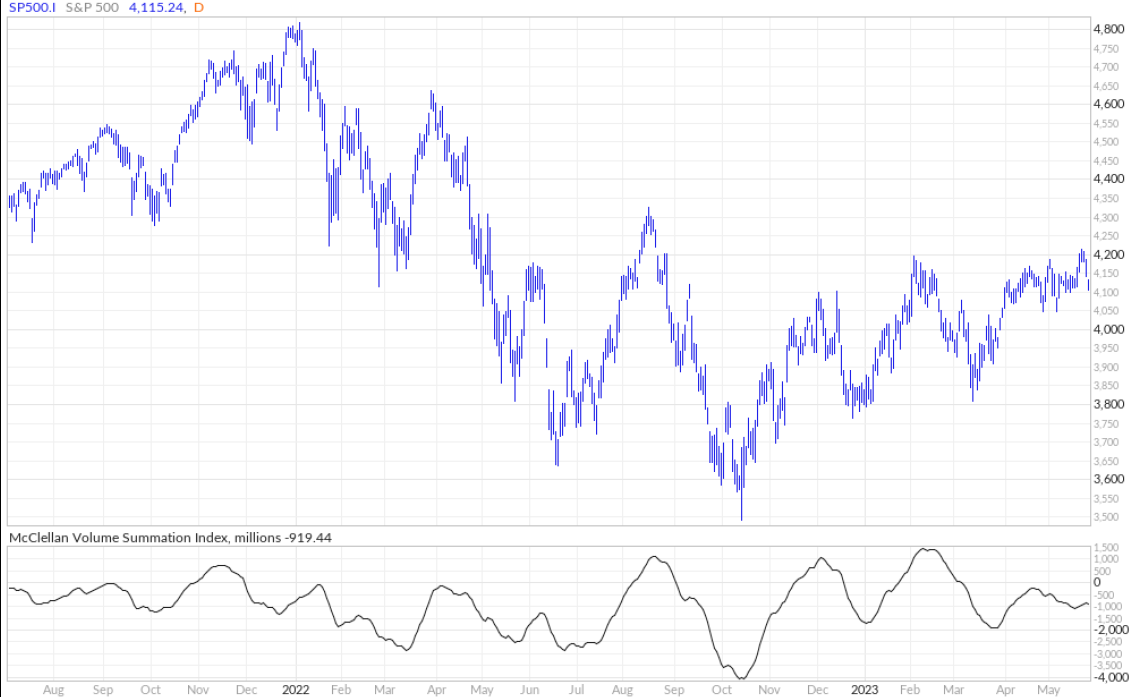
McClellan Volume Summation Index
The McClellan Volume Summation Index is an oscillator which measures the breadth of the market by analyzing the cumulative volume of advancing and declining stocks, by taking the difference between two exponential moving averages (EMAs) of advancers and decliners. A positive value indicates strong market breadth, suggesting a majority of stocks are participating in the market’s upward movement while a negative value suggests otherwise.
Looking at the McClellan Volume Summation chart, the market tends to reverse from a swing high when the it reaches 1,000 million and above. However there are also regular occurances the S&P 500 peaked with lower McClellan index levels closer to 0. In terms of marking short-term market troughs, the indicator is also inconsistent with lows made at various levels such as -1500, -3000 and -4000. Hence, it also has its limitations predicting reversals and future price movements.
Source: MarketInOut, PSR
Conclusion
Breadth indicators can provide some clarity for investors as they show the numbers of securities rising or falling during a trading session. For example, if the S&P 500 is rising, but market breadth indicators are showing a declining number of advancing stocks relative to declining stocks, it may indicate that the market rally is not broad based and is primarily driven by a few large-cap stocks. This could be a sign of potential weakness in the overall market as a pullback could occur should these stocks pare gains.
However with the S&P 500 being a free-float capitalization weighted index, the weighing system ensures the largest companies carry the greatest weight. The top 10 components account for almost 30% of the S&P 500. Thus, the large-caps may drag the index higher yet majority of stocks are falling with would lead to a divergence between market performance and breadth, since the latter analyzes the number of securities advancing relative to those declining.
In conclusion, market breadth is unable to predict the performance of any particular security or the overall market going forward as they are poor timing signals and serves more as a coincidental indicator which moves together with the market.
Important Information
This report is prepared and/or distributed by Phillip Securities Research Pte Ltd ("Phillip Securities Research"), which is a holder of a financial adviser’s licence under the Financial Advisers Act, Chapter 110 in Singapore.
By receiving or reading this report, you agree to be bound by the terms and limitations set out below. Any failure to comply with these terms and limitations may constitute a violation of law. This report has been provided to you for personal use only and shall not be reproduced, distributed or published by you in whole or in part, for any purpose. If you have received this report by mistake, please delete or destroy it, and notify the sender immediately.
The information and any analysis, forecasts, projections, expectations and opinions (collectively, the “Research”) contained in this report has been obtained from public sources which Phillip Securities Research believes to be reliable. However, Phillip Securities Research does not make any representation or warranty, express or implied that such information or Research is accurate, complete or appropriate or should be relied upon as such. Any such information or Research contained in this report is subject to change, and Phillip Securities Research shall not have any responsibility to maintain or update the information or Research made available or to supply any corrections, updates or releases in connection therewith.
Any opinions, forecasts, assumptions, estimates, valuations and prices contained in this report are as of the date indicated and are subject to change at any time without prior notice. Past performance of any product referred to in this report is not indicative of future results.
This report does not constitute, and should not be used as a substitute for, tax, legal or investment advice. This report should not be relied upon exclusively or as authoritative, without further being subject to the recipient’s own independent verification and exercise of judgment. The fact that this report has been made available constitutes neither a recommendation to enter into a particular transaction, nor a representation that any product described in this report is suitable or appropriate for the recipient. Recipients should be aware that many of the products, which may be described in this report involve significant risks and may not be suitable for all investors, and that any decision to enter into transactions involving such products should not be made, unless all such risks are understood and an independent determination has been made that such transactions would be appropriate. Any discussion of the risks contained herein with respect to any product should not be considered to be a disclosure of all risks or a complete discussion of such risks.
Nothing in this report shall be construed to be an offer or solicitation for the purchase or sale of any product. Any decision to purchase any product mentioned in this report should take into account existing public information, including any registered prospectus in respect of such product.
Phillip Securities Research, or persons associated with or connected to Phillip Securities Research, including but not limited to its officers, directors, employees or persons involved in the issuance of this report, may provide an array of financial services to a large number of corporations in Singapore and worldwide, including but not limited to commercial / investment banking activities (including sponsorship, financial advisory or underwriting activities), brokerage or securities trading activities. Phillip Securities Research, or persons associated with or connected to Phillip Securities Research, including but not limited to its officers, directors, employees or persons involved in the issuance of this report, may have participated in or invested in transactions with the issuer(s) of the securities mentioned in this report, and may have performed services for or solicited business from such issuers. Additionally, Phillip Securities Research, or persons associated with or connected to Phillip Securities Research, including but not limited to its officers, directors, employees or persons involved in the issuance of this report, may have provided advice or investment services to such companies and investments or related investments, as may be mentioned in this report.
Phillip Securities Research or persons associated with or connected to Phillip Securities Research, including but not limited to its officers, directors, employees or persons involved in the issuance of this report may, from time to time maintain a long or short position in securities referred to herein, or in related futures or options, purchase or sell, make a market in, or engage in any other transaction involving such securities, and earn brokerage or other compensation in respect of the foregoing. Investments will be denominated in various currencies including US dollars and Euro and thus will be subject to any fluctuation in exchange rates between US dollars and Euro or foreign currencies and the currency of your own jurisdiction. Such fluctuations may have an adverse effect on the value, price or income return of the investment.
To the extent permitted by law, Phillip Securities Research, or persons associated with or connected to Phillip Securities Research, including but not limited to its officers, directors, employees or persons involved in the issuance of this report, may at any time engage in any of the above activities as set out above or otherwise hold an interest, whether material or not, in respect of companies and investments or related investments, which may be mentioned in this report. Accordingly, information may be available to Phillip Securities Research, or persons associated with or connected to Phillip Securities Research, including but not limited to its officers, directors, employees or persons involved in the issuance of this report, which is not reflected in this report, and Phillip Securities Research, or persons associated with or connected to Phillip Securities Research, including but not limited to its officers, directors, employees or persons involved in the issuance of this report, may, to the extent permitted by law, have acted upon or used the information prior to or immediately following its publication. Phillip Securities Research, or persons associated with or connected to Phillip Securities Research, including but not limited its officers, directors, employees or persons involved in the issuance of this report, may have issued other material that is inconsistent with, or reach different conclusions from, the contents of this report.
The information, tools and material presented herein are not directed, intended for distribution to or use by, any person or entity in any jurisdiction or country where such distribution, publication, availability or use would be contrary to the applicable law or regulation or which would subject Phillip Securities Research to any registration or licensing or other requirement, or penalty for contravention of such requirements within such jurisdiction.
This report is intended for general circulation only and does not take into account the specific investment objectives, financial situation or particular needs of any particular person. The products mentioned in this report may not be suitable for all investors and a person receiving or reading this report should seek advice from a professional and financial adviser regarding the legal, business, financial, tax and other aspects including the suitability of such products, taking into account the specific investment objectives, financial situation or particular needs of that person, before making a commitment to invest in any of such products.
This report is not intended for distribution, publication to or use by any person in any jurisdiction outside of Singapore or any other jurisdiction as Phillip Securities Research may determine in its absolute discretion.
IMPORTANT DISCLOSURES FOR INCLUDED RESEARCH ANALYSES OR REPORTS OF FOREIGN RESEARCH HOUSE
Where the report contains research analyses or reports from a foreign research house, please note:

I analyze the stock market and conduct technical analysis to provide investment recommendations. I look forward to having a conversation with you in our in-house seminars and presentations to identify good risk-reward trading strategies together. I graduated from Nanyang Technological University with a Bachelor of Accountancy (Honours).
