Company Background
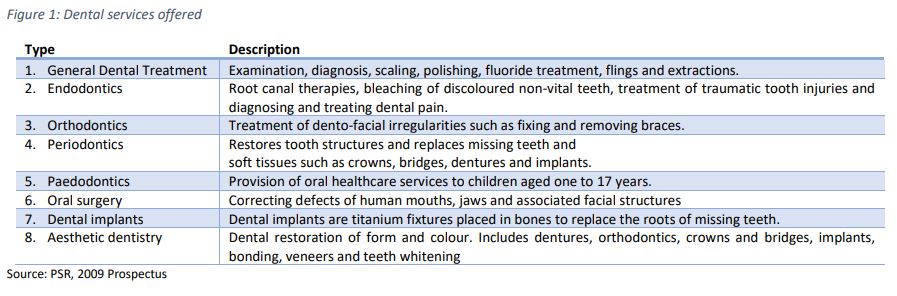
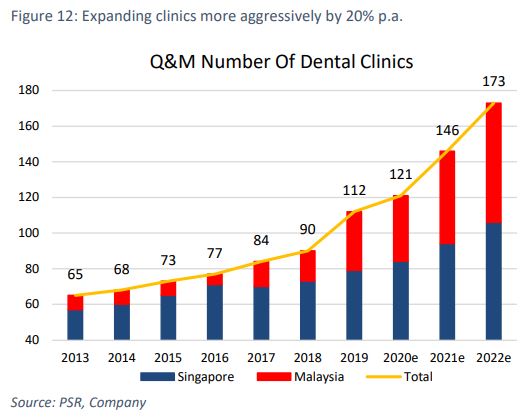
Established in 1996, Q & M is a household dental chain with the largest network of private dental outlets in Singapore and Malaysia. Through its 42.8%-owned listed associate, Aoxin Q & M (S$0.186, Not Rated), it is building a chain of dental hospitals and polyclinics in China. Q & M was listed on the SGX on 26 November 2009. As of June 2020, it operated 114 dental clinics in Singapore (80), Malaysia (33) and China (1) with the support of more than 230 dentists. We estimate its revenue market share of private dental clinics in Singapore at 10%, at the very least. More details in Appendix 1.
Investment Merits
We initiate coverage with a BUY rating. Our target price is S$0.70, based on 20x FY21e PE for its core operations and market cap valuations of its listed associate Aoxin.
REVENUE
Revenue includes fees from clinical consultation, treatment and the sale of medicine and oral-care products. As dental services cannot be advertised in Singapore, Q & M’s clients are either walk-in patients, referred patients or employees on corporate accounts. Around 80% of its patients are private. The balance are from corporate and government accounts sourced directly by its in-house marketing team. Q & M is considered a household name in Singapore with a pull factor for people seeking dental tretment. Other important factors for its success are its prominent logos and good locations in HDB estates, shopping malls and at MRT exchanges. The intangible of a successful clinic is doctors’ management and communication with patients.
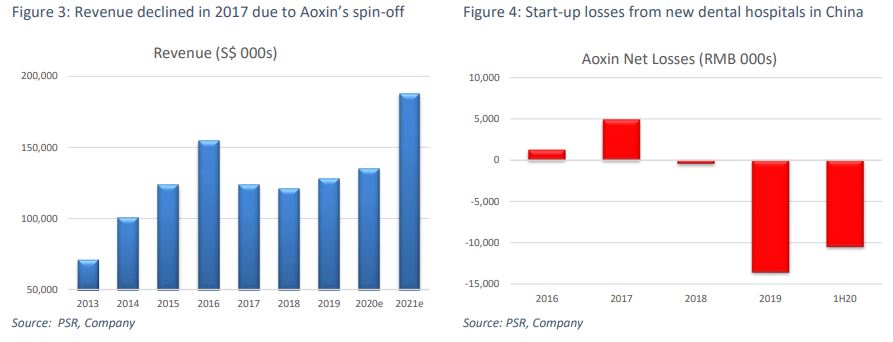
By geographical split, 90% of its revenue comes from Singapore. Another 9% comes from Malaysia. 1H20 revenue declined 14% YoY due to the circuit breaker in Singapore and movement control in Malaysia. This was when aesthetics and complex treatments were restricted. There was a sharp recovery when the lockdown in both countries eased. Q & M reported 20% and 15% YoY jumps in revenue in Singapore and Malaysia respectively in June 2020.
EXPENSES
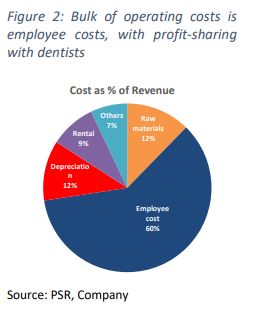
Gross margins after deducting for raw materials such as consumables and dental supplies range from 82% to 89%. The largest cost item, at around 60% of revenue, is employee expenses (Figure 2). These are namely fees shared with the dentists. Q & M’s dentists are not paid fixed salaries but a share of the company’s gross profits, at 40-50% depending on the seniority of the dentists. With the pandemic, rental costs are expected to trend lower in malls as landlords prefer to retain large and established tenants such as Q & M. In general, medical procedure margins are higher than medicine sales due to the service and consultation provided. Dentistry is also a resilient form of healthcare service as there are no self-medicating alternatives.
ASSOCIATE & OTHER INCOME
Q & M has two categories of other income:
BALANCE SHEET
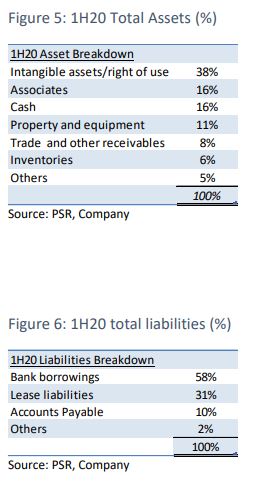
Assets. Based on 1H20 results, almost 40% of its assets were intangibles and right-of-use assets. Of its S$57mn goodwill, around S$27mn was related to its acquisition of TP Dental Surgeons in 2015. Another S$8.6mn was from its acquisition of Lee & Lee Dental in 2016. TP Dental was founded in 1973. Its S$28.6mn acquisition marked Q & M’s entry into premium dental practice. The clinic has its own in-house laboratory for the production of personalised dental appliances.
Another third was made up of cash and associates. Fixed assets were minimal at 11% of total assets. The balance 14% of assets was working capital. Q & M’s underlying dental business is asset-light. Intangible assets are from previous acquisitions while right-of-use is capitalised rental expense. Associates have been loss-making after the disposal of Aidite. In short, the bulk of the assets on its balance sheet is not relevant to its dental business except working capital and equipment which is around 30% of current assets. 1H20 inventories more than doubled over six months due to stockpiling of personal protective equipment and consumables because of the pandemic.
Liabilities. 1H20 total liabilities were S$147mn. Almost 60% was bank loans totalling S$82.9mn. Net debt was S$105mn, excluding S$42mn cash in hand. Other major liabilities were lease liabilities from right-of-use assets, totalling S$45mn. These were essentially capitalised rent commitments for Q & M.
CASH FLOW
Operating cash flow. Aoxin was a subsidiary until 2018. Operating cash flows in 2018 and 2019 averaged S$20mn per year or S$18mn if we deduct interest expenses. The business generates high cash flows with little drain on working capital. Other receivables were lumpy in 2019 due to pending sales proceeds from its Aidite sale. 1H20 operating cash flow was a negative S$3.5mn due to build up in inventory and trade receivables.
Capital expenditure. Capex in 2018 and 2019 averaged S$5mn a year. We are expecting higher capex from equipping its new PCR laboratory testing operations. FCF averaged S$15mn per annum for a yield of 4%.
NEW GROWTH DRIVER: sale of Covid-19 PCR test kits and laboratory testing
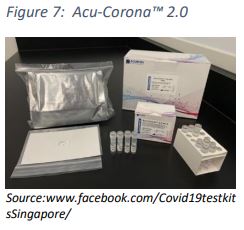
In September 2020, subsidiary Acumen Diagnostics* secured a Healthcare Institution Licence from the Ministry of Health to offer clinical laboratory testing services for Covid-19. Such labs face high barriers in securing licences, given the dangerous handling of highly infectious viruses, the need for skilled laboratory technicians and high equipment costs involved in molecular testing. Acumen will use its proprietary SARS CoV-2 RT-PCR test kit, Acu-Corona® 2.0 (Figure 7), which had received Singapore’s Health Sciences Authority’s (HSA) Provisional Authorisation for clinical use in March 2020, to provide testing services. These test kits are manufactured in Singapore.
There is limited financial data available. The government had targeted 40,000 tests a day by November 2020. The latest data point suggests an average of 27,200 tests daily in September. In our assumptions, we estimate 20,000 tests done per day in Singapore. Of this 20,000, we assume 3% will be handled by Acumen. This implies 600 tests a day, potentially yielding S$32mn of revenue in 2021e. The retail selling price of a PCR test is around S$200. We assume net margins of 25% on a selling price of S$150 for Acumen. This translates to a net profit of S$8.2mn or S$4mn for its 51% stake. Because Acumen manufactures and uses proprietary test kits, we expect margins to be even higher. We can only get better clarity in 1H21 results which will be reflected in minority interest in the income statement.
What is polymerase chain reaction (PCR) test?
PCR tests detect the genetic material of the coronavirus from a swab sample. After swabbing the back of the nostril, specimens are sent to Acumen Diagnostics’ lab. PCR test results will be available 1-2 days later.
What is Acumen Diagnostics’ business model?
Neither Acumen nor Q & M is involved in the swabbing of patients. Instead, Acumen will receive swab specimens from the authorities – under the testing operation control of the Ministry of Health – or private clinics. Acumen will generate revenue from the sale of its Acu-Corona® 2.0/3.0 test kits and laboratory charges in testing the specimens. When we checked the HSA website there were 74 other PCR test that we approved.
Who needs a PCR test in Singapore?
How long is PCR test need in Singapore?
We think at least in 2021 and 2022. So long as the virus is present globally, we expect PCR test to continue. There may be less RRT but as travel reopens, PCR will be best arrivals into Singapore. Other unknowns are the durability of the vaccine, effectiveness of vaccine to new strains and whether vaccinated individuals can transmist the virus.
INDUSTRY
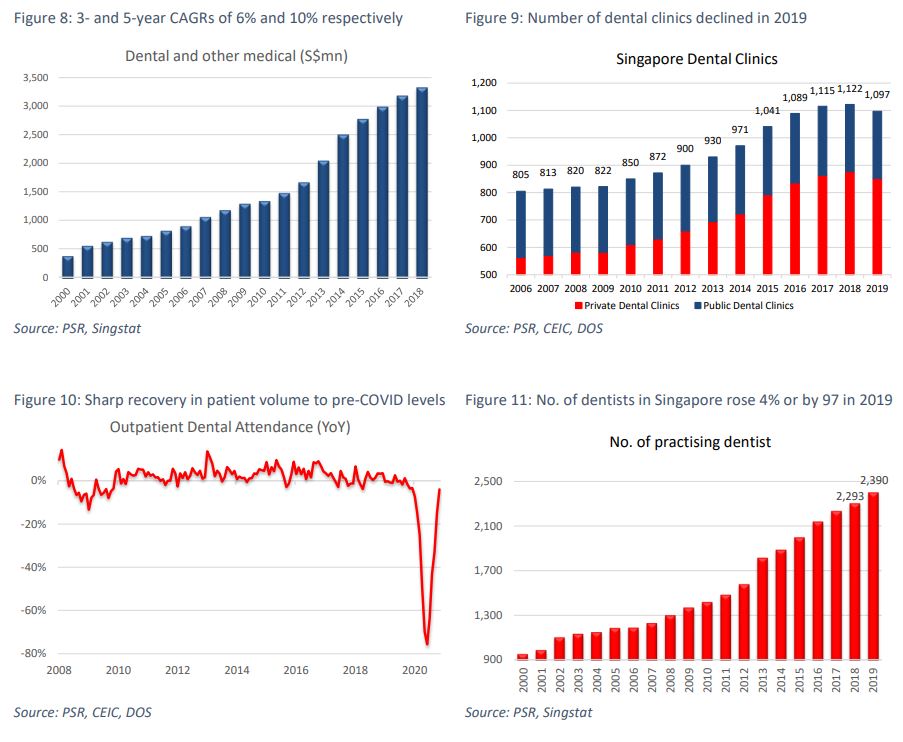
The dental industry and other medical services* in Singapore have a market size of around S$3.3bn, according to operating receipts in 2018. Dental forms around 18% of the healthcare service industry, with hospitals accounting for the bulk at S$10.1bn. Dental has been enjoying resilient growth with 3-year and 5-year CAGRs of 6% and 10% respectively (Figure 8).
There are around 1,097 dental clinics in Singapore, of which 246 are public and 851 private (Figure 9). In 2019, Q & M operated 79 clinics in Singapore. This implies a 7% share of all clinics in Singapore and 9% share of private clinics. Due to its large number of specialists who can provide higher-value-added work, we can assume Q & M has at least a 10% share of the private dental market. Furthermore, a single Q & M dental clinic may incorporate multiple disciplines which many small GP dental clinics do not provide.
In terms of industry patient volumes, when the circuit breaker was implemented, attendance to dental clinics dropped to a low of 8.1k, down 91% YoY. Volumes have picked up (Figure 10), with the latest November number being 71.7k. This was still a 3% YoY decline and below 2019’s average of 89k.
Investment Merits
New clinics can be housed by graduate or practising dentists. There are multiple reasons for dentists to join the Q & M dental chain, including its established brand, the dentists’ ability to focus on their core expertise and even achieve a better work-life balance. As medical services cannot be advertised, the ability to attract walk-in customers is critical. For smaller clinics, new customers come from word-of-mouth recommendations, clinic reputation and location. For Q & M, not only does it have all the appeals of an established and reputable brand and prominent locations with visible signages to draw new walk-in customers, it also offers a large pool of dentists and specialists to serve the varied needs of patients. To give impetus to its organic growth, a new business development team has been formed, dedicated to recruiting new dentists to the Q & M group.
The Acu-Corona® series of SARS CoV-2 RT-PCR tests are manufactured in Singapore and are already being used in countries like Malaysia and Indonesia. In July 2020, Q & M announced an exclusive distribution agreement with Azion Healthcare Sdn Bhd for Azion’s exclusive sale and distribution of Acu-Corona® 3.0 Covid-19 PCR test kits in Mexico for six months, provided Aizon purchases 5mn tests within three months of obtaining regulatory approvals from the Mexican authorities. We have not incorporated the Mexico contract in our forecasts as there has been little update since the announcement.
Valuation
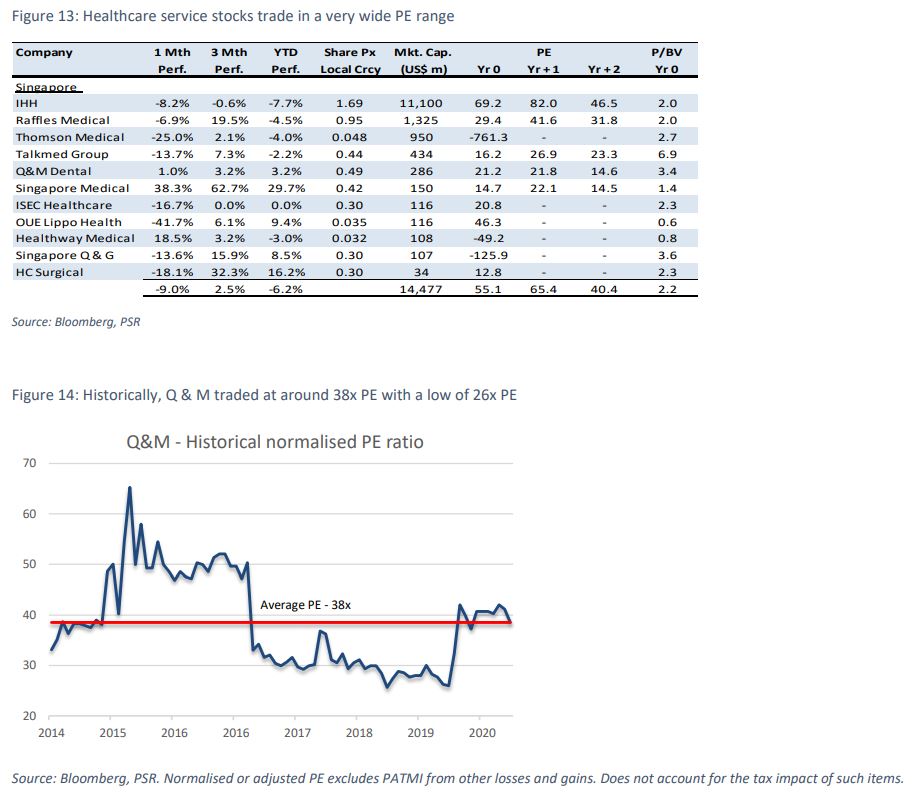
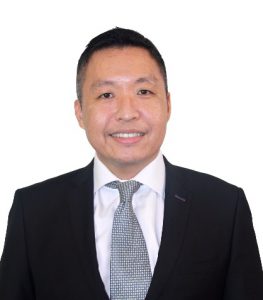
We initiate coverage with a BUY rating and target price is S$0.70. Peers (Figure 13) trade in a wide band with hospitals valued at 30-45x PE. Q & M’s 7-year PE has varied from 26x to 65x, with an average of 38x. We are ascribing a large 50% discount to both hospitals or sector and its historical average PE, to reflect the huge variance in valuations for healthcare services. This gives us 20x PE for its core operations, or S$0.67/share. We added another S$0.03 from the market value of listed associate, Aoxin. We build in a 20% discount buffer to account for any volatility in its share price.
Important Information
This report is prepared and/or distributed by Phillip Securities Research Pte Ltd ("Phillip Securities Research"), which is a holder of a financial adviser’s licence under the Financial Advisers Act, Chapter 110 in Singapore.
By receiving or reading this report, you agree to be bound by the terms and limitations set out below. Any failure to comply with these terms and limitations may constitute a violation of law. This report has been provided to you for personal use only and shall not be reproduced, distributed or published by you in whole or in part, for any purpose. If you have received this report by mistake, please delete or destroy it, and notify the sender immediately.
The information and any analysis, forecasts, projections, expectations and opinions (collectively, the “Research”) contained in this report has been obtained from public sources which Phillip Securities Research believes to be reliable. However, Phillip Securities Research does not make any representation or warranty, express or implied that such information or Research is accurate, complete or appropriate or should be relied upon as such. Any such information or Research contained in this report is subject to change, and Phillip Securities Research shall not have any responsibility to maintain or update the information or Research made available or to supply any corrections, updates or releases in connection therewith.
Any opinions, forecasts, assumptions, estimates, valuations and prices contained in this report are as of the date indicated and are subject to change at any time without prior notice. Past performance of any product referred to in this report is not indicative of future results.
This report does not constitute, and should not be used as a substitute for, tax, legal or investment advice. This report should not be relied upon exclusively or as authoritative, without further being subject to the recipient’s own independent verification and exercise of judgment. The fact that this report has been made available constitutes neither a recommendation to enter into a particular transaction, nor a representation that any product described in this report is suitable or appropriate for the recipient. Recipients should be aware that many of the products, which may be described in this report involve significant risks and may not be suitable for all investors, and that any decision to enter into transactions involving such products should not be made, unless all such risks are understood and an independent determination has been made that such transactions would be appropriate. Any discussion of the risks contained herein with respect to any product should not be considered to be a disclosure of all risks or a complete discussion of such risks.
Nothing in this report shall be construed to be an offer or solicitation for the purchase or sale of any product. Any decision to purchase any product mentioned in this report should take into account existing public information, including any registered prospectus in respect of such product.
Phillip Securities Research, or persons associated with or connected to Phillip Securities Research, including but not limited to its officers, directors, employees or persons involved in the issuance of this report, may provide an array of financial services to a large number of corporations in Singapore and worldwide, including but not limited to commercial / investment banking activities (including sponsorship, financial advisory or underwriting activities), brokerage or securities trading activities. Phillip Securities Research, or persons associated with or connected to Phillip Securities Research, including but not limited to its officers, directors, employees or persons involved in the issuance of this report, may have participated in or invested in transactions with the issuer(s) of the securities mentioned in this report, and may have performed services for or solicited business from such issuers. Additionally, Phillip Securities Research, or persons associated with or connected to Phillip Securities Research, including but not limited to its officers, directors, employees or persons involved in the issuance of this report, may have provided advice or investment services to such companies and investments or related investments, as may be mentioned in this report.
Phillip Securities Research or persons associated with or connected to Phillip Securities Research, including but not limited to its officers, directors, employees or persons involved in the issuance of this report may, from time to time maintain a long or short position in securities referred to herein, or in related futures or options, purchase or sell, make a market in, or engage in any other transaction involving such securities, and earn brokerage or other compensation in respect of the foregoing. Investments will be denominated in various currencies including US dollars and Euro and thus will be subject to any fluctuation in exchange rates between US dollars and Euro or foreign currencies and the currency of your own jurisdiction. Such fluctuations may have an adverse effect on the value, price or income return of the investment.
To the extent permitted by law, Phillip Securities Research, or persons associated with or connected to Phillip Securities Research, including but not limited to its officers, directors, employees or persons involved in the issuance of this report, may at any time engage in any of the above activities as set out above or otherwise hold an interest, whether material or not, in respect of companies and investments or related investments, which may be mentioned in this report. Accordingly, information may be available to Phillip Securities Research, or persons associated with or connected to Phillip Securities Research, including but not limited to its officers, directors, employees or persons involved in the issuance of this report, which is not reflected in this report, and Phillip Securities Research, or persons associated with or connected to Phillip Securities Research, including but not limited to its officers, directors, employees or persons involved in the issuance of this report, may, to the extent permitted by law, have acted upon or used the information prior to or immediately following its publication. Phillip Securities Research, or persons associated with or connected to Phillip Securities Research, including but not limited its officers, directors, employees or persons involved in the issuance of this report, may have issued other material that is inconsistent with, or reach different conclusions from, the contents of this report.
The information, tools and material presented herein are not directed, intended for distribution to or use by, any person or entity in any jurisdiction or country where such distribution, publication, availability or use would be contrary to the applicable law or regulation or which would subject Phillip Securities Research to any registration or licensing or other requirement, or penalty for contravention of such requirements within such jurisdiction.
This report is intended for general circulation only and does not take into account the specific investment objectives, financial situation or particular needs of any particular person. The products mentioned in this report may not be suitable for all investors and a person receiving or reading this report should seek advice from a professional and financial adviser regarding the legal, business, financial, tax and other aspects including the suitability of such products, taking into account the specific investment objectives, financial situation or particular needs of that person, before making a commitment to invest in any of such products.
This report is not intended for distribution, publication to or use by any person in any jurisdiction outside of Singapore or any other jurisdiction as Phillip Securities Research may determine in its absolute discretion.
IMPORTANT DISCLOSURES FOR INCLUDED RESEARCH ANALYSES OR REPORTS OF FOREIGN RESEARCH HOUSE
Where the report contains research analyses or reports from a foreign research house, please note:
Paul has 20 years of experience as a fund manager and sell-side analyst. During his time as fund manager, he has managed multiple funds and mandates including capital guaranteed, dividend income, renewable energy, single country and regionally focused funds.
He graduated from Monash University and had completed both his Chartered Financial Analyst and Australian CPA programme.
