Company Background
NVIDIA Corporation (NVDA) designs and sells Graphics Processing Units (GPU) that are responsible for rendering photo-realistic graphics in consumer PCs as well as other computationally intensive tasks, such as high-performance computing (HPC), artificial intelligence (AI), data science, robotics, and more recently, autonomous vehicles. NVDA reports in two business segments: Graphics (44% of FY23 revenue), which includes revenue from gaming and professional visualization; and Compute & Networking (56% of FY23 revenue), which includes its data centre, automotive, and robotics businesses.
Investment Highlights
We initiate coverage with a BUY rating and a target price of US$315.00 based on DCF valuation, with a WACC of 6.8% and terminal growth of 4.5%.
REVENUE
NVDA posted a total revenue of US$27bn for FY23, which was flat YoY. The company reports in two segments: Graphics and Compute & Networking, with each of them comprising revenue from different sets of end-market usage of its GPUs. The Graphics segment contains revenue from the company’s Gaming (34% of FY23 revenue) and Professional Visualization (6%) businesses, while the Compute & Networking segment is made up of NVDA’s revenue from Data Centre (56%), Automotive (3%), and OEM & other (2%) (Figure 1).
Gaming: NVDA started its business by selling graphics cards that are used to render high-definition graphics for PC games. As such, it was the company’s main revenue contributor, consistently making up the largest proportion of its total revenue since its founding until FY23, which was eventually taken over by the Data Centre segment. The Gaming business earns revenue by 1) selling graphics cards to the general PC users; 2) selling GPUs to PC component manufacturing partners; 3) charging subscription fees for its cloud game streaming service GeForce Now; and 4) selling development services for console gaming devices.
Revenue from this segment was US$9bn in FY23, falling by 27% YoY. The drop was due to NVDA having lower sell-in to partners since 2Q23 to help reduce channel inventory levels as gaming demand was hindered by the macroeconomic environment and COVID-19 related disruptions in China. The decrease could also be attributed to the transition of Ethereum from proof-of-work to proof-of-stake, which caused lower graphics cards demand from cryptocurrency miners. The Gaming segment saw a 16% QoQ revenue increase in 4Q23 due to the improvements in channel inventory levels as well as the ramp-up of NVDA’s new GeForce RTX GPUs based on the Ada Lovelace architecture (GeForce RTX 40 series). NVDA is expecting a strong QoQ revenue growth for the segment in 1Q24 as it believes the channel inventory correction has concluded.
Data Centre: The Data Centre segment took over Gaming as NVDA’s largest revenue contributor in FY23. This segment sells GPUs that are designed for data centre use cases, such as data analytics, artificial intelligence, machine learning and inferencing, as well as data centre networking solutions, including network interface cards and advanced Ethernet connections. NVDA also has a software licensing business that mainly stems from its NVIDIA AI Enterprise offerings. The data centre segment earns revenue by: 1) selling data centre GPUs; 2) selling supercomputing systems to enterprises; and 3) charging software subscription fees for NVIDIA AI Enterprise.
Revenue from this segment grew 41% YoY to US$15bn in FY23. The increase was mainly attributed to the continued strong growth in sales to hyperscale customers as well as cloud service providers. In 4Q23, the segment faced a 6% QoQ decline, 11% YoY increase in revenue. The QoQ decline was due to cloud service providers tightening spending towards the end of the year as they recalibrate their respective build plans. The lower QoQ sales were also attributed to lower sales in China, reflecting the COVID-related and other domestic issues in the country. Although there was no breakdown between hardware and software revenue, management indicated that the latter is currently contributing hundreds of millions in revenue to the company’s business. NVDA is expecting continued strong growth in its Data Centre business as it further ramps up the shipment of its new H100 data centre GPU as well as the strong customer interest in generative AI.
|
REVENUE NVDA posted a total revenue of US$27bn for FY23, which was flat YoY. The company reports in two segments: Graphics and Compute & Networking, with each of them comprising revenue from different sets of end-market usage of its GPUs. The Graphics segment contains revenue from the company’s Gaming (34% of FY23 revenue) and Professional Visualization (6%) businesses, while the Compute & Networking segment is made up of NVDA’s revenue from Data Centre (56%), Automotive (3%), and OEM & other (2%) (Figure 1).
Gaming: NVDA started its business by selling graphics cards that are used to render high-definition graphics for PC games. As such, it was the company’s main revenue contributor, consistently making up the largest proportion of its total revenue since its founding until FY23, which was eventually taken over by the Data Centre segment. The Gaming business earns revenue by 1) selling graphics cards to the general PC users; 2) selling GPUs to PC component manufacturing partners; 3) charging subscription fees for its cloud game streaming service GeForce Now; and 4) selling development services for console gaming devices.
Revenue from this segment was US$9bn in FY23, falling by 27% YoY. The drop was due to NVDA having lower sell-in to partners since 2Q23 to help reduce channel inventory levels as gaming demand was hindered by the macroeconomic environment and COVID-19 related disruptions in China. The decrease could also be attributed to the transition of Ethereum from proof-of-work to proof-of-stake, which caused lower graphics cards demand from cryptocurrency miners. The Gaming segment saw a 16% QoQ revenue increase in 4Q23 due to the improvements in channel inventory levels as well as the ramp-up of NVDA’s new GeForce RTX GPUs based on the Ada Lovelace architecture (GeForce RTX 40 series). NVDA is expecting a strong QoQ revenue growth for the segment in 1Q24 as it believes the channel inventory correction has concluded.
Data Centre: The Data Centre segment took over Gaming as NVDA’s largest revenue contributor in FY23. This segment sells GPUs that are designed for data centre use cases, such as data analytics, artificial intelligence, machine learning and inferencing, as well as data centre networking solutions, including network interface cards and advanced Ethernet connections. NVDA also has a software licensing business that mainly stems from its NVIDIA AI Enterprise offerings. The data centre segment earns revenue by: 1) selling data centre GPUs; 2) selling supercomputing systems to enterprises; and 3) charging software subscription fees for NVIDIA AI Enterprise.
Revenue from this segment grew 41% YoY to US$15bn in FY23. The increase was mainly attributed to the continued strong growth in sales to hyperscale customers as well as cloud service providers. In 4Q23, the segment faced a 6% QoQ decline, 11% YoY increase in revenue. The QoQ decline was due to cloud service providers tightening spending towards the end of the year as they recalibrate their respective build plans. The lower QoQ sales were also attributed to lower sales in China, reflecting the COVID-related and other domestic issues in the country. Although there was no breakdown between hardware and software revenue, management indicated that the latter is currently contributing hundreds of millions in revenue to the company’s business. NVDA is expecting continued strong growth in its Data Centre business as it further ramps up the shipment of its new H100 data centre GPU as well as the strong customer interest in generative AI.
Professional visualization: The graphics cards for professional visualization are different from those for gaming as they are optimized for rendering graphics in design workflows. NVIDIA also offers a 3D graphic designing platform called Omniverse, which is free to use for individuals but monetizes it as a software subscription for enterprise use. The professional visualization segment therefore earns revenue by: 1) selling graphics cards; and 2) charging subscription fees for NVIDIA Omniverse Enterprise.
Professional visualization revenue was US$1.5bn in FY23, down 27% YoY. The decrease was due to NVDA implementing a lower sell-in to partners to help in correcting channel inventory due to slowing demand from enterprises.
Automotive: In the Automotive segment, NVDA provides end-to-end solutions, from hardware to software, for autonomous vehicle developers and car manufacturers. On the hardware level, NVDA provides system-on-a-chip (SoC) that serves as the central computer for an autonomous vehicle to process the data recorded by the sensors on the vehicle. On the software side, NVDA provides an operating system and platform for automakers to develop the self-driving and driver assistance capabilities of their cars. NVDA also provides data centre infrastructure for management, training, and simulation of self-driving capabilities. The Automotive segment mainly earns revenue from: 1) selling in-vehicle components, and 2) development agreements. NVDA is also aiming to have revenue-sharing arrangements to monetize autonomous driving subscriptions that are offered by car manufacturers.
The Automotive segment generated a revenue of US$903mn, up 60% YoY as electric vehicle manufacturers continued their production ramp-up of new models equipped with NVDA’s chips, increased demand for self-driving and AI cockpit solutions, as well as development arrangements. In March 2022, NVDA announced that the Automotive business had secured a 6-year pipeline worth US$11bn with more significant production ramp-ups taking place in 2023.
OEM & Other: This segment consists of sales of components to notebook OEMs and NVDA’s cryptocurrency mining processors (CMP). Revenue was US$455mn in FY23, down 61% YoY due to the demand decline in both products. NVDA indicated CMP revenue was insignificant in FY23 compared with the US$550mn in FY22 as the cryptocurrency market faced a challenging year.
|
|
Revenue Growth: We forecast revenue for FY24e to grow to US$29bn, which would represent a 10% YoY growth, mainly driven by growth in Data Centre due to increasing AI adoption in enterprises and hyperscale customers continuing to embrace GPU-accelerated deep learning to process large data sets. Gaming is also expected to experience growth following a challenging FY23 as inventory correction is behind and consumer reception to the new RTX 40 series graphics cards is strong.
|

|
RULE OF 40 The “Rule of 40” was first introduced as a benchmark to measure the balance between growth and profitability of SaaS companies, taking into account both revenue growth, as well as profitability (Revenue Growth + EBITDA Margins), with the addition of both metrics needing to exceed the 40% threshold. We have modified this slightly by averaging revenue growth over a 3-year period compared with just a single period growth rate. Adding together NVDA’s 3-year average revenue growth of 38% and its FY23 EBITDA margin of 21%, the total of 59% is more than our required threshold of 40% (Figure 4).
EXPENSES The cost of revenue was US$11.6bn in FY23, up from US$9.4bn in FY22 due to a US$2bn inventory charge resulting from the excess supply of Ampere-based gaming and data centre GPUs, particularly in China. Excluding this charge, the cost of revenue would have been flat YoY.
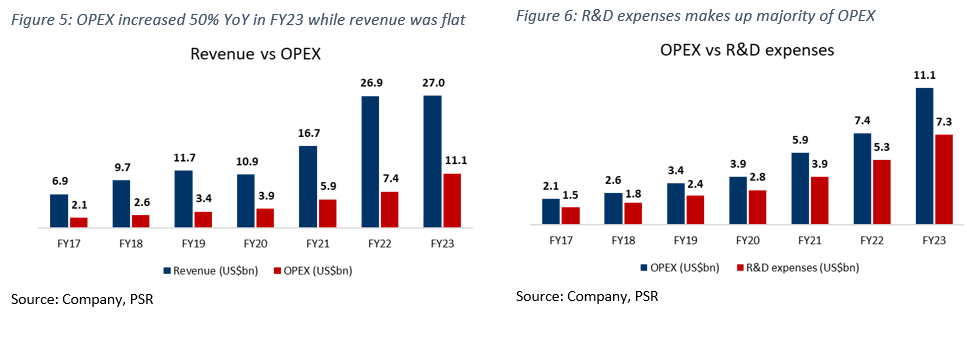
NVDA has two main operating expenses. Majority of its OPEX comes from the research and development expenses as it consistently makes up ~70% of NVDA’s overall OPEX, while the remainder comes from the selling, general and administrative expenses. In FY23, R&D expenses were US$7.3bn, up 39% YoY, and SG&A came in at US$2.4bn, up 13%. The increases were attributed to employee headcount growth, data centre infrastructure, and increased engineering development costs. NVDA also incurred a US$1.3bn termination charge related to its ARM acquisition in FY23, which brought the total OPEX to US$11bn, growing by 50% YoY. |
MARGINS
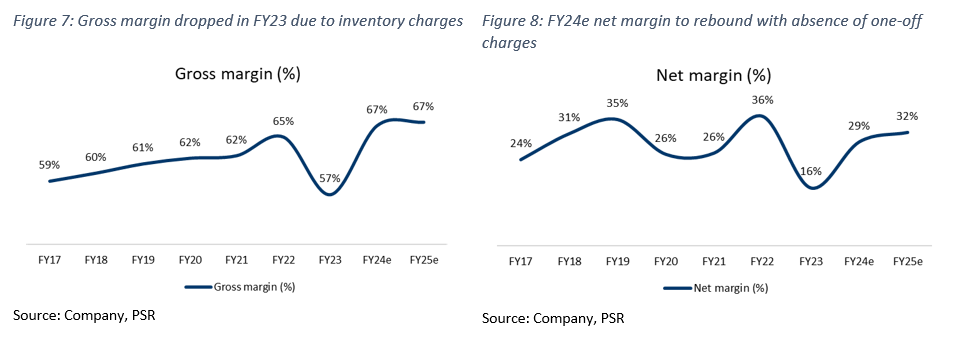
NVDA’s gross margins have generally been stable at ~60% levels since FY17. However, the company experienced a decline in gross margins to 57% in FY23. This was because of the US$2bn inventory charge due to the excess supply of Ampere-based gaming and data centre GPUs as demand was lower than its projection, particularly for the expected demand in China. Excluding this inventory charge, the gross margin for FY23 would have been 65%. We expect gross margin to rebound and reach 67% in FY24e as NVDA can pass on the higher costs to its customers and benefit from the absence of negative impact due to inventory charges.
Net margins were 16% for FY23 as the company saw a 50% YoY increase in OPEX while revenue was flat compared with FY22. Net margins reached a high level of 36% in FY22 due to the spike in demand for NVDA’s GPUs during the pandemic, causing the revenue growth of 61% to far outpace the 27% increase in OPEX. We expect net margins to recover to 29% in FY24e due to the absence of one-off charges.
BALANCE SHEET
Assets: NVDA has total assets of US$41bn. Cash and cash equivalents were US$3bn in FY23 while marketable securities make up the largest proportion of NVDA’s total assets at US$10bn. As a result, cash, cash equivalents and marketable securities totalled US$13bn in FY23, down from US$21bn in FY22, primarily due to a decrease in net income, a US$10bn share repurchase, and lower marketable securities purchases and higher sales and maturities of such assets during the year.
Inventory was US$5bn, double from FY22, as NVDA prepares the ramp-up of its new products in Data Centre and Gaming. Goodwill has remained stable at ~US$4bn since FY21 where it increased by US$3.6bn from US$618mn in FY20 due to NVDA’s acquisition of Mellanox
Liabilities: Majority of NVDA’s total liabilities come from its long-term debt of US$9.7bn (55% of total liabilities), down from the US$11bn in FY22 as the company did not issue new debt in FY23. Accrued and other liabilities increased to US$4bn in FY23 from US$2bn in FY22 mainly due to the increase in inventory purchase obligations and taxes payable. Total liabilities were US$19bn, a slight increase from US$17.5bn in FY22.
Important Information
This report is prepared and/or distributed by Phillip Securities Research Pte Ltd ("Phillip Securities Research"), which is a holder of a financial adviser’s licence under the Financial Advisers Act, Chapter 110 in Singapore.
By receiving or reading this report, you agree to be bound by the terms and limitations set out below. Any failure to comply with these terms and limitations may constitute a violation of law. This report has been provided to you for personal use only and shall not be reproduced, distributed or published by you in whole or in part, for any purpose. If you have received this report by mistake, please delete or destroy it, and notify the sender immediately.
The information and any analysis, forecasts, projections, expectations and opinions (collectively, the “Research”) contained in this report has been obtained from public sources which Phillip Securities Research believes to be reliable. However, Phillip Securities Research does not make any representation or warranty, express or implied that such information or Research is accurate, complete or appropriate or should be relied upon as such. Any such information or Research contained in this report is subject to change, and Phillip Securities Research shall not have any responsibility to maintain or update the information or Research made available or to supply any corrections, updates or releases in connection therewith.
Any opinions, forecasts, assumptions, estimates, valuations and prices contained in this report are as of the date indicated and are subject to change at any time without prior notice. Past performance of any product referred to in this report is not indicative of future results.
This report does not constitute, and should not be used as a substitute for, tax, legal or investment advice. This report should not be relied upon exclusively or as authoritative, without further being subject to the recipient’s own independent verification and exercise of judgment. The fact that this report has been made available constitutes neither a recommendation to enter into a particular transaction, nor a representation that any product described in this report is suitable or appropriate for the recipient. Recipients should be aware that many of the products, which may be described in this report involve significant risks and may not be suitable for all investors, and that any decision to enter into transactions involving such products should not be made, unless all such risks are understood and an independent determination has been made that such transactions would be appropriate. Any discussion of the risks contained herein with respect to any product should not be considered to be a disclosure of all risks or a complete discussion of such risks.
Nothing in this report shall be construed to be an offer or solicitation for the purchase or sale of any product. Any decision to purchase any product mentioned in this report should take into account existing public information, including any registered prospectus in respect of such product.
Phillip Securities Research, or persons associated with or connected to Phillip Securities Research, including but not limited to its officers, directors, employees or persons involved in the issuance of this report, may provide an array of financial services to a large number of corporations in Singapore and worldwide, including but not limited to commercial / investment banking activities (including sponsorship, financial advisory or underwriting activities), brokerage or securities trading activities. Phillip Securities Research, or persons associated with or connected to Phillip Securities Research, including but not limited to its officers, directors, employees or persons involved in the issuance of this report, may have participated in or invested in transactions with the issuer(s) of the securities mentioned in this report, and may have performed services for or solicited business from such issuers. Additionally, Phillip Securities Research, or persons associated with or connected to Phillip Securities Research, including but not limited to its officers, directors, employees or persons involved in the issuance of this report, may have provided advice or investment services to such companies and investments or related investments, as may be mentioned in this report.
Phillip Securities Research or persons associated with or connected to Phillip Securities Research, including but not limited to its officers, directors, employees or persons involved in the issuance of this report may, from time to time maintain a long or short position in securities referred to herein, or in related futures or options, purchase or sell, make a market in, or engage in any other transaction involving such securities, and earn brokerage or other compensation in respect of the foregoing. Investments will be denominated in various currencies including US dollars and Euro and thus will be subject to any fluctuation in exchange rates between US dollars and Euro or foreign currencies and the currency of your own jurisdiction. Such fluctuations may have an adverse effect on the value, price or income return of the investment.
To the extent permitted by law, Phillip Securities Research, or persons associated with or connected to Phillip Securities Research, including but not limited to its officers, directors, employees or persons involved in the issuance of this report, may at any time engage in any of the above activities as set out above or otherwise hold an interest, whether material or not, in respect of companies and investments or related investments, which may be mentioned in this report. Accordingly, information may be available to Phillip Securities Research, or persons associated with or connected to Phillip Securities Research, including but not limited to its officers, directors, employees or persons involved in the issuance of this report, which is not reflected in this report, and Phillip Securities Research, or persons associated with or connected to Phillip Securities Research, including but not limited to its officers, directors, employees or persons involved in the issuance of this report, may, to the extent permitted by law, have acted upon or used the information prior to or immediately following its publication. Phillip Securities Research, or persons associated with or connected to Phillip Securities Research, including but not limited its officers, directors, employees or persons involved in the issuance of this report, may have issued other material that is inconsistent with, or reach different conclusions from, the contents of this report.
The information, tools and material presented herein are not directed, intended for distribution to or use by, any person or entity in any jurisdiction or country where such distribution, publication, availability or use would be contrary to the applicable law or regulation or which would subject Phillip Securities Research to any registration or licensing or other requirement, or penalty for contravention of such requirements within such jurisdiction.
This report is intended for general circulation only and does not take into account the specific investment objectives, financial situation or particular needs of any particular person. The products mentioned in this report may not be suitable for all investors and a person receiving or reading this report should seek advice from a professional and financial adviser regarding the legal, business, financial, tax and other aspects including the suitability of such products, taking into account the specific investment objectives, financial situation or particular needs of that person, before making a commitment to invest in any of such products.
This report is not intended for distribution, publication to or use by any person in any jurisdiction outside of Singapore or any other jurisdiction as Phillip Securities Research may determine in its absolute discretion.
IMPORTANT DISCLOSURES FOR INCLUDED RESEARCH ANALYSES OR REPORTS OF FOREIGN RESEARCH HOUSE
Where the report contains research analyses or reports from a foreign research house, please note:

Maximilian mainly covers the US technology sector. In his strive to be a globalized citizen and get continuous exposure to the fundamentals of companies from various industries, he graduated from Singapore Management University holding a Bachelor’s degree in Business Management.
