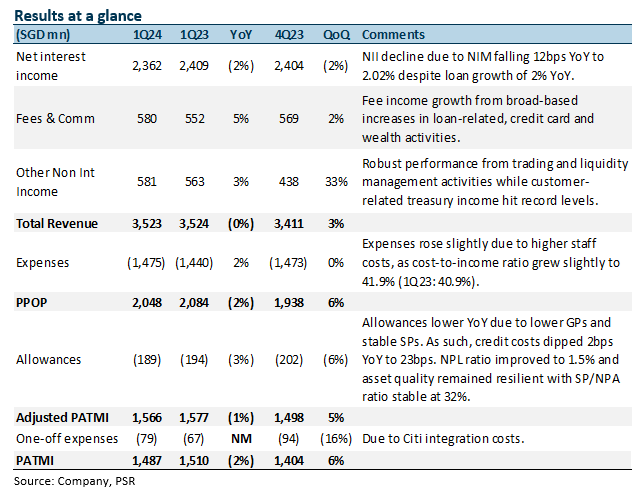
The Positives
+ Fee income continues to grow. Fees grew 5% YoY, largely due to higher loan-related fees of S$244mn (+3% YoY) and a pickup in wealth management fees to S$164mn (+6% YoY) due to a return in investor confidence. Notably, wealth management assets under management (AUM) grew 11% YoY to S$179bn. Credit card fees continued to grow, reaching S$90bn in 1Q24 (+11% YoY) but normalized from last quarter’s seasonal high (-28% QoQ). Fee income makes up 16% of total income (1Q23: 16%).
+ Trading and investment income rose 10% YoY. The growth was led by customer-related treasury income hitting a record level of S$219mn (+8% YoY) from increased retail bond sales and strong hedging demands, while trading and liquidity management activities continued to perform well (+11% YoY). Customer-related treasury income makes up 42% of trading and investment income (1Q23: 43%). Other non-interest income was up 3% YoY and 33% QoQ.
+ Credit costs and new NPAs dip YoY. Credit costs dipped 2bps YoY to 23bps as total allowances fell slightly by 3% YoY, mainly from a decline in SPs (-4% YoY) on lower NPL formation, while GPs remained stable. New NPA formation fell by 17% YoY to S$249mn as asset quality stabilised during the quarter. NPL ratio improved by 10bps YoY and remained stable QoQ at 1.5%. Asset quality remained resilient, with SP/NPA stable at 32%. 1Q24 NPA coverage is at 99%, and unsecured NPA coverage is at 204%.
The Negative
- NII declines YoY as NIMs soften. NII dipped 2% YoY from NIM falling 12bps YoY to 2.02% mainly due to loan margin compression due to competition for high-quality credits and high cost of funding as the impact from the recent deposit repricing has yet to be felt. Nonetheless, interbank and securities margin remained stable at 1.11% from active management of excess liquidity. Loans grew slightly by 2% YoY, driven by selective good credits and short-term trade loans.
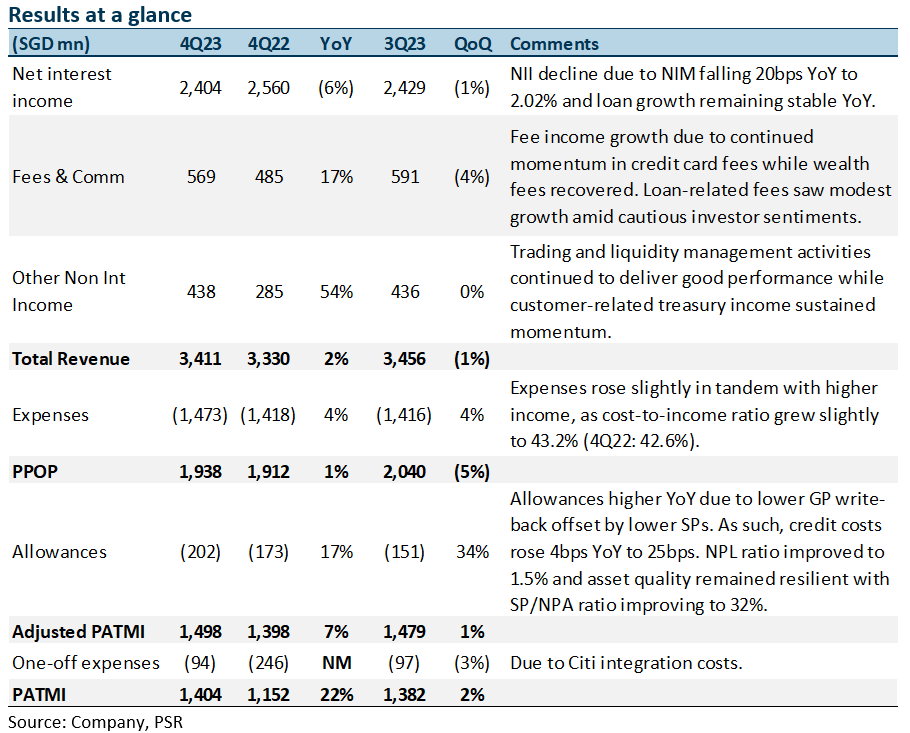
The Positives
+ Fee income continues the strong recovery. Fees grew 17% YoY, largely due to higher credit card fees, which hit a new record of S$125mn (+69% YoY), boosted by higher card spending on an enlarged regional franchise due to the Citi integration. Wealth management fees recovered modestly by 21% YoY, while loan-related fees grew 5% YoY amid cautious investor sentiment. Fee income now makes up 17% of total income (4Q22: 15%). On a full-year basis, fee income rose 4%, driven by record-high credit card fees, underscored by higher customer spending, expanded regional franchise, and higher wealth fees. This was partly offset by softer loan-related fees amid cautious corporate sentiment.
+ Other non-interest income surges YoY. Other NII surged 54% YoY as customer-related treasury income sustained momentum while trading and liquidity management activities continued to deliver good performance. On a full-year basis, other NII spiked 85% to S$2bn from all-time high customer-related treasury income and strong performance from trading and liquidity management activities.
+ New NPAs dipped 2% YoY. New NPA formation fell by 2% YoY to S$389mn as asset quality stabilised during the quarter. The NPL ratio improved by 10bps YoY and QoQ to 1.5%. Asset quality remained resilient, with SP/NPA improving slightly to 32%. 4Q23 NPA coverage is at 101%, and unsecured NPA coverage is at 209%.
The Negatives
- NII declines YoY as NIMs soften. NII dipped 6% YoY from NIM, falling 20bps YoY and 7bps QoQ to 2.02% mainly from loan margin compression due to competition for high-quality credits and loans remaining flat YoY. The decline in loan growth from Singapore was offset by growth in North Asia and the rest of the world. UOB is guiding for a low-single-digit loan growth for FY24e.
- Credit costs increase due to lower GP write-back. Total allowances rose by 17% YoY to S$202mn mainly due to a lower general allowance write-back of S$9mn (4Q22: write-back of S$80mn) despite specific allowance falling by 16% YoY to S$212mn. Credit costs rose by 4bps YoY to 25bps, with full-year FY23 credit costs coming in at UOB’s guidance of 25bps (+5bps YoY). Nonetheless, the total general allowance for loans, including RLARs, was prudently maintained at 0.9% of performing loans. UOB has guided for credit costs to come in at the lower end of 25-30bps for FY24e.
- Expenses up 4% YoY. Excluding one-offs, expenses rose 4% YoY to S$1,473mn. The increase was across the board, including staff costs, revenue-related and IT-related expenses. Nonetheless, the cost-to-income ratio (CIR) was relatively stable and rose 0.6% points YoY to 43.2% on the back of strong income growth, with full-year CIR improving by 1.8% points to 41.5%. UOB has guided CIR to remain stable at around 41% to 42% for FY24e and for the one-time costs from the Citigroup acquisition to roll off substantially.
Outlook
PATMI: We expect UOB’s profits to grow 8% in 2024e on the back of stable margins, loan growth recovery, stronger fees and stable provisions. We expect credit costs to come in around the guidance of 25bps. UOB has guided for loan growth of low single digits and NIM of around 2% for FY24e.
Fee income: UOB expects fee income to continue its recovery and for the growth to be led by credit card fees and wealth and fund management fees as the market sentiment recovers. Wealth management AUM has grown 14% YoY to S$176bn. UOB has successfully integrated their Citi portfolios in Malaysia and Indonesia, with Thailand and Vietnam to be completed by FY24, which could further expand their regional franchise. As such, they have guided for double-digit fee income growth in FY24e, which could add ~S$220mn to revenue.
Loan growth: UOB expects to see demand for loans pick back up with rate cuts expected in 2H24 and is guiding for loans to grow 1-3% in Singapore and 4-5% in the region. However, we expect a slowdown in the first few quarters of FY24 as rates remain high with the recovery to come in 2H24. Management have guided low-single-digit loan growth for FY24e.
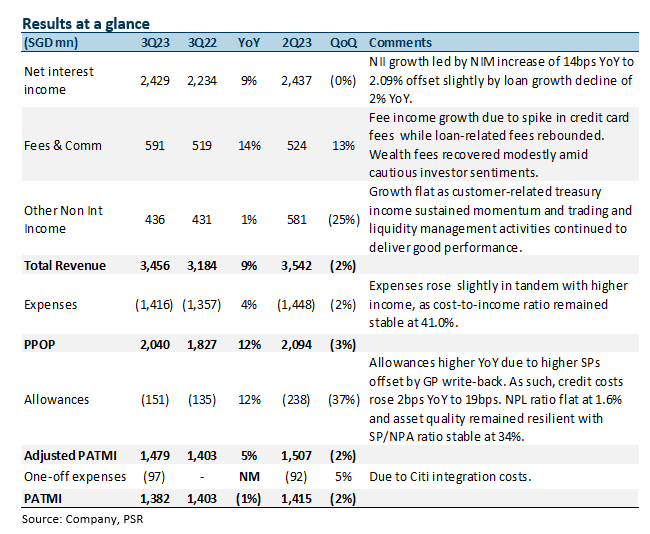
The Positives
+ NII and NIM continue to grow YoY. NII grew 9% YoY, despite a decline in loan growth of 2% YoY, while NIM rose 14bps YoY to 2.09% but declined 3bps QoQ due to lower margin on excess liquidity. Loan growth decline was from Singapore and Indonesia offset by growth in the rest of ASEAN. UOB has maintained its loan growth guidance for FY23e at low to mid-single digit and is guiding for a mid-single digit loan growth for FY24e.
+ Fee income recovers to near an all-time high. Fees grew 14% YoY largely due to higher credit card fees which hit a new record of S$104mn (+89% YoY) while loan-related fees rebounded and grew 5% YoY. Wealth management fees recovered modestly amid cautious investor sentiment. On a QoQ basis, fee income rose 13% from broad-based growth across all segments. Fee income now makes up 17% of total income (3Q22: 16%).
+ New NPAs fall 27% QoQ. New NPA formation fell by 27% QoQ to S$267mn as asset quality stabilised during the quarter. The NPL ratio remained stable QoQ but rose by 10bps YoY to 1.6%. Asset quality remained resilient with SP/NPA increasing slightly to 34%. 3Q23 NPA coverage is at 102% and unsecured NPA coverage at 205%.
The Negatives
- Other non-interest income growth flat YoY and declined QoQ. Other NII growth was flat YoY as customer-related treasury income sustained momentum while trading and liquidity management activities continued to deliver good performance. However, other NII fell 25% QoQ as growth in customer-related treasury income was more than offset by lower valuation on investments due to market volatility.
- Credit costs increase due to higher SPs despite GP write-back. Total allowances rose by 12% YoY to S$151mn mainly due to specific allowance increasing by 80% YoY to S$229mn despite a general allowance write-back of S$78mn for the quarter. The increase in specific allowance was a pre-emptive move to rebalance collateral value in US and Hong Kong/China. Management said that the accounts were not distressed or non-performing. This resulted in credit costs increasing by 2bps YoY to 19bps. Nonetheless, total general allowance for loans, including RLARs, was prudently maintained at 0.9% of performing loans. UOB has maintained its guidance for credit cost of around 25bps for FY23e and has guided for 25-30bps for FY24e.
- Expenses up 4% YoY. Excluding one-offs, expenses rose 4% YoY to S$1,416mn. The increase was across the board, including staff costs, revenue-related and IT-related expenses. Nonetheless, the cost-to-income ratio (CIR) improved 1.6% points YoY to 41.0% on the back of strong income growth. UOB has guided for cost-to-income ratio to remain stable in FY24e and for the one-time costs from the Citigroup acquisition to substantially roll off.
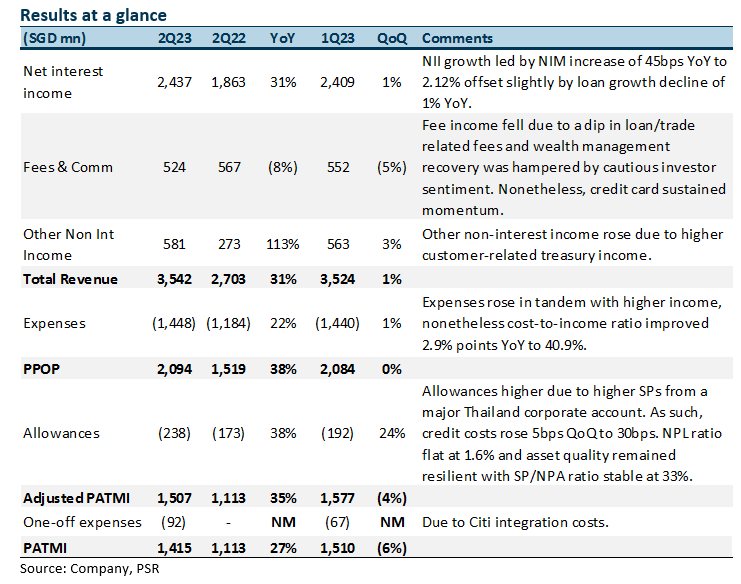
The Positives
+ NII surges on the back of strong NIM expansion. NII grew 31% YoY, despite a decline in loans growth of 1% YoY, while NIM surged 45bps YoY to 2.12% but declined 2bps QoQ due to excess liquidity deployed to high quality assets. Loan growth decline was due to weakness in Singapore and North Asia offset by growth in the rest of ASEAN. UOB has maintained its loan growth guidance for FY23e at low to mid-single digit.
+ Other non-interest income surged in 2Q23. Other NII increased 113% YoY largely due to higher customer-related treasury income and strong performance from trading and liquidity management activities this quarter. Management also noted record high customer-related treasury income from increased hedging demands and good performance from trading and liquidity management activities.
+ New NPAs fall 45% YoY. New NPA formation fell by 45% YoY to S$364mn as asset quality stabilised during the quarter. The NPL ratio remained stable YoY and improved 10bps QoQ to 1.6%. Asset quality remained resilient with SP/NPA increasing slightly to 33%. 2Q23 NPA coverage is at 99% and unsecured NPA coverage at 209%.
The Negatives
- Fee income fell YoY and QoQ. Fees fell 8% YoY largely due to lower loan-related fees and wealth management fees as investor sentiments remained subdued, offset by a continued increase in credit card fees. On a QoQ basis, fee income fell 5% from lower wealth fees as investor sentiments remained muted offset by sustained momentum in credit card fees.
- Credit costs increase due to higher SPs and GPs. Total allowances rose by 38% YoY to S$238mn mainly due to specific allowance increasing by 22% YoY to S$202mn largely due to a major Thailand corporate account and general allowance of S$36mn (2Q22: S$7mn). This resulted in credit costs increasing by 8bps YoY to 30bps. Nonetheless, total general allowance for loans, including RLARs, was prudently maintained at 1.0% of performing loans. UOB has increased its guidance for credit cost from 20-25 bps to around 25bps for FY23e. Management said that the major Thailand corporate account is in the manufacturing sector and was hit by fraud, for which they had to fully provide for, nonetheless they do not see any systemic risk from this account.
- Expenses up 22% YoY. Excluding one-offs, expenses rose 22% YoY to S$1,448mn. The increase was due to continued focus on investments to enhance capabilities to drive strategic initiatives. Nonetheless, the cost-to-income ratio (CIR) improved 2.9% points YoY to 40.9% on the back of strong income growth. UOB has maintained its guidance for a CIR of 43-44% for FY23e, and to trend below 42% by FY24e.
The Positives
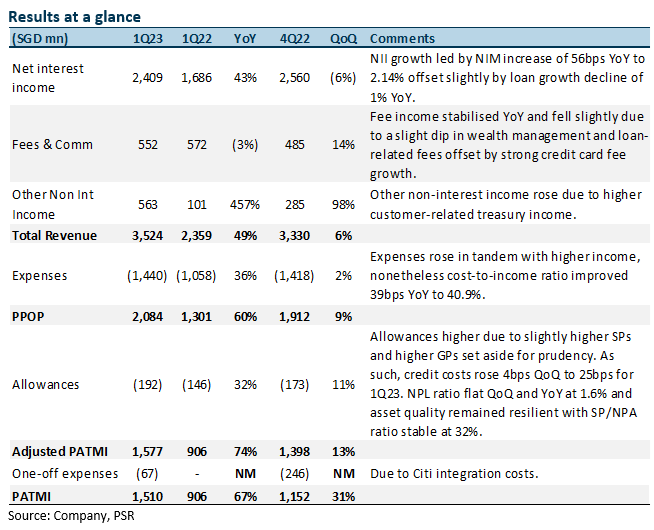
+ Fee income recovery on track, 14% QoQ growth. Fees fell 3% YoY largely due to lower wealth and fund management fees as investor sentiment remained subdued, 1Q23’s decline is significantly smaller than 4Q22’s YoY decline of 16%. Nonetheless, fee income saw its first QoQ increase in four quarters, rising 14% QoQ largely due to a recovery in wealth management fees of 27% QoQ as investor sentiments started to improve. Likewise, loan-related fees rebounded 14% QoQ, while credit card fees sustained its momentum despite seasonally softer quarter.
+ Other non-interest income surged in 1Q23. Other NII increased 457% YoY and 98% QoQ largely due to the higher customer-related treasury income, which was driven by hedging
demands. Management also noted good performance from trading and liquidity management activities, which boosted trading and investment income to an all-time high.
+ New NPAs fall 42% YoY. New NPA formation fell by 33% YoY to S$301mn as asset quality stabilised during the quarter. The NPL ratio remained stable YoY and QoQ at 1.6%. Asset quality remained resilient with SP/NPA dipping slightly to 32%. 1Q23 NPA coverage is at 96% and unsecured NPA coverage at 212%.
The Negatives
- First NIM QoQ decline since 3Q21. NII grew 43% YoY, despite a decline in loans growth of 1% YoY, while NIM surged 56bps YoY to 2.14% but declined QoQ for the first time in 6 quarters by 8bps (QoQ: 3Q22: +28bps, 4Q22: +27bps, 1Q23: -8bps) mainly from liquidity surplus placed into high quality assets and increase in funding costs. Loan growth decline was due to corporates paring down their borrowings, while trade and mortgage loans were stable. The consolidation of Citi assets added 9% to the ASEAN loan book in 1Q23. UOB has lowered its loan growth guidance for FY23e from a mid-single digit to low to a mid-single digit.
- Credit costs increase due to higher SPs and GPs. Total allowances rose by 32% YoY to S$192mn mainly due to specific allowance increasing by 11% YoY to S$164mn on a few non-systemic accounts and general allowance of S$28mn (1Q22: write-back of S$2mn). This resulted in credit costs increasing by 6bps YoY to 25bps. Nonetheless, total general allowance for loans, including RLARs, was prudently maintained at 1.0% of performing loans. UOB has maintained its guidance for credit cost of 20-25 bps for FY23e.
- Expenses up 36% YoY. Excluding one-offs, expenses rose 36% YoY to S$1,440mn in 1Q23. The increase was mainly due to continued focus on investments to enhance capabilities to drive strategic initiatives. Staff costs rose 38% YoY while IT-related expenses rose 32% YoY during the quarter. Nonetheless, the cost-to-income ratio (CIR) improved 3.9% YoY to 40.9% on the back of strong income growth. UOB has maintained its guidance for a CIR of 43-44% for FY23e, and to trend below 42% by FY24e.
