United Overseas Bank Limited – Fee income disappoints but NIM resilient
-
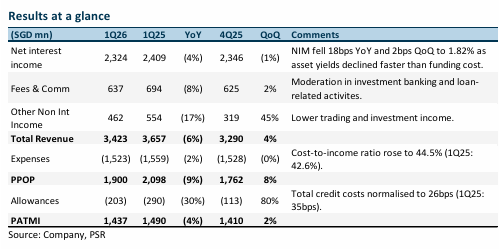
1Q26 earnings of S$1,437mn were within our estimates, at 26% of our FY26e forecast. NII fell 4% YoY to S$2,324mn as 4% loan growth partially offset 18bps NIM compression to 1.82%. NIM held up better QoQ (-2bps) as funding cost management (+15bps) largely offset asset repricing drag (-14bps) from lower SORA and HIBOR.
-
Fee income of S$637mn fell 8% YoY against a record 1Q25 base and trading income declined 13% YoY to S$405mn. Total credit costs at 26bps were within guidance, and the NPL ratio was stable at 1.5%, but the NPL ratio in Greater China rose to 3.5% (4Q25: 3.3%) amid continued CRE stress. CET1 strengthened to 15.3%. Management maintained FY26e guidance (NIM at 1.75-1.80%, low-single-digit loan growth, credit costs around 25-30bps, and high-single digit fee income growth) and reaffirmed its ambition to double wealth income by 2030 (off a 2025 base).
-
Maintain NEUTRAL with an unchanged target price of S$37.00 as we maintain our FY26e estimates. We assume a 1.26x FY26e P/BV and an ROE estimate of 10.9% in our GGM valuation. We expect UOB’s FY26e earnings to recover by 17% YoY, driven by lower provisions and NIM resilience, which offers modest upside to FY26 guidance of 1.75-1.80%. However, the widening wealth franchise gap vs DBS (AUM S$198bn vs S$492bn) and weak fee momentum remain headwinds. The S$2bn share buyback is 35% completed (S$706mn done), with the balance to be completed by FY27e.
The Positives
+ NIM resilience on funding cost discipline. NIM held at 1.82% (-18bps YoY, -2bps QoQ),
tracking above the upper end of FY26 guidance of 1.75%-1.80%. Execution was strong:
+15bps from active funding cost management nearly fully offset by -14bps asset repricing
drag, despite a 16bps fall in 3M SORA and a 72bps fall in 1M HIBOR. Exit NIM in March 2026
was 1.83%, and we believe margin pressure is stabilising. UOB’s house view is for one more
Fed cut and a limited downside in SORA. We expect FY26e NIM to come in at the upper end
of guidance, providing a tailwind for NII and PATMI.
+ Cost discipline maintained; CIR improved QoQ. Total expenses of S$1,523mn were
broadly flat QoQ (-2% YoY), with CIR improving 1.9pp QoQ to 44.5%. Management is
maintaining headcount discipline via productivity gains and natural attrition while
continuing to invest in technology and wealth capabilities. FY26 cost growth guidance of
low single digits remains unchanged, suggesting management is balancing reinvestment in
the 2H26 wealth rollout with cost discipline.
United Overseas Bank Limited – Earnings recover as provisions stabilise
-
4Q25 earnings of S$1,410mn were slightly below our estimates from lower-than-expected NII and other non-interest income. FY25 PATMI was 98% of our FY25e forecast. Final dividend declined 23% YoY to 71cents with FY25 dividends at S$1.81, including the 25cents capital return dividend (FY24: S$2.05, including 25cents capital return dividend). The dividend payout ratio was kept at 50%.
-
NII fell 4% YoY from NIM compression of 16bps, while fee income rose 10% YoY. Allowances fell 50% from lower SPs and credit costs normalised to 19bps (4Q24: 25bps). UOB has maintained its FY26e guidance of NIM at 1.75-1.80%, low-single-digit loan growth, and credit costs at around 25-30bps but lowered fee income growth to high single (from high single to double-digit). We expect FY26e earnings to increase by ~18%, mainly driven by a recovery in fee income and a decline in allowances.
-
Maintain NEUTRAL with a higher target price of S$37.00 (prev. S$36.70) as we roll over our valuations to FY26e. We lower FY26e earnings by ~5% from the lower fee income estimate. We assume a 1.26x FY26e P/BV and an ROE estimate of 10.9% in our GGM valuation. We expect UOB’s FY26e earnings to increase by ~17% YoY, driven by fee income growth and lower provisions. NIM compression will ease in FY26e as funding costs continue to improve from deposit rate cuts. Fee income will be the most significant driver from the successful integration of Citi portfolios, which will accelerate UOB’s expansion into ASEAN. UOB reaffirmed its capital return plan and will complete the remaining 68% of its S$2bn share buyback programme, or S$1.4bn.


United Overseas Bank Limited – Provisions stockpiling hits earnings
-
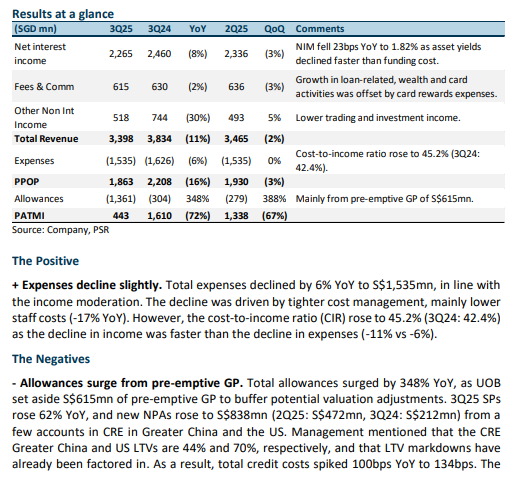
3Q25 earnings of S$443mn were below our estimates from higher-than-expected specific provisions and a S$615mn pre-emptive GP. 9M25 PATMI was 56% of our FY25e forecast.
-
NII fell 8% YoY from NIM compression of 23bps, while fee income dipped 2% YoY. Allowances surged 348% from higher SPs and pre-emptive GP of S$615mn, which will be a one-off to increase NPA coverage. Credit costs are expected to normalise in 4Q25 and FY26e. UOB has provided FY26e guidance of NIM at 1.75-1.80%, low-single-digit loan growth, high single to double-digit fee income, and credit costs at around 25-30bps. We expect FY25e earnings to decline by ~22%, mainly due to the surge in allowances.
-
Maintain NEUTRAL with a lower target price of S$30.40 (prev. S$34.60) as we lower FY25e earnings by ~18% from higher provisions estimate. We assume a 1.08x FY25e P/BV as we lower our ROE estimate to 11.1% (prev. 12.3%) in our GGM valuation. We expect UOB’s FY25e earnings to decline by ~22% YoY from the pre-emptive S$615mn GP set aside. NIM compression to ease in 2H25 as funding costs improve from deposit rate cuts. Fee income will be the most significant driver from the successful integration of Citi portfolios, which will accelerate UOB’s expansion into ASEAN. UOB reaffirmed its capital return plan and will maintain its S$2bn share buyback over three years. The dividend payout will exclude the S$615mn pre-emptive GP, and we estimate a FY25e payout ratio of ~74% (including the 50 cents special dividend), while maintaining their 50% dividend payout ratio guidance in FY26e even if absolute DPS declines YoY.
United Overseas Bank Limited – NII and allowances pull down earnings
-
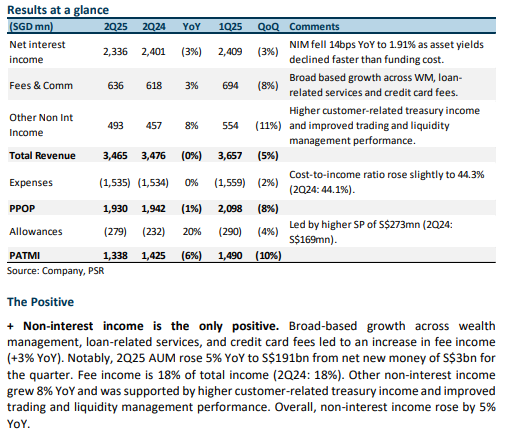
2Q25 earnings of S$1.3bn were below our estimates from lower-than-expected NII and higher provisions. 1H25 PATMI was 47% of our FY25e forecast. Interim dividend fell 3% YoY to 85 cents, with dividend payout ratio stable at 50%.
-
NII dipped 3% from NIM compression of 14bps, while fee income rose by 3% YoY. Allowances up 20% from higher SPs, mitigated by pre-emptive provisions. UOB has provided FY25e guidance for NIM of 1.85-1.90%, low-single digit loan growth, high-single digit fee income, and credit costs at around 25-30bps from a top-up in GP buffer. We expect FY25e earnings to decline by ~4% as margin compression continues.
-
Downgrade to NEUTRAL from ACCUMULATE with a lower target price of S$34.60 (prev. S$36.30) as we lower FY25e earnings by ~4% from lower NII and fee income estimates. We assume a 1.23x FY25e P/BV as we lower our ROE estimate to 12.3% (prev. 12.8%) in our GGM valuation. We expect UOB’s FY25e earnings to decline by ~4% YoY from the decline in NII. NIM compression to ease in 2H25 as funding costs improve from deposit rate cuts. Fee income will be the most significant driver from the successful integration of Citi portfolios, which will accelerate UOB’s expansion into ASEAN. UOB reaffirmed its plan to return S$3bn of surplus capital over FY25-FY27, including a 50 cents/share payout in FY25 and a S$2bn share buyback over three years, but will maintain its 50% dividend payout ratio guidance even if absolute DPS declines YoY.
United Overseas Bank Limited – Stashing provisions under the mattress
-
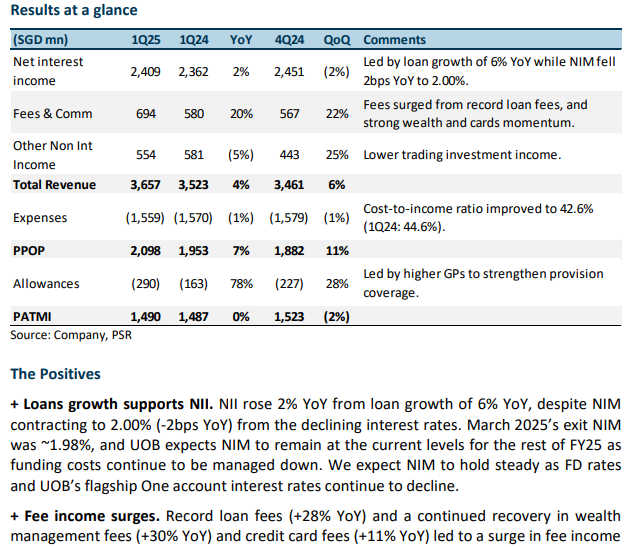
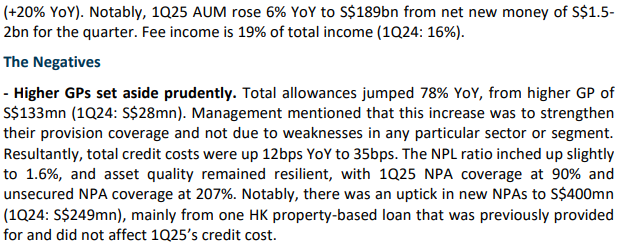
1Q25 earnings of S$1.5bn were below our estimates from lower-than-expected NII and higher provisions. 1Q25 PATMI was 22% of our FY25e forecast.
-
NII inched up 2% from loan growth of 6%, while fee income surged by 20% YoY. Allowances jumped 78% from higher GP to strengthen their provision coverage. UOB has suspended its FY25e guidance amid macroeconomic uncertainties but mentioned that US tariffs had minimal direct impact, with only about 2% exposure from US exporters, and, given that its major customers in ASEAN and China largely do not sell to the US, credit quality is expected to remain stable even as growth slows.
-
Maintain ACCUMULATE with a lower target price of S$35.50 (prev. S$39.80) as we lower FY25e earnings by ~10% from lower NII and other non-interest income estimates. We assume a 1.26x FY25e P/BV as we lower our ROE estimate to 12.8% (prev. 14.3%), risk-free rate to 2.5% (prev. 3.1%) and terminal growth rate to 1% (prev. 2%) in our GGM valuation. We expect UOB’s FY25e earnings will be flat YoY as excess profits will be placed into GP to strengthen their provision cover. NIM will be maintained by cutting deposit costs and continuing to increase loan growth. At the same time, fee income will be the biggest driver from the successful integration of Citi portfolios, which will accelerate UOB’s expansion into ASEAN. There is further upside to our estimated 6.6% dividend yield (including the 50-cent special dividend) should UOB raise the dividend payout ratio above 50%. We believe the special dividend can continue for at least two more years (until FY27) to reach UOB’s CET-1 optimal range of 14%.
United Overseas Bank Limited – Higher allowances hurt earnings
-
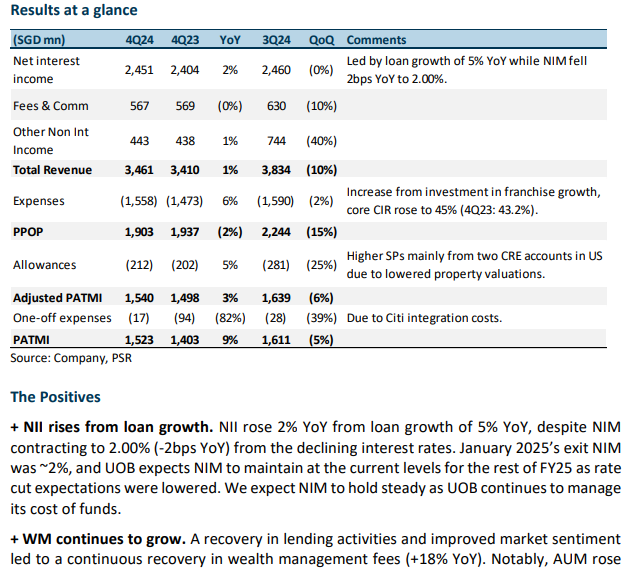
4Q24 adjusted earnings of S$1.54bn were slightly below our estimates from lower-than-expected fee income and higher provisions. FY24 adjusted PATMI was 97% of our FY24e forecast. 4Q24 DPS was up 8% YoY to 85 cents; the full-year FY24 dividend rose 6% YoY to 180 cents. A S$3bn capital distribution package (50 cents special dividend in FY25 and S$2bn share buyback) was announced.
-
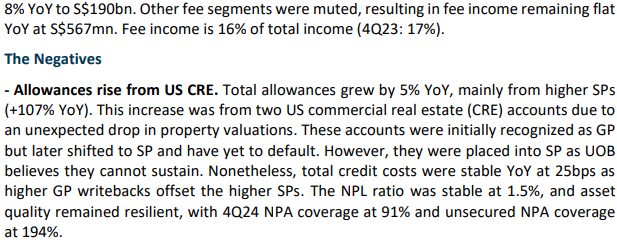
NII increased from loan growth of 5%, while fee and other non-interest income remained flat. Allowances rose 5% from higher SPs. UOB has provided FY25e guidance for “higher total income” from high single-digit loan growth and double-digit fee growth. We expect FY25e earnings to grow ~12% YoY from more substantial fees, trading income, and loan growth recovery while NII and NIM remain stable.
-
Maintain ACCUMULATE with a higher target price of S$41.80 (prev. S$37.00) as we roll over our valuations. We lower FY25e earnings by ~3% from lower non-interest income estimates, and higher provisions estimates. We assume a 1.49x FY25e P/BV and ROE estimate of 14.3% in our GGM valuation. UOB will be able to maintain NII and NIM by cutting deposit costs and continuing to increase loan growth. The successful integration of Citi portfolios will boost fee income as UOB expands in ASEAN. There is further upside to our estimated 6.5% dividend yield (including the 50-cent special dividend) should UOB raise the dividend payout ratio above 50%. We believe the special dividend can continue for at least two more years (until FY27) to reach UOB’s CET-1 optimal operating range of 14%.
United Overseas Bank Limited – Other non-interest income boost earnings
-
3Q24 adjusted earnings of S$1,639mn were slightly above our estimates from a jump in trading and investment income, and higher fee income. 9M24 adjusted PATMI was 76% of our FY24e forecast.
-
Positives include a surge in trading income (+131% YoY), continued recovery in WM fees (+25% YoY) and NII inching up from loans growth of 5%, while negatives were higher allowances from Thailand operational merger issues. UOB has maintained their FY24e guidance for double-digit fee income growth and low-single digit loans growth with NIM to hold above 2%, while providing FY25e guidance for “higher total income” from high single-digit loan growth and double-digit fee growth. We expect double-digit trading income growth in 4Q24 from higher volatility surrounding the US elections.
-
Maintain ACCUMULATE with a higher target price of S$37.00 (prev. S$34.90) as we raise our FY24e estimates. We increased FY24e earnings by ~4% from higher fee and trading income estimates and lower OPEX estimates. We assume 1.49x FY24e P/BV and ROE estimate of 14.4% in our GGM valuation. UOB will be able to maintain NII and NIM from cutting deposit costs and continuing to increase loan margins. We expect 4Q23 earnings to grow ~15% YoY from continued loan growth recovery from rate cuts and double-digit WM and trading income growth, which will boost earnings. UOB has also mentioned possible share buybacks, which would further improve ROE and EPS.


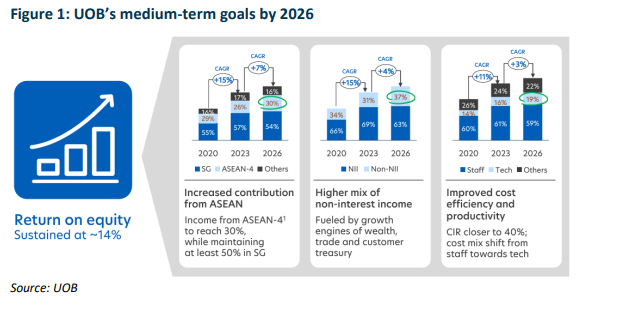
United Overseas Bank Limited – ROE to sustain at 14%
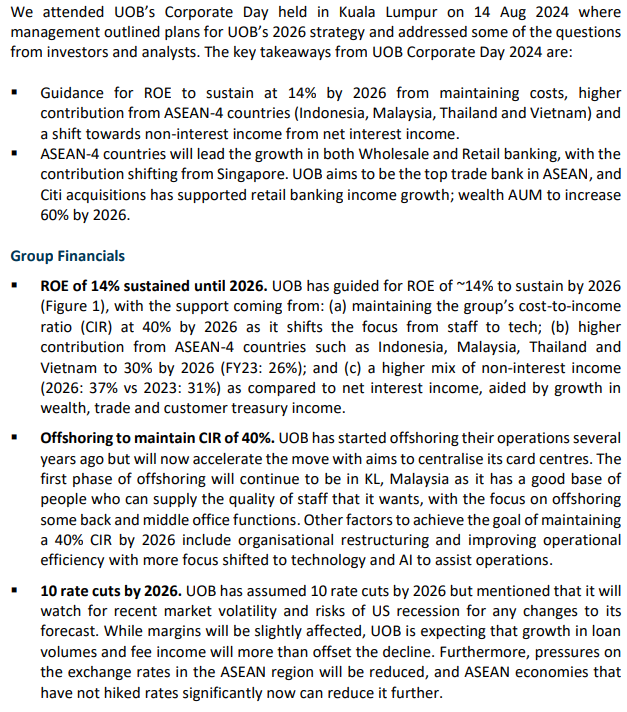
- Guidance for ROE to sustain at 14% by 2026 from maintaining costs, higher contribution from ASEAN-4 countries (Indonesia, Malaysia, Thailand and Vietnam) and a shift towards non-interest income from net interest income.
- ASEAN-4 countries will lead the growth in both Wholesale and Retail banking, with the contribution shifting from Singapore. UOB aims to be the top trade bank in ASEAN, and Citi acquisitions has supported retail banking income growth; wealth AUM to increase 60% by 2026.
- Upgrade to BUY with an unchanged target price of S$34.90 as we account for recent share price performance. Our FY24e estimates remain unchanged. We assume 1.41x FY24e P/BV and ROE estimate of 13.9% in our GGM valuation. UOB will be able to maintain NII and NIM by cutting deposit costs and continuing to increase loan margins. Other tailwinds include loan growth recovery from rate cuts in 2H24 and double-digit fee income growth, which will boost earnings
United Overseas Bank Limited – Trading and investment offset fees growth
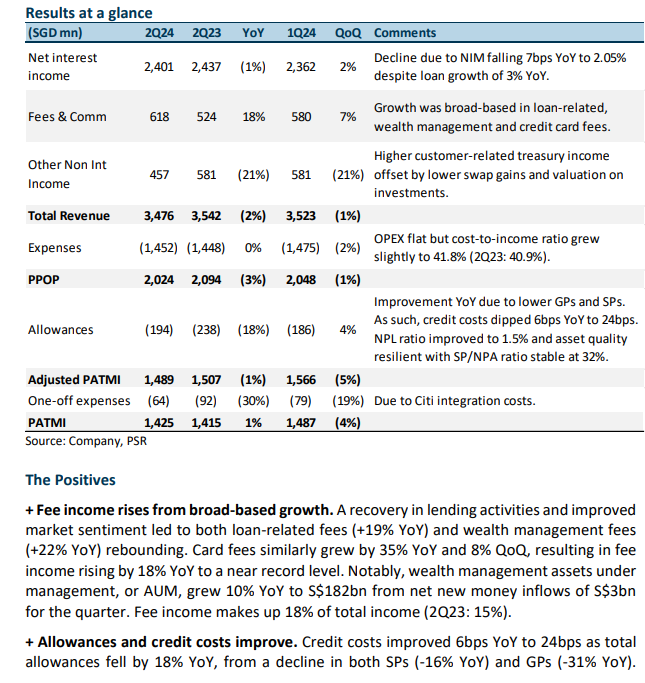
- 2Q24 adjusted earnings of S$1,489mn met our estimates as higher fee income and lower allowances were offset by lower-than-expected NII and other non-interest income. 1H24 adjusted PATMI was 49% of our FY24e forecast. 1H24 interim dividend up 4% YoY to 88 cents.
- Positives include fee income growth of 18% YoY and allowances dipping 18% YoY, while negatives were NII declining by 1% YoY as NIMs fell 7bps and trading and investment income decreased by 21% YoY. UOB has maintained their FY24e guidance of low-single-digit loans growth, NIM to come in above 2%, double-digit fee income growth, stable cost-to-income ratio of around 41-42% and credit cost at the lower end of 25-30bps.
- Downgrade to ACCUMULATE with an unchanged target price of S$34.90 as we account for recent share price performance. Our FY24e estimates remain unchanged. We assume 1.41x FY24e P/BV and ROE estimate of 13.9% in our GGM valuation. UOB will be able to maintain NII and NIM from cutting deposit costs and continuing to increase loan margins. Other tailwinds include loan growth recovery from rate cuts in 2H24 and double-digit fee income growth, which will boost earnings.
United Overseas Bank Limited – Non-interest income growth offset NII decline
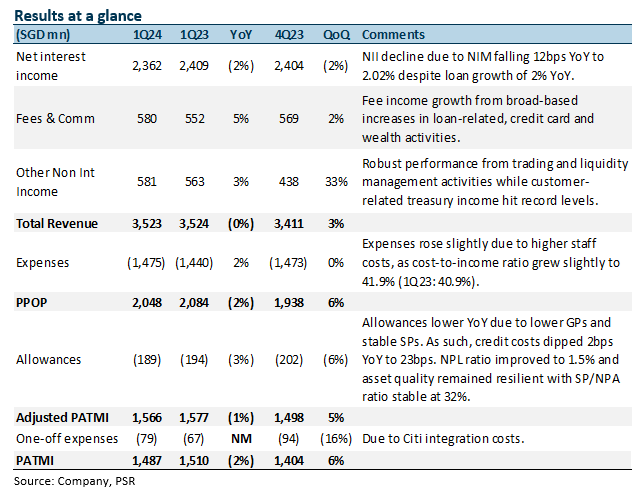
- 1Q24 adjusted earnings of S$1,566mn met our estimates as higher fee income and other non-interest income were offset by lower-than-expected NII and higher expenses. 1Q24 adjusted PATMI was 25% of our FY24e forecast.
- Positives include fee income growth of 5% YoY, trading and investment income rising by 10% YoY, and allowances dipping 3% YoY, while negatives were NII declining by 2% YoY as NIMs fell 12bps. UOB has maintained their FY24e guidance of low-single-digit loans growth, NIM to come in above 2%, double-digit fee income growth, stable cost-to-income ratio of around 41-42% and credit cost at the lower end of 25-30bps.
- Maintain BUY with an unchanged target price of S$34.90. Our FY24e estimates remain unchanged. We assume 1.41x FY24e P/BV and ROE estimate of 13.9% in our GGM valuation. FY24 will be another year of growth from stable NIMs, loan recovery, and double-digit fee income growth, which will boost earnings.
The Positives
+ Fee income continues to grow. Fees grew 5% YoY, largely due to higher loan-related fees of S$244mn (+3% YoY) and a pickup in wealth management fees to S$164mn (+6% YoY) due to a return in investor confidence. Notably, wealth management assets under management (AUM) grew 11% YoY to S$179bn. Credit card fees continued to grow, reaching S$90bn in 1Q24 (+11% YoY) but normalized from last quarter’s seasonal high (-28% QoQ). Fee income makes up 16% of total income (1Q23: 16%).
+ Trading and investment income rose 10% YoY. The growth was led by customer-related treasury income hitting a record level of S$219mn (+8% YoY) from increased retail bond sales and strong hedging demands, while trading and liquidity management activities continued to perform well (+11% YoY). Customer-related treasury income makes up 42% of trading and investment income (1Q23: 43%). Other non-interest income was up 3% YoY and 33% QoQ.
+ Credit costs and new NPAs dip YoY. Credit costs dipped 2bps YoY to 23bps as total allowances fell slightly by 3% YoY, mainly from a decline in SPs (-4% YoY) on lower NPL formation, while GPs remained stable. New NPA formation fell by 17% YoY to S$249mn as asset quality stabilised during the quarter. NPL ratio improved by 10bps YoY and remained stable QoQ at 1.5%. Asset quality remained resilient, with SP/NPA stable at 32%. 1Q24 NPA coverage is at 99%, and unsecured NPA coverage is at 204%.
The Negative
- NII declines YoY as NIMs soften. NII dipped 2% YoY from NIM falling 12bps YoY to 2.02% mainly due to loan margin compression due to competition for high-quality credits and high cost of funding as the impact from the recent deposit repricing has yet to be felt. Nonetheless, interbank and securities margin remained stable at 1.11% from active management of excess liquidity. Loans grew slightly by 2% YoY, driven by selective good credits and short-term trade loans.
Get access to all the latest market news, reports, technical analysis
by signing up for a free account today!
Login
The full article is only available for premium content subscribers. To continue reading this article, please log in:
Not a Premium Content Subscriber yet? Sign up here!
- Home >
- Phillip Research Report
