The Positive
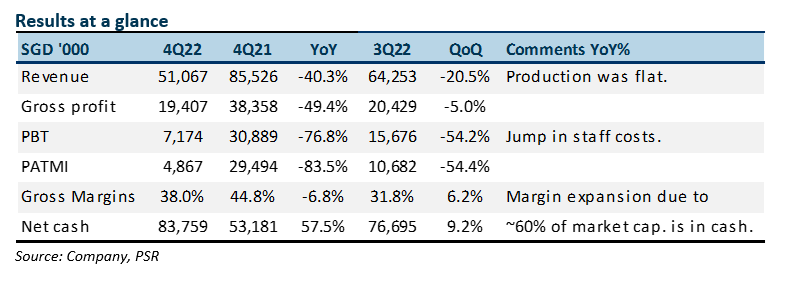
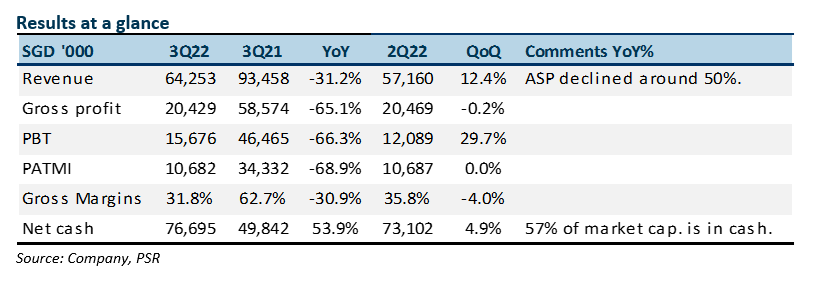
+ Expansion in gross margins QoQ. Gross margins in 4Q22 improved on a QoQ basis to 38%. We believe the trading business drove the bounce in margins. The offset was a doubling in minority interest.
The Negative
- Higher operating expenses. There was an estimated 64% YoY (or S$4.8mn) jump rise in operating expenses in 4Q22. We believe that it was due to the additional headcount in Europe to build the reusable non-glove trading operations.
Outlook
Production in 4Q22 was lower due to existing foreign workers returning home after the border reopened in Malaysia. Recruitment of new foreign workers has also turned slower due to additional social and ethical due diligence. The lack of workers has delayed the commencement of the new 1.2bn piece factory. Other challenges include new competition in key market Brazil as registration and market surveillance of gloves was relaxed. UG is looking to build a new business in reusable industrial gloves for the auto, construction and manufacturing industries. There will be an upfront cost to build the distribution and branding of these gloves.
Company Background
Founded in March 1997, Uni-Asia’s origins were in structured finance and distressed asset investments. The company was listed on the SGX on 17 August 2007. In 2010, the company expanded into ship and property investments. The core businesses of the company are the chartering of bulk carriers, investment properties in Hong Kong and the management and sale of residential projects in Japan. All 10 Uni-Asia bulk carriers are Handysize type vessels.
Investment Merits
Phillip Securities Research has received monetary compensation for the production of the report from the entity mentioned in the report.
Revenue
In FY21, 70% of Uni-Asia revenue was charter income. We expect it to jump to 90% in FY22e. The 2nd largest revenue contributor is the sale of properties at 13%. Fee income and investment returns contribute 8% of revenue each.
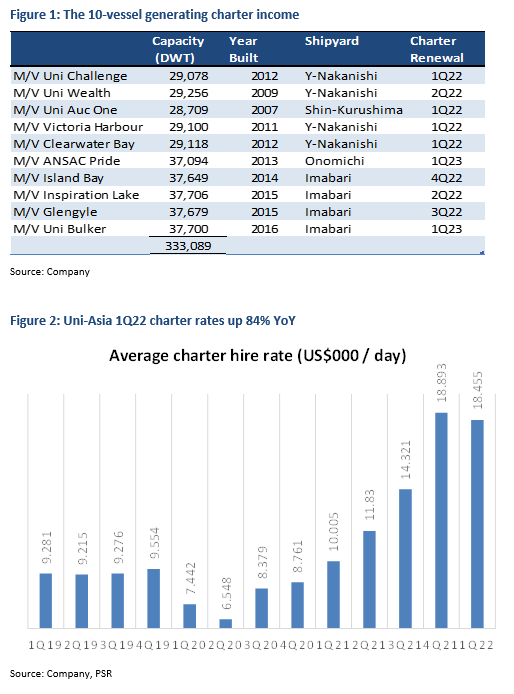
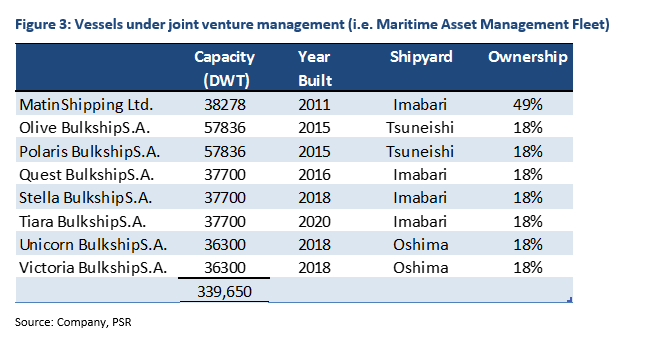
(i) Charter income: Around 80% of Uni-Asia FY21 PBT comes from charter income. It is the rental of the company’s 10 bulk carriers (Figure 1) to shipping lines. The charters for a fixed period (called time charters) on a fixed daily rate. The smaller vessels are typically chartered out for six months and larger vessels for around a year. New vessels upon delivery tend to be chartered for five years to match the loan tenure. Around nine of the 10 vessels are due for renewal this year (Figure 1) and charter rates have been surging since 1Q21 (Figure 2). The key minor bulk cargo is grains, cement, steel, fertiliser, forest products and coal.
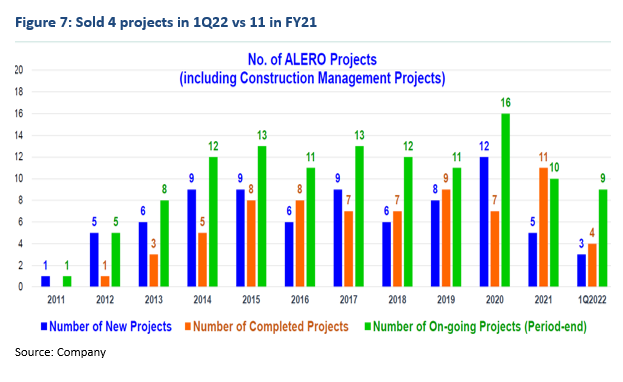
(ii) Sale of properties under development: Revenue is generated from the sale of Alero properties. Gains from the sale of Alero projects were previously recognised as investment gains.
(iii) Fee income: Fee income comes from multiple sources: i) Ship brokerage fee from securing charters for the vessels under management and other third-party customers and sale and purchase of ships.; ii) Project arrangement fees from the arrangement of finance, acquisition, and disposal of properties in Hong Kong and Japan and shipping joint ventures; iii) Asset management fee of Alero property projects in Japan.
(iv) Investment returns: The source of returns are from sales of vessels, fair value gains and gains from the sale of Hong Kong property investments. For FY22e, we expect the bulk of the gains to come from Alero property projects. Sales of Hong Kong properties are expected to be weaker due to the lockdowns still underway.
Expenses
The largest operating cost is voyage expenses to operate the bulk carrier vessels. Around 1/3 of voyage expenses are crew and crew-related costs. Other costs include lubricant oil, consumables, cables, ropes, repairs and maintenance. Fuel cost is not borne by the vessel operator but by the shipping operator. After voyage expenses, the next largest cost is depreciation and amortisation of the vessels. The depreciation period of vessels is around 20 years. Fair valuation above book is implemented for assets in the joint venture.
Margins
Margins are volatile depending on the cycle of the three key businesses. Charter income margins (revenue less voyage expense) have swung from -18% to 57% over the past three years. Maritime services income is stable at around US$0.5mn PBT p.a. Maritime asset management margin is also volatile depending on investment and fair value gains.
Balance Sheet
Assets: Most of the assets in the balance sheet are shipping vessels (59%), which are the 10 bulk tankers. The next largest is cash (16%), investments (14%) and investment properties and properties under development (7%). Investments are predominantly Hong Kong commercial properties. Properties under development are the residential projects in Japan (Alero).
Liabilities: Of the US$98mn in total liabilities, US$84mn or 85% are bank borrowings. The bank borrowings are secured against the vessels and properties. The effective interest rate of the loans ranges from 0.6% to 2.45%, as per FY21. Net borrowings are currently USS$78mn, which is expected to decline to U$47mn with free cash flows (FCF) of US$34mn expected in FY22e.
Cash Flow
FCF generated over the past three years has been strong. Cumulative FCF is US$67mn. Reasons for cash-flows above net profits is due to low CAPEX of only US$2mn p.a. versus depreciation of around US$10mn p.a. We believe there are no plans to purchase vessels in the next two years until there is clarity of the engine type that can meet IMO 2030 regulations. Working capital needs have also been minimal as charters are paid one month in advance.
Business Model
Un-Asia is essentially in 4 core businesses - bulk ship owner, investment properties and management of shipping and property assets for 3rd party. Uni-Asia splits the business into
Industry
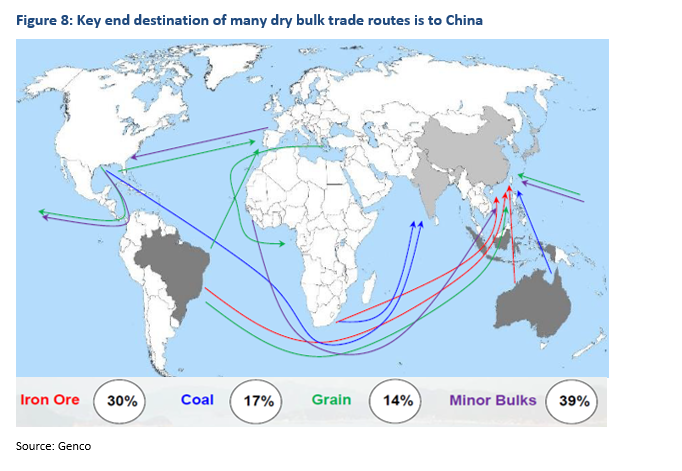
In shipping, dry bulk cargo is almost half of seaborne trade volume (Figure 8). There are around 12,700 dry bulk vessels globally. Dry bulk carriers transport unpackaged bulk cargo, major bulks (iron ore, coal, grains) and minor bulks (fertilizer, cement, sulphur, forest products). Major bulks are around 60% of cargo shipped by tonne-miles. The end destination of many key routes is to China. The key cargo includes the transport of iron ore and grains from Brazil to China and from Australia to China (Figure 8). Dy bulk ship can be separated by DWT capacity (Appendix 1). Uni-Asia 10 vessels are all Handysize, or less than 40k DWT. Above Handysize is the Supramax, Handymax and Ultramax category. We designate all three as Supramax. The 2nd largest category is the Panamax. It refers to the maximum size of a vessel than can transit the Panama Canal. The largest sized bulk carriers are the Capesize. Because they are too large to transit the Panama Canal and need to travel around Cape Horn, South Africa.
The Baltic Dry Index (BDI) enjoyed two major upcycles. The first was in 2004 after China entered the WTO. Then came the super cycle in 2008 following the surge in infrastructure and property projects in China. From 2010, the BDI has been languishing below 2000 to (monthly) lows of 487 in January 2020. Excess supply and slowdown in China were major drivers of the weakness. A significant pick-up in the index occurred in June 2020 due to major supply chain bottlenecks, especially at the ports. The BDI almost quadrupled over five months from 487 in January to 1800 in June 2020.
The Positive
+ More QoQ stability in margins. Gross margins have started to stabilise after a euphoric 58% in FY21. We expect gross margins to stabilise around current levels due to improving latex and distribution margins.
The Negative
- Ramp up of new capacity dependent on labour availability. The new glove factory will raise production capacity by another 1.2bn pieces to 4.6bn. The plant is expected to be completed in May 2022 with production commencing in June. The ability to ramp up production will depend on the arrival of foreign workers. Many industries are queuing up to secure these workers.
Outlook
Chinese manufacturers continue to disrupt generic nitrile glove prices. Their short lead times and aggressive pricing (US$18-19), suggest excess capacity or inventory available from Chinese manufacturers. UGHC will look to outsource their nitrile customer orders from these lower-cost factories. The low prices will allow the distribution business to enjoy attractive margins. UGHC has built up a distribution network, namely in Europe, for nitrile gloves. The new plant will raise the production capacity of latex gloves and support earnings in FY23e. The major challenge in FY23e will be cost pressures from higher minimum wages (effective 1st May) and the increase in gas tariffs.
Maintain BUY with an unchanged target price of S$0.32
After four quarters of falling glove prices, we believe stability has started to creep in. UGHC's new capacity, flexibility to outsource and strong branding and distribution network in emerging markets will allow the company to stabilise earnings.
The Positive
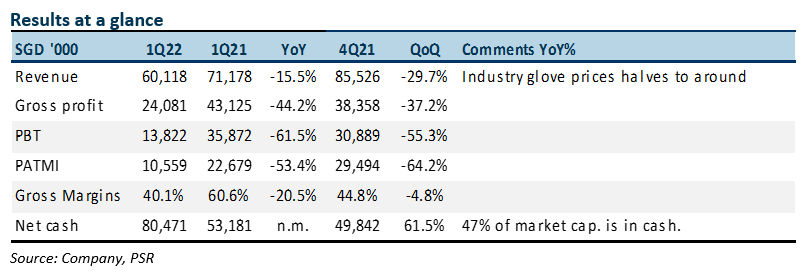
+ Stronger balance sheet. Net cash in 1H21 was S$73.1mn (1H20: $32.5mn), boosted by free cash-flows of S$21.5mn. Net cash represents 43% of the market capitalisation.
The Negative
- Further delay in new capacity. The new 1.2bn glove factory in Seremban will be delayed from March 2022 to May 2022. Construction work stopped from June to August due to lockdowns and labour shortages. It only resumed in mid-September. Meanwhile, the focus for the company will be on glove branding efforts and sourcing of new factory workers.
Outlook
Glove prices especially for nitrile are still declining but at a slower pace. Chinese manufacturers remain the largest price disrupter in the industry prompting Malaysian peers to either match or come closer to the lower prices. The ample capacity in China is reflected by their short delivery times to meet customer orders.
UGHC can fare better than peers despite lower prices by: (i) Outsourcing more customer orders to third party factories to take advantage of these lower factory prices; (ii) UGHC enjoys higher prices as a distributor to end customers. Such end customers pay a premium due to the smaller order quantities of cartons or pellets; (iii) UGHC is experiencing glove demand from new industries such as farming and beauty; and (iv) Emerging market customers are upgrading their quality standards as health awareness has risen significantly due to the pandemic. UGHC’s exposure to emerging markets and latex gloves such as Brazil, China and Nigeria is around 45% of sales.
Upgrade to BUY from ACCUMULATE with an unchanged target price of S$0.32
We find valuations of the company turning more attractive and the pace of decline in glove prices tapering off.
The Positive
+ Production is back to norms. Following a vaccination rate of the workforce above 80%, UGHC can resume operations back to normal levels. The shutdown in 1Q22 has affected their ability to completely fulfil customer orders given the declining inventory and production uncertainty.
The Negative
- Nitrile glove price weakness. Industry nitrile glove selling prices continue to decelerate from between US$70 to US$80 (per thousand pieces) in 4Q21 to US$55 to US$60 in 1Q22. We believe prices are now trending around US$35. Latex glove prices are holding up better at around US$33.
Outlook
Nitrile glove prices are expected to slide further into 2Q22. However, other drivers can keep hold margins relatively stable for UGHC. Firstly, latex glove prices are stabilising as competition from China is concentrated in nitrile gloves; Secondly, nitrile raw material prices are beginning to decline due to excess capacity built up; Thirdly, glove demand is improving due to rising COVID-19 cases and stocking up for the winter season; Fourthly, excess production capacity has provided higher bargaining power and margins for distributors. This provides UGHC with an avenue to outsource some of their customer orders to other factories.
Maintain ACCUMULATE with a lower target price of S$0.32, from S$0.63
We cut FY22e PATMI by 20% to S$39mn. The visibility of glove prices remains an overhang due to the large nitrile capacity coming onstream in China and Malaysia. Our target price for UG is at the historical 30% discount to the Big 4 Malaysian glove makers.
The Positive
+ New capacity installed in April 2021. A 20% expansion in capacity to 3.4bn pieces of gloves was completed in April 2021. However, production was affected by temporary plant shutdowns due to Malaysia’s enhanced movement control order for factories located in Seremban.
The Negative
- QoQ weakness in earnings. Since peaking in 3Q21, we believe industry nitrile glove selling prices declined around 20% to US$80 in 4Q21. This brought down revenue and earnings QoQ.
Outlook
Industry glove selling prices have fallen from US$80 in 4Q21 to likely US$60 in 1Q22e. We do not expect prices to improve even in 2Q22e. Customers are hesitant to stock up, fearful of inventory losses as prices spiral downwards. Prices could deteriorate more as Malaysian manufacturers’ production recovers from the COVID-19 mandated shutdowns and cuts in utilisation. Chinese manufacturers are another source of disruption, with their aggressive expansion in nitrile capacity.
The positive for UG Healthcare is an expansion in effective capacity of at least 20% in FY22e. There would be another 35% jump in effective capacity to 4.6bn gloves in FY23e. Improved scale brings down production costs. Exposure to latex gloves and emerging markets could also offset falling nitrile glove prices, especially in developed markets.
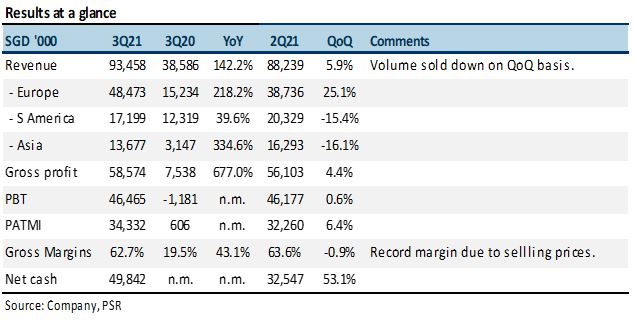
The Positives
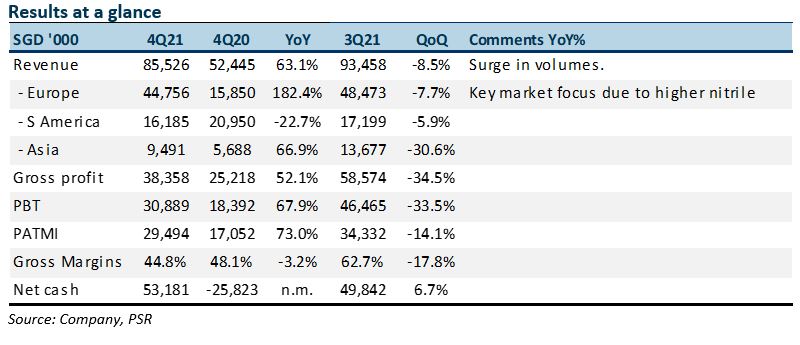
+ Stellar gross margins. Gross margins more than tripled from a year ago to 62.7%. QoQ, margins were moderately lower due to higher raw-material costs.
+ Huge operating leverage. No details on operating expenses were provided. Our estimates are based on the difference between PBT and gross margins. Operating expenses - including associate income - were around 13% of 3Q21 revenue. This was above our modelled 14.7%. Higher prices have not lead to an equivalent rise in administration or marketing expenses. .
+ Cash build-up from record earnings. Record earnings raised net cash to S$49.9mn from 2Q21’s S$32.5mn.
The Negative
- Shipment delays persisted. Container shortages are stretching out delivery times. Shipments that typically take one month have extended to three months. The worst hit are countries such as Brazil where freight rates are lower than in developed countries such as the U.S. and Europe. There wil delays in recognising revenue and more working capital has been tied up as inventory.
Outlook
With glove prices trending down, buyers will not hold much stock. Some customers are already de-stocking from two months’ inventories to just a week. De-stocking plus aggressive pricing by manufacturers from China have created a peak in glove prices. China’s nitrile producers are new with less established distribution channels. They are offering lower prices to penetrate new markets and expanding aggressively. Manufacturers in Malaysia and Thailand are lowering prices to maintain their distributor customers.
UG’s longer-term goal is to build up its customer base, pricing and brand name in its key markets. For instance, a 10-15% pricing premium will yield higher margins and could defend the company against competitors that either sell at or below to gain ground with customers.
UG is also on track to expand capacity by 58% from 3Q21’s 2.9bn to 4.6bn in FY22. Net expansion is 1.7bn, with 500mn already commissioned in April and the remaining 1.2bn to begin from July 2021. Our FY22e revenue growth forecasts are premised on this surge in capacity. Plans for another factory after this phase will be announced when they are finalised.
Maintain BUY with lower target price of S$0.85, from S$1.03
Our target price for UG is set at a 30% discount to the Big 4 glove makers. Historically, UG’s discount was around 40%. As industry valuations are about 10x P/E, our target P/E for FY22e is 7x, translating to a target price of S$0.85.
We raise FY21e PATMI by 7% to S$115.4mn for higher margins and lower operating expenses. FY22e PATMI is lowered by 17% to S$74.7mn as we cut gross margins by 5% points to 37%. This is around 40% below the margins in FY21e as build in a buffer for uncertain glove prices. The jump in capacity plus exposure to low-penetration markets such as Brazil, China and Africa should enable UG to support revenue growth.
Positives
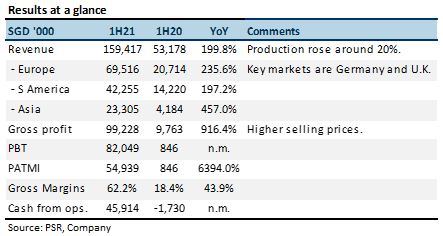
+ Higher selling price drove revenue growth. 1H21 revenue tripled YoY to S$159mn with an estimated 20% growth in volume and 1.5x jump in prices. Sales to China spiked 457% YoY as customers stocked up ahead of winter and the festive season.
+ Gross margins remained robust. 1H21 gross margin was 62%, triple that of 1H20 as glove prices skyrocketed. QoQ, margins expanded from 60.6% in 1Q21 to 63.6% in 2Q21.
+ Record earnings bolstered cash. Cash from operations rose to S$45.9mn. The company now has net cash of S$32.5mn, a major reversal from net debt of S$37mn a year ago. UG announced a special DPS of S$0.00105 and a total payout of S$0.645mn.
Negative
- Some lag in deliveries and higher costs. There have been shipment delays. As a result, inventories almost doubled in the past six months to S$57mn. Inventories were predominantly finished goods on transit to Europe. Container constraints are expected to ease only after February. Shipping rates to Europe have catapulted almost 5-fold to around US$10,000 per container. Even then, shipping rates only account for around 2% of UG’s selling prices.
Outlook
Earnings are still expected to grow QoQ as prices continue to climb in 2021. We also see other growth drivers for UG even if glove prices taper off. Firstly, production capacity will expand by 35% YoY to 4.6bn pieces in FY22e. Secondly, exposure to emerging markets and low penetration rates could provide sources of growth.
Other updates:
Maintain BUY with lower target price of S$1.03, from S$1.35
We continue to value UG at a 30% discount to the Big 4 glove makers. Historically, UG’s discount was around 40%. As industry valuations have corrected to around 10x PE, our target PE for FY22e drops from 14x to 7x. This lowers our TP from S$1.35 to S$1.03.
We raise FY21e PATMI by 28% to S$107.8mn to account for the continuous rise in its ASPs and margins. Our FY22e PATMI assumes a 24% YoY contraction in ASPs to around S$80 per 1,000 gloves. We also assume a 15% increase in production costs in FY22e.
Positives
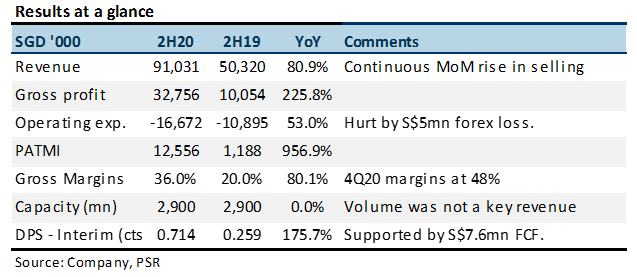
+ Spike in revenue. Revenue jumped 81% YoY in 2H20. We believe the bulk of the growth came from higher selling and more distribution volume. Production capacity was flat on a YoY basis at 2.9bn gloves. By country, the fastest-growing major market was Brazil +191% YoY, USA +26% YoY and Europe +22% YoY. Europe remains the largest market at 36% of sales, followed by Brazil at 33%.
+ Record gross margins. Gross margins were at a record 36% in 2H20. Most of the price increases of around 10% mom were pure profit as production cost were relatively flat. The 4Q20 margins stood at 48% as ASPs only significantly increase from April onwards.
+ Positive operating leverage. Past three years, UG net profit was dragged down by administrative expenses as it was expanding its distribution network. Admin expenses, which are relatively fixed in nature, was around 13% of sales. 2H20 admin expenses dropped to 8% of sales and only rose 5% YoY.
Negatives
- Foreign exchange loss of S$5mn. Under operating expenses, UG was hit by a foreign exchange loss of S$5mn. This is due to weak Brazilian Real faced by its subsidiary. UG production in Malaysia invoices the Brazil subsidiary in US dollar, which in turn sells into the local market in Brazilian Real terms.
Outlook
The outlook for UGHC in FY21e appears stellar. We believe the bulk of 2H20 S$12.5mn PATMI came from just 4Q20, judging by the huge 48% GP profit. We think the incremental appr.30% point uplift gross margins in 4Q20 (vs 3Q20) lead to an additional S$15mn of gross profits*. But the bulk of this gain was offset by the S$5mn foreign exchange loss. PATMI in 4Q20 could be at least S$10mn. If we then annualise the S$10mn, FY21e PATMI would be S$40mn. But this excludes prices that have been rising for the industry every month even in July and August.
Longer-term, the earnings in FY22e will be hazier. But as per our initiation report, we think the demand-supply mismatch can persist into 2022. For UG, we think it can grow faster than the industry because:
*we assume the split in 3Q20/4Q20 revenue was S$40mn/S$91mn, and GP margin split 20%/48%.
Maintain BUY with higher TP of S$4.15 (previously S$2.70)
Our valuation is based on a 15x PE FY21e, a 40% discount to larger peers. We raised our FY21e PATMI by 55%. Our gross margins assumptions have increased modestly by 80 bps to 43%. Revenue estimates increased by 35% on account of the higher than expected increase in capacity and selling prices. Operating expenses were raised a marginal S$2mn. There is an upside to our estimates if margins in 4Q20 can sustain longer than we expected.
Company Background
Established in 1989 and listed on the SGX in 2014, UG is a disposable-glove manufacturer with two factories in Malaysia. It makes and distributes gloves under its proprietary “Unigloves” brand to more than 2,000 customers in 50 countries, including the UK, Germany, US, China, Brazil and Nigeria. Around 55% of its gloves are latex and the balance nitrile. Industries served include healthcare, food and beverage, electronics, beauty, etc. Annual production capacity is 2.9bn gloves, with plans to expand to at least 3.2bn by FY21e.
Investment Merits
We initiate UG Healthcare with a BUY rating. Our target price is S$2.70. This is based on 15x PE FY21e. The average discount to peers for UG since listing has been around 40%.
REVENUE
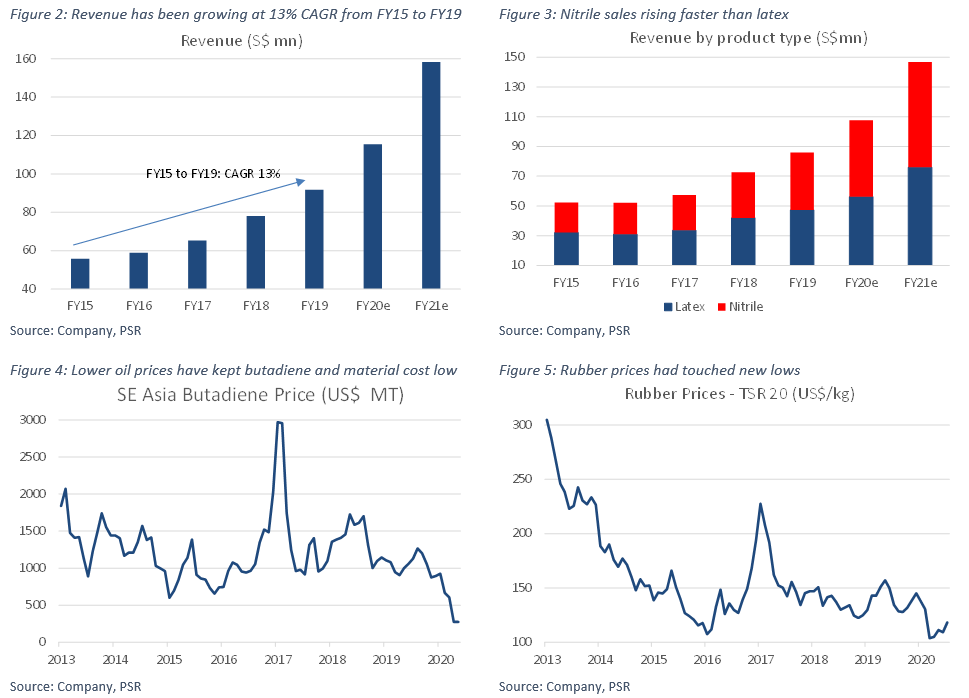
Revenue for UG can be split into two large product types, latex (55% of sales) and nitrile (45%)*. Nitrile gloves are predominantly used in healthcare industries in developed countries due to regulations. Meanwhile, latex is used more in emerging markets due to the lower price, comfort and higher sensitivity of such gloves. UG produces many types of gloves that can be differentiated by their weight, raw material, thickness, colour, scent, barcode, etc. Another source of revenue is the sale of ancillary products such as surgical, vinyl and cleanroom gloves, face masks, and other medical disposables. By geography, the major markets for UG are the UK, Germany, Brazil, China and Nigeria. Revenue for UG has been growing around 13% CAGR from FY15 to FY19 as the company expanded production capacity (Figure 2). In FY20 and 21, we expect revenue to surge due to the spike in selling prices. Nitrile gloves are expected to grow faster than latex (Figure 3).
*Latex gloves are made from natural rubber and can be classified into powdered and powder-free. In the past, latex gloves were powdered with cornstarch for easier donning and to prevent sticking. But this can cause a sensitive or allergic reaction to the skin when worn for long periods. Powder-free gloves undergo chlorination that provides a slippery effect on the glove surface to ease donning and removal of the glove without the need for powder. Nitrile gloves are made from petroleum-based synthetic rubber.
EXPENSES
The breakdown of manufacturing cost are raw materials (55-60%), labour cost (10-11%) and other overheads such as utilizes, depreciation (30-35%). The type of raw material for natural latex gloves is natural rubber latex. Meanwhile, nitrile gloves are made from synthetic rubber (i.e. nitrile latex). The feedstock in the production of nitrile is the petrochemical butadiene. The prices of butadiene have been stable in-line with the weaker crude oil price (Figure 4). Rubber prices similarly are at record lows (Figure 5).
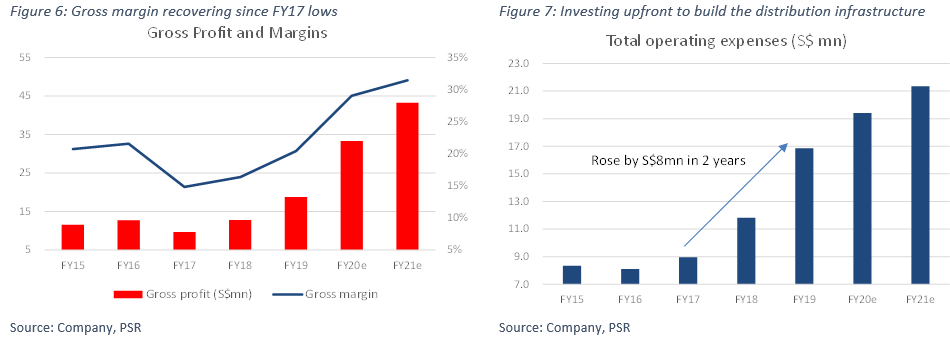
Operating expenses include selling and distribution (3% of sales), administrative expenses (13%) and other operating expenses (2%). The last three years have seen a doubling in operating expense from S$8.1mn in FY16 to 16.8mn in FY19 (Figure 7). Marketing and administrative cost have risen the past two years as the distribution network expanded into new countries such as Brazil. UG had to invest fixed cost such as warehouse and new marketing and sales teams.
MARGINS
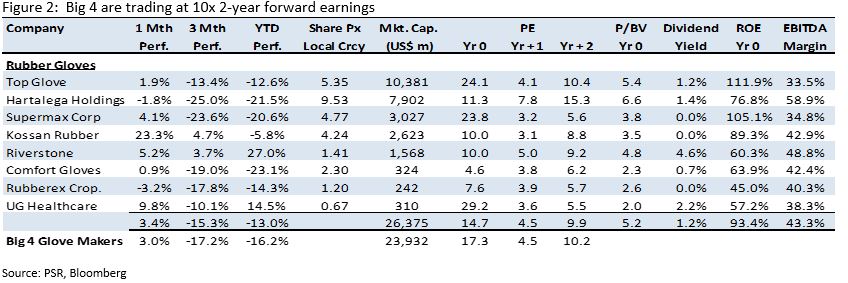
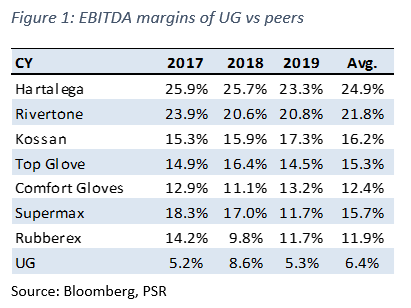
EBITDA margins for UG have 6% for the past three years. This is below larger peers such as Riverstone (22%), Top Glove (15%), Hartalega (25%) and Supermax (16%) – Figure 1 The lower margins is due to UG lower production capacity and economies of scale. Without the higher volume, fixed cost per unit will be higher. Besides, the utilization rate will be lower due to higher downtime and smaller batch production runs. Higher contribution from nitrile sales is another factor to margins. Both Hartalega and Riverstone sell only nitrile gloves.
The two years where margins were weakest was in FY17 and FY18. Margins were negatively impacted by higher material cost, gas tariff hike, foreign worker levy and higher depreciation from new product lines. The supply disruption in global butadiene supply caused nitrile latex prices to spike in early 2017. Whilst, difficult to quantify, the margins are higher than typical OEM manufacturer because of the distribution margins which UG can capture.
OTHER INCOME
There are two categories of other income
BALANCE SHEET
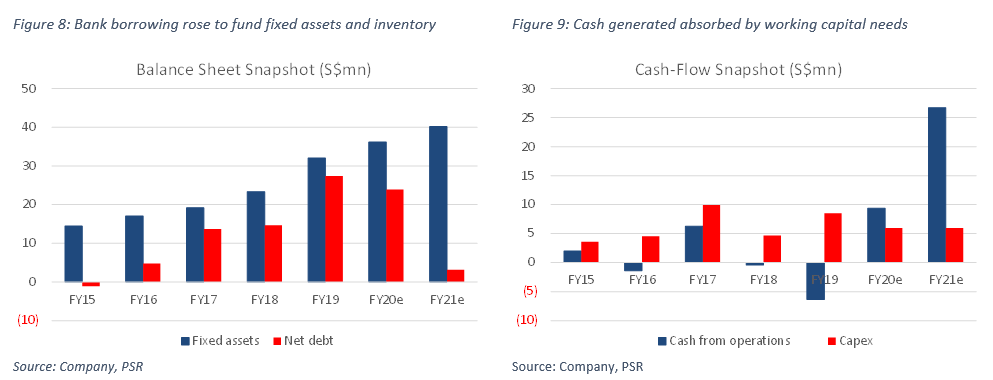
Assets: Fixed assets of the company has doubled over the past four years (FY15-19) to S$32mn (Figure 8). The rise in assets is in tandem with capacity and revenue doubling over a similar period. Conversely, inventory tripled during these four years. Expanding the distribution network into new markets requires warehouse and inventory to become available to customers.
Liabilities: UG swung from net cash of S$1mn to net debt of S$27mn from FY15 to FY19. Debt was required to fund the growth in fixed assets (+S$17mn) and inventory (+$21mn).
CASH-FLOW
Cash-flow from operations has generally been negligible. Any cash generated has been used to fund inventories and receivables. Accumulated operating cash-flow from the past four years has been a negative S$2mn. Meanwhile, capex required was around S$7mn p.a. between FY16 to FY19, as the company doubled its production capacity from 1.4bn to 2.9bn.
INDUSTRY
The global rubber gloves industry is dominated by Malaysia exporters. In 2019, Malaysia accounts for 67% of global production followed by Thailand the 2nd largest at 19%, according to MARGMA*. Over the past three years, global demand for gloves has been rising at a CAGR of 12.5% or 29bn pieces a year (Figure 10). Pre-Covid 19, demand for gloves have been driven by increased spending in healthcare, ageing populations, rise in non-communicable diseases, increased regulation and improvement in hygiene, especially in developing countries.
When the Covid-19 pandemic struck, the first wave of demand came China. As the pandemic spread, demand from the healthcare sector soaked up large amounts of the supply. The second wave of demand will now come from non-traditional or healthcare sectors and resumption of economic activity as lockdown eases.
Our expectations are for glove demand to rise by 20% in 2020, or 60bn pieces, followed by a 33bn increase in 2021. Our assumptions around demand are:
UG BUSINESS MODEL
Large glove manufacturers such as Top Glove and Hartalega are largely OEM manufacturers. OEMs manufacture gloves for under the brand of their customers such as large medical distributors (e.g. Medline, OneMed, Marbena, Cardinal Health, Microflex, Ansell, Kimberly Clark), government agencies (Defence or Health Ministries) and non-profit organizations (e.g. WHO, United Nations).
OEMs are not keen to build their own distribution network. Firstly, this is to avoid any conflict of interest. Secondly, managing warehouses and logistics in the destination markets is not their core expertise especially compared to the scale of their production. Another challenge in distribution is the huge variety of products to be stocked and sold, not just a single product - gloves.
The typical logistics or sales cycle is as follows: UG manufactures the gloves from its factory and ship to its warehouses in the UK, China, Brazil and Germany. UG services many end customers that may just order several cartons every week. UG needs to have sufficient stock to meet such consistent orders for next day delivery. For effective sales, UG needs a local sales team to promote the brand, speak to customers, engage in marketing activities and provide after-sales support.
For more than a decade UG has spent building a distribution network for its own branded gloves. It started with Germany and this has now grown to major emerging countries such as Brazil, Nigeria and China (Figure 14, Figure 17). Brazil is a notable country with high barriers to entry due to the need for every glove to be barcoded.
Investment Merits
1. A surge in demand. Covid-19 has resulted in a sharp spike in demand, precipitating severe industry shortages. Industry order lead times have multiplied from one month before Covid to 12 months. Ex-factory spot prices for nitrile gloves have skyrocketed from US$25 to US$120 per 1,000 pieces. The three levers of demand are: a) quantum jumps in the number of hospital patients, frequency of use and typically low inventories, which have led to a scramble for gloves; b) hospitals, governments and NGOs have started to build buffers or strategic stocks to prepare for future spikes in demand; and c) the new normal of hygiene practices has necessitated the use of gloves by consumers and non-healthcare industries such as airlines, airports and restaurants.
2. Capturing the entire supply chain margins. Since listing, UG has been investing aggressively in its brands, logistics, warehouses and end-customer network. Sales from its Unigloves brand have leapt from around 50% of the total in 2015 to 85%. Own-brand products offer higher customer stickiness and selling prices. UG can also capture distribution margins. With a network that reaches out to end-customers directly, UG can benefit from higher end-selling prices of gloves and enjoy both manufacturing and distribution margins for its premium branded gloves.
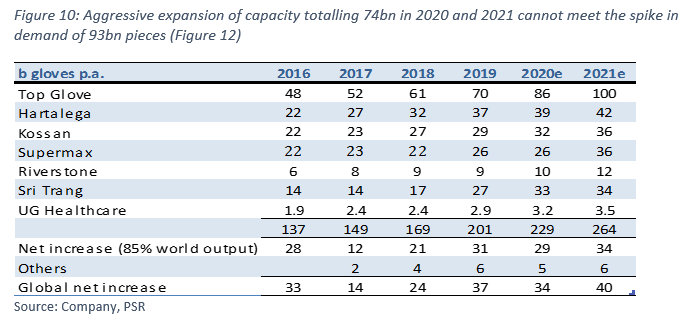
3. Shortage should persist till 2021. Demand for gloves worldwide was already growing at a CAGR of 10.6% before Covid. We believe the current shortage will persist into 2021. Firstly, glove penetration in emerging markets such as China and Brazil is only 10 and 24 pieces per capita respectively. This compares with 100 and 150 for Europe and the US. UG can benefit from growth in both countries, as it has been entrenching its brand and distribution networks in China and Brazil since 2002 and 2014 respectively. Secondly, industry supply is not expected to meet demand growth even in 2021. Demand was growing by around 30bn a year before Covid. This year, it is expected to grow by 60bn and another 33bn in 2021, as the pandemic has created new growth drivers (Figure 12). This surge of almost 93bn in two years is above expected increases in planned glove capacity of around 74bn (Figure 10). If we assume a 90% utilization rate for the industry, actual supply addition will only be around 67bn pieces.
Risks:
1. A decline in selling price. The largest impact to margins and earnings will be a drop in selling prices for gloves. The current shortfall in supply has triggered a spike in prices. We expect the demand-supply imbalance to continue into 2021. Our assumption for prices is still conservative considering the recent spike (Figure 27).
2. Import restrictions from the U.S. On 16 July 2020, Top Glove announced the U.S. Customs and Border Protection has placed a detention order on disposable gloves manufactured by two of the Company’s subsidiaries. The urgent need for gloves plus a shortage of supply, there will be pressure to ensure sufficient supply for hospitals and medical workers.
3. Additional taxes imposed by Malaysian authorities. In the past, notably palm oil, the Malaysia government has imposed windfall taxes on the palm oil industry due to the surge in palm oil prices. An windfall tax will have dire consequences to the equity markets in Malaysia where the combined market capitalization of rubber glove companies total around RM170bn.
Valuation
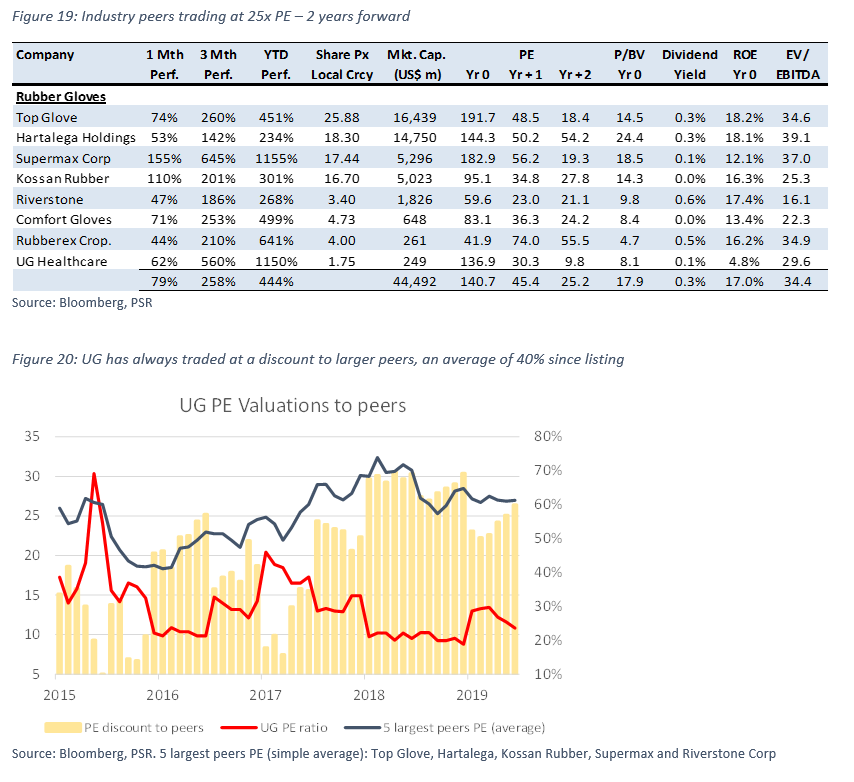
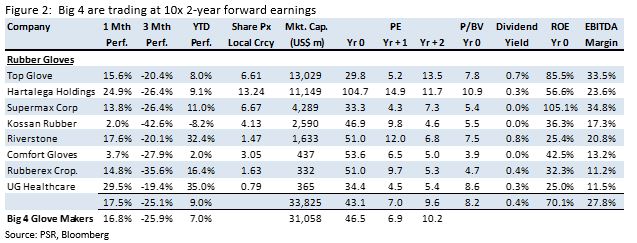
We initiate coverage on UG Healthcare with a BUY recommendation. We peg UG to a PE of 15x FY21e. It is a 40% discount to peer valuations of around 25x PE (Figure 19).
UG has always traded at a discount to its larger peers due to its lower scale, growth and liquidity. The discount has widened recently to 60% due to the weaker financial performance of UG, in our opinion. We believe this discount can shrink to back to at least the historical average since listing of around 40x PE as the financials start to turnaround for UG (Figure 20).