Oversea-Chinese Banking Corp Ltd – Non-II growth drives strong start to FY26
-
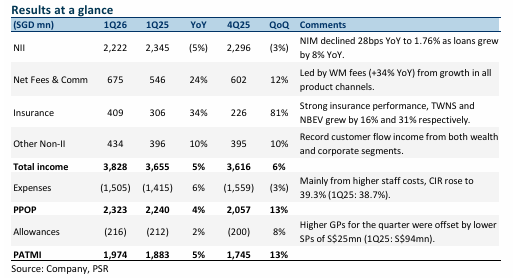
1Q26 earnings of S$1.97bn were in line with our estimates, at 25% of our FY26e forecast, with record total income of S$3.83bn and ROE of 13.0%. The standout was non-II at a record S$1.61bn (+23% YoY), led by WM fees of S$422mn (+34% YoY) and insurance income of S$409mn (+34% YoY).
-
NII fell 5% YoY to S$2,222mn as NIM compressed 28bps YoY (10bps QoQ) to 1.76%, the steepest QoQ compression among peers (DBS -4bps, UOB -2bps QoQ). Trading income grew 10% YoY on record customer flow. CIR improved to 39.3%; NPL stable at 0.9% for the 8th consecutive quarter; NPA coverage rose to 163%. Management maintained FY26 guidance and reaffirmed completion of the S$2.5bn capital return plan by FY26e (S$1bn buyback remaining). The pending HSBC Indonesia wealth acquisition (~S$6.6bn AUM) reinforces OCBC’s Next Frontier strategy.
-
Maintain NEUTRAL with a higher target price of S$22.00 (prev. S$21.50) as we nudge up FY26e earnings by 2% due to higher non-interest income. We assume a 1.60x FY26e P/BV and a 12.8% ROE estimate in our GGM valuation. WM fee growth is driven by structural activity rather than market beta (banking AUM flat QoQ on market valuations, but fees +12% QoQ on activity), giving us confidence in sustainability. Hong Kong booking centre is scaling rapidly (~70% growth across categories) on Greater Bay Area affluence, while the HSBC Indonesia deal taps onshore wealth in a market where ASEAN money typically stays domestic. NIM compression of 10bps QoQ is a relatively weak spot vs peers, partly self-inflicted by a deliberate redeployment into lower-margin, high-quality assets (avg +S$12bn IEA).
The Positives
+ Wealth management drives record non-II. Group wealth management income rose 11%
YoY to S$1.48bn (39% of total income, 1Q25: 37%), with WM fees +34% YoY and insurance
income +34% YoY. We believe this is sustainable as: (a) the “whole wealth” cross-sell engine
is delivering: BOS product capabilities pushed down into Premier tiers drives higher
revenue per RM with no incremental product cost, (b) growth is activity-driven not market
driven, banking AUM was flat QoQ at S$342bn on softer valuations, but wealth customer
flow income grew ~50% YoY on transaction volume and hedging demand, and (c) insurance
NBEV margin expansion to 48.6% (1Q25: 43.1%) reflects a deliberate product mix shift,
structural rather than transitional. OCBC noted that April momentum has carried over, with
the IUL pivot and HSBC Indonesia providing structural support against market volatility risk.
+ Asset quality stable; conservative GP build for macro risks. NPL ratio held at 0.9% for the
8th consecutive quarter; NPA coverage rose to 163% (1Q25: 162%). New NPA formation
eased sharply to S$123mn (1Q25: S$236mn). Allowances of S$216mn comprised only
S$25mn for impaired assets; the S$191mn for non-impaired assets is a deliberate macro
overlay for the Middle East and tariff third-order effects (direct exposure limited).
Cumulative non-impaired allowances now S$3.08bn, providing writeback optionality if
macro stabilises. HK real estate stress has plateaued, and OCBC has actively managed down
its mid-cap CRE book.
+ HSBC Indonesia acquisition strengthens regional wealth franchise. The S$480mn
premium for HSBC’s ~S$6.6bn AUM Indonesia portfolio (336K customers, completion
2Q27) is high-value because OCBC inherits only direct/variable costs while leveraging its
existing Indonesia fixed cost base, a competitive advantage not available to subscale peers.
Lifts OCBC Indonesia AUM by ~25%. We believe the strategic rationale is sound, given that
ASEAN wealth stays onshore and Indonesia is underpenetrated. Management indicated
synergies will exceed initial estimates, with one-time integration cost of ~2% of FY27e
PATMI and the deal taking only ~0.2pp off CET1 (or ~S$570mn). Management is open to
further bolt-on wealth acquisitions, and we believe it will be multi-year franchise build-out.
Oversea-Chinese Banking Corp Ltd – Wealth momentum anchors earnings resilience
-
4Q25 earnings of S$1.75bn were slightly below our estimates, with FY25 earnings at 98% of our FY25e forecast. Final dividend up by 2% YoY to 42 cents, with FY25 total dividends at S$0.99 (FY24: S$1.01), inclusive of a special dividend of 16 cents.
-
NII dipped 6% YoY as loan growth of 7% was offset by NIM declining 29bps YoY to 1.86%. Total non-interest income surged 37% YoY from a 16% rise in fee income and a recovery in trading and insurance income. Allowances dipped and expenses were stable. OCBC has provided FY26e guidance for a slight to moderate decline in NII, mid-single-digit loan growth, CIR in the low to mid 40s, and credit costs of 20-25bps. OCBC has also committed to completing the S$2.5bn capital return plan by FY26e of which S$780mn of share buyback is outstanding.
-
Maintain ACCUMULATE with a higher target price of S$21.50 (prev. S$20.00) as we roll over our valuations to FY26e. We lower our FY26e earnings estimate by ~4% due to lower NII. We assume a 1.56x FY26e P/BV and a 12.6% ROE estimate in our GGM valuation. We expect FY26e earnings to increase by 4% YoY, supported by loan growth and fee income. OCBC did not provide any guidance on the continuation of its capital return plan, but did mention the possibility of a special dividend if the S$780mn of share buyback is not completed. We believe OCBC can exceed the 50% dividend payout ratio and continue the special dividend (an additional 10% dividend payout ratio) for at least 2 more years (until FY28), in order to reach its target CET1 of 14% (4Q25 fully phased-in CET1: 15.1%). We like OCBC for its robust wealth management execution and healthy asset quality which mitigate margin pressures, securing both resilient earnings growth and highly visible capital returns.


Oversea-Chinese Banking Corp Ltd – Earnings steady, future capital return unclear
-
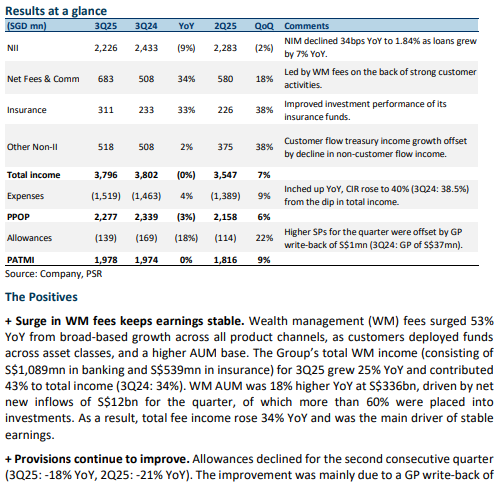
3Q25 earnings of S$1.98bn were slightly above our estimates as a surge in WM fees provided a boost to fee income. 9M25 PATMI was 77% of our FY25e forecast. OCBC has reiterated its S$2.5bn capital return which will end in FY25 (special dividend equivalent to 10% dividend payout ratio and ~S$1bn share buyback). It did not provide guidance if it will continue in FY26 and beyond.
-
NII dipped 9% YoY as loan growth of 7% was offset by NIM declining 34bps YoY to 1.84%. Total non-interest income rose 15% YoY from a 53% surge in WM fees and a recovery in insurance income, while allowances declined and expenses inched up. OCBC has lowered its FY25e guidance for NIM to around 1.90% (prev. 1.90-1.95%) and for NII to decline by mid to high single digits, offset by lower credit costs of around 20bps (prev. 20 to 25bps), while maintaining guidance of mid-single digit loan growth.
-
Maintain NEUTRAL with a higher target price of S$17.00 (prev. S$16.50) as we raise our FY25e earnings estimate by ~3% from higher fee income estimates. We assume a 1.29x FY25e P/BV and a 12.8% ROE estimate in our GGM valuation. We expect FY25e earnings to be flat YoY, as higher fee income will be offset by continued compression in NIM and a decline in NII. OCBC did not provide any guidance on the continuation of its capital return plan and is the only local bank with a capital return policy set to end in FY25. However, we believe OCBC can exceed the minimum dividend payout ratio and continue the special dividend (an additional 10% dividend payout ratio) for at least 2 more years (until FY27), as it still has the highest CET1 ratio among local banks (3Q25 fully phased-in CET1: 15%).
Oversea-Chinese Banking Corp Ltd – NII guidance lowered
-
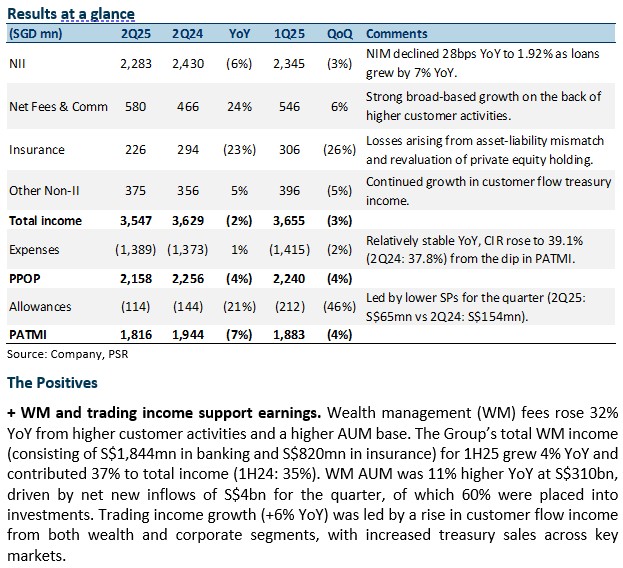
2Q25 earnings of S$1.82bn were below our estimates as continued NIM compression led to lower NII. 1H25 PATMI was 47% of our FY25e forecast. Interim dividend fell 7% YoY to 41 cents, with dividend payout ratio stable at 50%. OCBC has reiterated its S$2.5bn capital return (special dividend equivalent to 10% dividend payout ratio and ~S$1bn share buyback) previously announced.
-
NII dipped 6% YoY as loan growth of 7% was offset by NIM declining 28bps YoY to 1.92%. Total non-interest income rose 5% YoY from fee and trading income, while allowances declined and expenses were stable. OCBC has lowered its FY25e guidance for NIM of 1.90-1.95% (prev. around 2%) with NII to decline by mid-single digit but maintained guidance of mid-single digit loan growth and credit costs of around 20 to 25bps.
-
Downgrade to NEUTRAL from Accumulate with a lower target price of S$16.50 (prev. S$17.60). We lower our FY25e earnings estimate by ~6% from lower NII estimates. We assume a 1.25x FY25e P/BV and a 12.5% ROE estimate in our GGM valuation. We expect FY25e earnings to decline by ~2% from the continued compression in NIM and decline in NII, which higher fees and trading income would partially offset. OCBC’s dividend yield is the least predictable amongst the 3 local banks as the dividend policy is fully floating (dividend payout ratio of 50% base and 10% special) and is entirely dependent on the direction of earnings. However, we believe OCBC can go above the minimum dividend payout ratio and to continue the special dividend (an additional 10% dividend payout ratio) for at least two more years (until FY27) as they still have the highest CET1 ratio among the local banks (2Q25 fully phased-in CET1: 15.3%).
Oversea-Chinese Banking Corp Ltd – Earnings dip from higher provisions
-
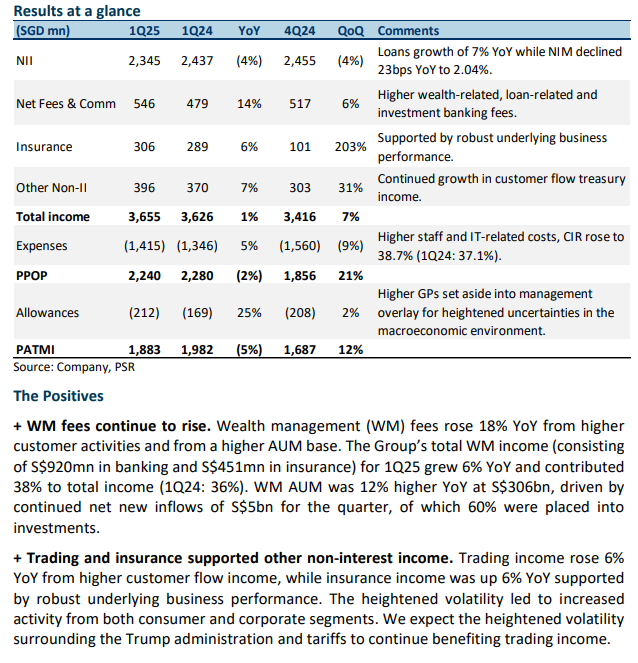
1Q25 earnings of S$1.88bn were within our estimates, as higher non-interest income offset lower NII and higher expenses and allowances. 1Q25 PATMI was 24% of our FY25e forecast. OCBC has reiterated its commitment to the two-year S$2.5bn capital return (special dividend equivalent to 10% dividend payout ratio and ~S$1bn share buyback) previously announced.
-
NII dipped 4% YoY as loan growth of 7% was offset by NIM declining 23bps YoY to 2.04%. Total non-interest income rose 10% YoY from fee, trading, and insurance income, while higher allowances and expenses hurt earnings. OCBC has maintained their FY25e guidance for NIM of around 2%, mid-single digit loan growth, and credit costs of around 20 to 25bps.
-
Maintain ACCUMULATE with an unchanged target price of S$17.10. Our FY25e estimates remain unchanged. We assume 1.30x FY25e P/BV and ROE estimate of 13.2% in our GGM valuation. We expect a more subdued FY25e earnings growth of ~3% as higher fees and trading income, lower NIMs, and higher expenses and allowances will offset loan growth recovery. Our estimated 6.5% dividend yield (including the special dividend) remains attractive, and we believe OCBC will be able to continue the special dividend (an additional 10% dividend payout ratio) for at least two more years (until FY27) to reach its target of 14%.
Oversea-Chinese Banking Corp Ltd – Earnings miss from higher allowances and expenses
- 4Q24 earnings of S$1.69bn were below our estimates owing to higher expenses and allowances. FY24 PATMI was 96% of our FY24e forecast. Final dividend dipped 2% YoY to 41 cents with FY24 total dividends at S$1.01 (FY23: S$0.82) inclusive of a special dividend of 16 cents. A two-year S$2.5bn capital return (special dividend equivalent to 10% dividend payout ratio and ~S$1bn share buyback) was announced.
- NII was flat YoY as loan growth of 8% was offset by NIM declining 14bps YoY to 2.15%. Total non-interest income rose 18% YoY from fee, trading, and insurance income, while higher allowances and expenses hurt earnings. OCBC has guided for FY25e NIM of around 2%, mid-single digit loan growth, and credit costs of around 20 to 25bps.
- Maintain Accumulate with a lower target price of S$17.90 (prev. S$18.80) as we roll over our valuations. We raise FY25e earnings by ~1% from higher NII and non-interest income offset by higher expense estimates. We assume 1.36x FY25e P/BV and ROE estimate of 13.2% in our GGM valuation. We expect a more subdued FY25e earnings growth of ~3% as higher fee and trading income, and loan growth recovery will be offset by lower NIMs, and higher expenses and allowances. Our estimated 6.1% dividend yield (including special dividend) remains attractive, and we believe OCBC will be able to continue with the special dividend (additional 10% dividend payout ratio) for at least two more years (till FY27) to reach their target of 14%.


Oversea-Chinese Banking Corp Ltd – Trading income hits new high
-
3Q24 earnings of S$1.97bn were above our estimates owing to a surge in trading income and higher fees and commission income. 9M24 PATMI was 81% of our FY24e forecast.
-
NII grew 2% YoY from loan growth of 2% YoY offset by NIM dipping 6bps YoY to 2.20%. Total non-interest income rose 13% YoY, led by broad-based growth from fee, trading, and insurance income. Allowances dipped 43% due to lower GPs as credit costs improved to 15bps.
-
Maintain Accumulate with a higher target price of S$17.00 (prev. S$15.40) as we raise our FY24e estimates. We increased FY24e earnings by ~8% from higher trading income and lower provision estimates. We assume 1.45x FY24e P/BV from a higher ROE estimate of 14.0% (prev. 13%) in our GGM valuation. We expect 4Q24 earnings to grow by ~21% YoY from double-digit fee and trading income recovery with provisions stable. NII will remain flattish as stable loan growth from rate cuts will be offset by moderating NIMs. We like OCBC due to attractive valuations and a dividend yield of 5.4%, buffered by a well-capitalised 15.6% CET 1, and non-interest income growth from recent acquisitions. OCBC mentioned returning excess capital (160bps or ~S$4bn of CET1) to shareholders, but will only do so in the medium term (~3 years) and will provide more details soon.


Oversea-Chinese Banking Corp Ltd – Non-interest income continues to support earnings
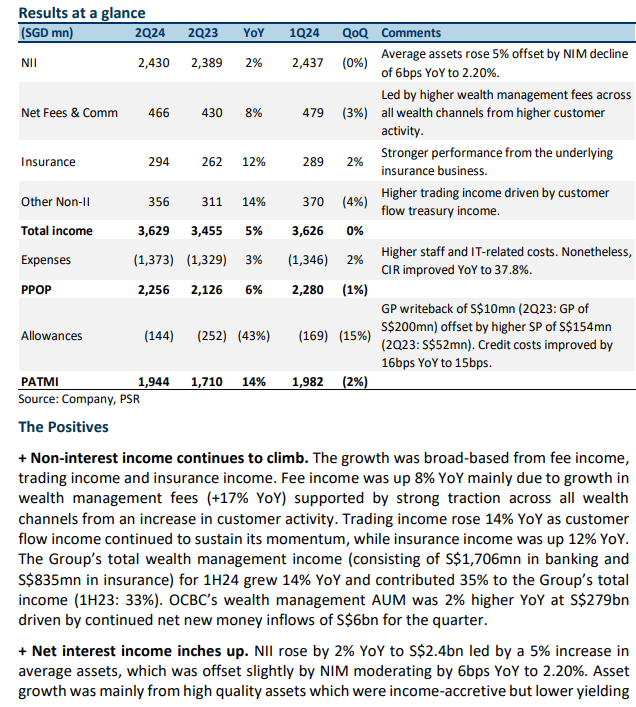
- 2Q24 earnings of S$1.94bn were slightly above our estimates. This was due to higher non-interest income from fees, insurance, and trading income and moderate growth in NII offset by higher expenses. 1H24 PATMI was 54% of our FY24e forecast. 1H24 interim dividend up 10% YoY to 44 cents.
- NII grew 2% YoY from loan growth of 2% YoY offset by NIM dipping 6bps YoY to 2.20%. Total non-interest income rose 13% YoY, led by broad-based growth from fee, trading, and insurance income. Allowances dipped 43% due to lower GPs as credit costs improved to 15bps.
- Maintain Accumulate with an unchanged target price of S$15.40. Our FY24e estimates remain unchanged. We assume 1.33x FY24e P/BV from a higher ROE estimate of 13.0% (prev. 12.8%) in our GGM valuation. We expect FY24e earnings to grow from double-digit fee income recovery and stable provisions. NII will remain flattish with modest loan growth from rate cuts expected in 2H24, offset by moderating NIMs. We like OCBC due to attractive valuations and a dividend yield of 6.2%, buffered by a well-capitalised 15.5% CET 1, and non-interest income growth from recent acquisitions.
Oversea-Chinese Banking Corp Ltd – Non-interest income the growth driver
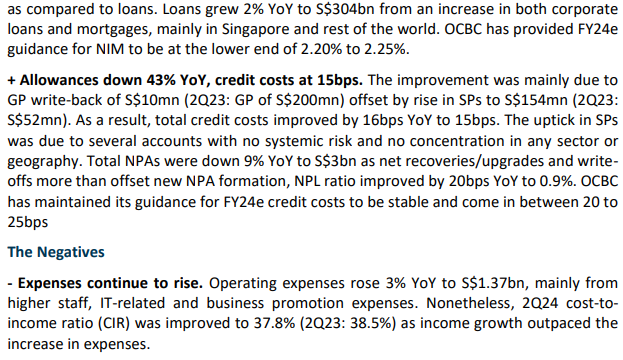
- 1Q24 earnings of S$1.98bn were slightly above our estimates. This was due to higher non-interest income from growth in fee, insurance, and trading income and moderate growth in NII offset by higher allowances and expenses. 1Q24 PATMI was 28% of our FY24e forecast.
- NII grew 4% YoY from loan growth of 2% YoY offset by NIM dipping 3bps YoY to 2.29%. Total non-interest income rose 17% YoY, led by broad-based growth from fee, trading, and insurance income. Allowances rose 54% due to higher SPs offset by lower GPs as credit costs rose 4bps YoY to 16bps.
- OCBC also announced a S$1.4bn voluntary unconditional general offer for the remaining 11.56% stake in Great Eastern Holdings Limited (GEH) that it does not own. The offer price was S$25.60 per share.
- Downgrade to Accumulate with a higher target price of S$15.40 (prev. S$14.96) as we account for recent share price performance and increase FY24e earnings by 2%. We raise our NII estimates from higher NIMs. We assume 1.33x FY24e P/BV from a higher ROE estimate of 13.0% (prev. 12.8%) in our GGM valuation. We expect FY24e earnings to grow from double-digit fee income recovery and stabilised provisions. NII will remain flattish as stable loan growth from rate cuts expected in 2H24 will be offset by moderating NIMs. We like OCBC due to attractive valuations and a dividend yield of 6.2%, buffered by a well-capitalised 16.2% CET 1, and non-interest income growth from recent acquisitions.
The Positives
+ Non-interest income rises 17% YoY. The growth was broad-based from fee income, trading income and insurance income. Fee income was up 6% YoY mainly due to growth in wealth management fees (+20% YoY) offset slightly by lower loan and trade-related fees (-6% YoY), lower brokerage and fund management fees (-5% YoY) and stable investment banking fees. Trading income rose 45% YoY to a quarterly high of S$370mn from record customer flow income and improved non-customer flow income, while insurance income was up 13% YoY. The Group’s total wealth management income (consisting of S$873mn in banking and S$416mn in insurance) for 1Q24 grew 19% YoY and contributed 36% to the Group’s total 1Q24 income (1Q23: 32%). OCBC’s wealth management AUM was 1% higher YoY at S$273bn driven by continued net new money inflows of S$6bn for the quarter.
+ Net interest income up slightly. NII rose by 4% YoY to S$2,437mn; the growth was led by a 5% increase in average assets, which was offset slightly by NIM moderating by 3bps YoY to 2.27%. NIM moderation was mainly from higher funding costs, which offset the increase in asset yields. Loans grew 2% YoY to S$297bn from an increase in both corporate and consumer loans, mainly in Singapore. OCBC has provided FY24e guidance for NIM to be at the higher end of 2.20% to 2.25%, with 1Q24 exit NIM currently at 2.27%.
The Negatives
- Allowances up 54% YoY, credit costs at 16bps. Total allowances rose 54% YoY to S$169mn mainly due to a rise in SPs to S$180mn (1Q23: S$56mn) offset slightly by GP write-back of S$11mn (1Q23: GP of S$54mn). As a result, total credit costs rose from 4bps YoY to 16bps. The uptick in SPs was due to several accounts in ASEAN with no systemic risk and no concentration in any particular sector or geography. Total NPAs were down 9% YoY to S$3bn as net recoveries/upgrades and write-offs more than offset new NPA formation, NPL ratio improved by 10bps YoY to 1.0%. OCBC has maintained their guidance for FY24e credit costs to be stable and come in between 20 to 25bps.
- Expenses continue to rise. Operating expenses rose 8% YoY to S$1.35bn, mainly from higher staff costs due to higher variable compensation associated with income growth. Nonetheless, 1Q24 cost-to-income ratio (CIR) was stable YoY at 37.1% as income growth outpaced the increase in expenses. OCBC is guiding for CIR of around 40 to 45% for FY24e as costs are expected to grow while income moderates, resulting in higher CIR.
Oversea-Chinese Banking Corp Ltd – Non-interest income driving growth
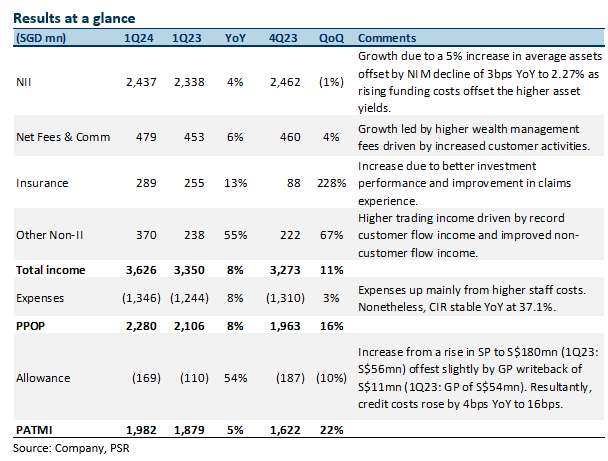
- 4Q23 earnings of S$1.62bn met our estimates. It came from higher fee income and stable NII. FY23 PATMI was 100% of our FY23e forecast. 4Q23 DPS was up 5% YoY to 42 cents. FY23 dividend rose 21% YoY to 82 cents, with the dividend payout ratio stable at 53%. It was below our expectations.
- NII grew 3% YoY despite NIM dipping 2bps YoY to 2.29% and flat loan growth. Total non-interest income rose 25% YoY as higher fee income and trading were offset by lower insurance income. Allowances fell 40% due to lower GPs and SPs as credit costs improved 14bps YoY to 21bps.
- Maintain BUY with an unchanged target price of S$14.96. We lower FY24e earnings by 6%. We lower our NII estimates from softer NIMs and increase allowance estimates, offset by higher fees and other non-interest income. We assume 1.29x FY22e P/BV and ROE estimate of 12.8% in our GGM valuation. We expect FY24e earnings to grow from single-digit fee income recovery and stabilised provisions. NII will remain flattish as stable loan growth from rate cuts expected in 2H24 will be offset by moderating We like OCBC due to attractive valuations and a dividend yield of 6.7%, buffered by a well-capitalised 15.9% CET 1, and non-interest income growth from recent acquisitions.
The Positives
+ Net interest income grew 3% YoY. NII growth was led by a 4% increase in average assets, which was offset by NIM moderating by 2bps YoY to 2.29% and stable loan growth. NIM moderation was mainly from higher funding costs, which offset the increase in asset yields. OCBC has provided FY24e guidance for NIM to be in the range of 2.20% to 2.25%, with FY23 exit NIM currently at 2.26%.
+ Fee income continues to grow. Fee income rose 15% YoY to S$460mn. This was due to the broad-based growth in wealth management fees from increased customer activities, higher credit card fees, and loan and trade-related fees. Furthermore, the Group’s FY23 wealth management income grew 26% YoY to S$4.3bn and contributed 32% to the Group’s total income FY23 (FY22: 30%). OCBC’s wealth management AUM was 2% higher YoY at S$263bn driven by continued net new money inflows.
+ Allowances are down 40% YoY, and credit costs are at 21bps. Total allowances fell 40% YoY to S$187mn as SPs fell to S$5mn (4Q22: S$101mn) and GPs dipped to S$182mn (4Q22: S$213mn). Resultantly, total credit costs improved by 14bps YoY to 21bps. Total NPAs were down 16% YoY to S$2.9bn as new NPA formation fell 78% YoY to S$54mn, and the NPL ratio improved by 20bps YoY to 1.0%. Full-year FY23 credit costs were higher at 20bps (FY22: 16bps) from both impaired and non-impaired assets. OCBC has guided for FY24e credit costs to be stable and come in between 20 to 25bps.
The Negatives
- Insurance income down 12% YoY. Insurance income fell 12% YoY to S$88mn, driven by higher claims in Singapore and Malaysia, partially offset by higher contributions from the Singapore life business arising from better investment performance. FY23 total weighted new sales fell 12% YoY to S$1.66bn, as sales in Singapore declined, while new business embedded value (NBEV) declined 11% YoY to S$762mn. Margins saw a slight increase due to a more favorable product mix. Nonetheless, FY23 profit contribution from insurance rose 30% YoY to S$636mn, led by improved investment income.
- Expenses creep up. Operating expenses rose 19% YoY to S$1.31bn, mainly from higher staff costs and other operating expenses. The rise in staff costs was led by annual salary adjustments, headcount growth, and one-off support to help junior employees cope with rising cost-of-living concerns. Resultantly, the 4Q23 cost-to-income ratio (CIR) rose 3.7% points YoY to 40%. Nonetheless, full-year FY23 CIR improved by 4.2% points YoY to 38.7% as the rise in income outpaced the rise in expenses.
- CASA ratio continues to dip. The Current Account Savings Accounts (CASA) ratio fell 3.1% points YoY to 48.7% due to the high-interest rate environment and a continued move towards fixed deposits (FD). Nonetheless, total customer deposits grew 4% YoY to S$364bn, underpinned by strong growth in FDs. The Group’s funding composition remained stable with customer deposits comprising 81% of total funding.
Get access to all the latest market news, reports, technical analysis
by signing up for a free account today!
Login
The full article is only available for premium content subscribers. To continue reading this article, please log in:
Not a Premium Content Subscriber yet? Sign up here!
- Home >
- Phillip Research Report
