The Positive
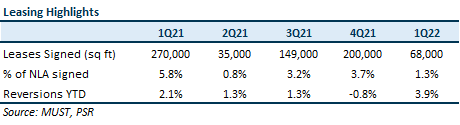
+ 68k sq ft signed with 3.9% reversions (FY21: -0.8%). Leases signed accounted for 1.3% of portfolio NLA, 54% of which were new leases. Demand came from accounting, and finance & insurance tenants. MUST signed a couple of large 20k sq ft leases, as well as a seven-year lease with a real estate real estate company, which took 11k sq ft of space at Michelson, lifting Michelson’s occupancy from 97.2% to 89.2%. 1Q22 was a softer leasing quarter due to Omicron wave in end-2021, which only receded in mid-1Q22. However, we understand that physical tours picked up towards the end of 1Q22, ending the quarter 13% higher QoQ.
The Negative
- Occupancy hurt by non-renewals and downsizing. Portfolio occupancy slid 0.6ppt from 92.3% to 91.7%, due to lower occupancy at Exchange (-2.1ppts), Peachtree (-1.7ppts), Figueroa (1.2ppts), Centerspointe (-1.0ppts) and Capitol (-0.9ppts). Notable occupancy losses were the result of a non-renewal and downsizing by a legal tenant at Peachtree and a tenant in the information sector at Exchange, both occupying 20k sq ft of space. Passing rents on both leases are below market and present positive reversionary potential. We understand from the management that over the last 12 months, out of 371 sq ft of leases expiring, 272k sq ft of space was renewed and 99k sq ft of space was returned due to downsizing, implying a c.27% reduction in space requirement.
Outlook
The US office market continues to improve - projected 12-month rent growth in MUST’s markets has improved to +3.8% as of Apr22 compared with +2.3% as of Jan22. Increasing occupancy remains a key focus for MUST. The management is evaluating several strategies including building spec suites, leasing to co-working operators, offering more flexible/shorter leases, increasing touring and offering higher commissions to leasing agents.
Two of MUST’s top 10 tenants, TCW Group and Quinn Emanuel Trial, have lease expires in Dec23 and Aug23 respectively. These two tenants are located in Michelson and occupy 26.1% and 19.3% of NLA in the building. TCW group has decided to reduce its space requirements and indicated that it will be relocating instead of undertaking renovations to accommodate a smaller footprint. Passing rents for TCW Group’s lease are c.9% below market, providing positive reversionary potential. MUST has started marketing the space and is considering building some pre-fitted office space, also known as spec suites, to enable tenants to move in more quickly and reduce vacancy period. We may see gearing creep up as MUST funds tenant incentives and spec suites. MUST’s gearing as at end-1Q stands at 42.8%, implying a US$89mn headroom to its internal gearing limit of 45%.
Future acquisition is still focused on markets with high representation of tech, healthcare and life science tenants. MUST is eyeing assets with cap rates ranging between 6.5% and 7.5% in sunbelt and magnet cities -- Seattle, Portland, Austin, Nashville and Raleigh. Due to the volatility in the capital markets, MUST is reassessing its portfolio for divestment candidates as a possible alternative to fund acquisitions.
Maintain BUY and DDM TP of US$0.86
No change in our estimates. Catalysts include stronger-than-expected leasing and portfolio reconstitution. Current share price implies FY22e/FY23e DPU yield of 9.4%/9.8%.
The Positive
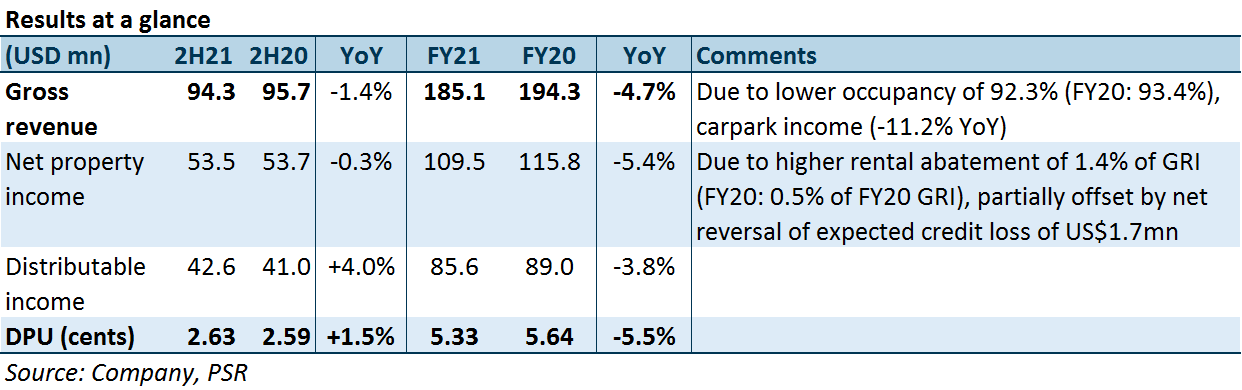
+ Leasing momentum doubled YoY with net effective rents improving 3.4%. MUST signed 654k sq ft, or 12% of NLA, in FY21, 2.3x the NLA executed in FY20. Traditional office tenants such as finance and insurance and government agencies accounted for 47% and 20% of leases signed. Reversions came in at -0.8% (FY20: +0.1%), weighed down by leases signed at Michelson. Michelson’s expiring rents were above market rents due to the 2-3% annual escalation on long leases, leading to negative reversions when the leases were renewed at market rates. Excluding leases signed at Michelson, reversions would have been +3.3% (FY20: +4.7%). More importantly, net effective rents grew 3.4% YoY, as the rent-free period and tenant incentives eased. While improving, net effective rents are still 10-15% below pre-pandemic levels. Leases signed in FY21 were for an average term of 4.0 years, slightly shorter than the 6.4 years for leases signed in FY20.
The Negative
- Occupancy hurt by non-renewals and downsizing. Portfolio occupancy slid 1.1ppts YoY to 92.3%, 3.5ppts below FY19 levels. This compares with the average occupancy of 88.2% for Class A offices. Lower occupancy was due to non-renewals and downsizing with notable occupancy losses at Figueroa (-4.4 ppts), Penn (-5.4 ppts), Phipps (-5.5 ppts) and Capitol (-5.0 ppts).
Outlook
FY21 physical occupancy at MUST’s properties ranged from 25-30%. MUST provided rental abatement of US$2.4mn, or 1.4% of GRI, for F&B and retail tenants in FY21 (FY20: 0.5% of GRI). More pronounced return-to-office is expected to lift carpark income and lower rental abatement burden.
The US office market continues to show signs of recovery. This can be seen from (1) improving net effective rents; (2) lower TIs; (3) longer lease tenures signed; (4) decline in subleasing; and (5) improving rental growth outlook for MUST’s cities. About 8.1% of GRI is up for renewal. FY22 renewals could yield positive reversions, given that passing rents are 2.1% below market rents.
Future acquisition is still focused on markets with high representation of tech, healthcare and life science tenants. MUST is eyeing assets with cap rates ranging 6.5% to 7.5% in sunbelt and magnet cities -- Seattle, Salt Lake City, Austin, Boston, and Raleigh. Following the acquisition of three properties in Phoenix and Portland in Dec21, MUST’s exposure to tech and healthcare tenants increased from 9.5% to 12.8% of GRI. It hopes to increase its exposure to new economy tenants to 20% of GRI.
Upgrade from Accumulate to BUY, DDM TP raised from US$0.84 to US$0.86
FY21 occupancy came in lower than we anticipated. As such, we lower FY22e-24e DPUs by 2.1-6.3% to factor in the gradual recovery in occupancy from the current, lower-than-forecasted portfolio occupancy. DDM-TP rises due to higher later-period DPU forecasts. The US office market appears to be at an inflection point, showing recovery in leasing momentum. Catalysts include stronger-than-expected leasing and portfolio reconstitution. Current share price implies FY22e/FY23e DPU yield of 8.6%/8.9%.
What’s new?
Acquisition of three office assets – two in Phoenix, Arizona, one in Portland, Oregon. The total consideration of US$201.6mn represents a 2.3% discount to valuation and will increase AUM by 10.5% to US$2.18bn. Cap rates range between 5.8-7.0%. The management intends to finance the acquisition through a combination of debt and equity. Assuming an LTV of 59%, the acquisitions will increase DPU by 4.4%, nudging gearing up from 42.1% to 43.9%. Completion is expected in Dec 21.
What do we think?
Increasing exposure to tech and healthcare tenants. Highly anticipated entry into high-growth Sun Belt and magnet cities of Phoenix and Portland. These two markets have experienced population growth of +15.6% and +12.9% over the past decade due to in-migration, supported by lower business costs for tech companies (Phoenix) and high proportion of skilled talent in STEM/TAMI sectors. The acquisition will increase MUST’s exposure to tech and healthcare tenants from 9.5% to 12.8%. These are New Economy sectors which are enjoying secular growth. However, MUST is still playing catch up to its peers, Prime US REIT (PRIME SP, Accumulate, US$0.94) and Keppel Pacific Oak (KORE SP, not rated), which have c.32% and c.38% exposure to STEM/TAMI sectors.
Improving portfolio metrics and providing potential upside. The acquisition portfolio carries an average occupancy of 93.4% and WALE of 5.9 years, which will lift portfolio occupancy from 90.9% to 91.3% and WALE from 5.1 to 5.2 years. Occupancy at Diablo stands at 85.7% and is the only asset which is not fully leased. However, this will provide rental upside should MUST successfully lease out the vacant space. In-place rents are 9.0%-14.7% below market rents, representing a potential reversionary upside for MUST during the next major renewal period in 2024.
Outlook
Post-acquisition gearing of c.43% is on the high side for SREITs. Further acquisitions will have to be supported by equity fund raising or divestments. New mutations and waves of the COVID-19 virus may push back return-to-office, setting back recovery in carpark income. The US office market is seeing some green shoots, and subleasing, tenant incentives and free rent are starting to pull back.
Maintain ACCUMULATE and DDM TP of US$0.84
No change in estimates pending the completion of the EFR and acquisition. Catalysts include stronger-than-expected leasing and portfolio reconstitution. The current share price implies FY21e/FY22e DPU yield of 8.2%/8.7%. Prefer Prime US REIT (PRIME SP, Accumulate, TP US$0.94) in the sector for greater tenant exposure to STEM/TAMI sectors.
The Positives
+ Improving tenant sentiment. New leases formed 32.3% of leases signed in 3Q21, up from 3.3% for leases signed in 1H21. As of 9M21, 453,000 sq ft or 9.7% of NLA has been signed with positive reversions of 1.3%. Leasing sentiment has improved, evident by the 76% jump in leases signed year-to-October versus FY20 leasing.
+ Higher physical occupancy should lift carpark income. 3Q21 physical occupancy improved to c.30% (1Q21: 11%; 2Q21: 15%). physical occupancy varied across MUST’s assets. Government agencies has later return-to-office timelines, resulting in lower physical occupancy for the buildings they occupied. The absence of movement restrictions also benefitted entertainment and fitness venues opposite two of MUST’s assets, whose patrons utilise the carparks located in MUST’s buildings. Together with the higher physically occupancy at MUST’s offices, this points to recovery in carpark income, which contributed c.7% of FY19 revenue.
The Negatives
- 3Q21 occupancy slid 0.8ppts QoQ from 91.7% to 90.9%, still above market occupancy of 83.8%. Significant backfilling at Michelson brought occupancy to 87.2%, up from 80.4% in 2Q21. This was offset by a tenant exercising its lease break, returning one floor of space in MUST’s Atlanta asset as it adopted a remote work model for its IT department. That said, leases signed post quarter improved occupancy to 91.6%. Leasing remains an immediate priority for MUST. There is still some way to go to bring occupancy back to historical levels of c.95%, but the US office sector is showing signs of recovery.
- Gearing elevated at 42%, above MUST’s targeted gearing of 40%. Gearing crept up largely due to valuation declines since the pandemic. Tenant incentives (TI) offered on new and renewed leases will be financed by debt, which may push gearing higher. However, the management believes that the TI requirements are still manageable but hopes to bring gearing down eventually, doing so in conjunction with portfolio reconstitution.
Outlook
Green shoots for US office market.
This can be seen from (1) improving net effective rents; (2) lower TIs; (3) longer lease tenures signed; (4) decline in subleasing; (5) 46.4% QoQ improvement in transactional volume and (6) improving rental growth outlook for MUST’s cities. Net effective rents improved 4.4% and 2.5% since 1Q21 and 2Q21 on the back of declining TIs. TIs declined 5.5% since 1Q21, although free rent period unchanged QoQ at 8.9 months. Tenants are signing leases for longer tenures, lengthening from 7.1 years as at 1Q21 to 7.7 years as at 3Q21. Subleasing has also declined for the first time since the start of the pandemic. Twelve-month rental forecasts by CoStar Group were less negative for MUST’s submarkets, ranging from 0% to +1.1%. This compares to Jul21’s outlook of -2.4% to 0%.
Shifting focus to New Economy sectors and secondary markets
According to CBRE, tenants in the tech, healthcare and life science sectors accounted for 31% of leasing demand in 2020. Research by JLL in April 2021 confirmed these sectors are among the top-paying tenant industries. However, these New Economy industries only account for 10% of MUST’s tenants, which limits its ability to increase rents. MUST’s future acquisitions are likely to focus on secondary markets where these industries are frequently located. MUST is eyeing assets with cap rates ranging 6.5% to 7.5% in sunbelt and magnet cities, which includes Seattle, Salt Lake City, Austin, Boston, and Raleigh. MUST aims to increase its exposure to New Economy tenants to 20%. It is open to divesting, M&As and JVs to reposition its portfolio. The manager has been actively evaluating deals and has assessed 47 deals YTD.
Maintain ACCUMULATE and DDM TP of US$0.84
No change to our estimates. US office market showing green shoots. Catalyst include stronger than expected leasing and portfolio reconstitution. Current share price implies FY21e/FY22e DPU yield of 8.2%/8.7%. Prefer Prime US REIT (PRIME SP, Accumulate, TP US$0.94) in the sector for greater tenant exposure to STEM/TAMI sectors.
The Positives
+ Pick-up in leasing. During the quarter, MUST signed 5.8% of NLA at +2.1% reversions. This compares with the 5.9% signed in FY20 at +0.1% reversions. The stronger leasing in 1Q21 further de-risked expiries in FY21 and FY22. FY21 lease expiries declined from 5.7% to 4.3% and for FY22, from 18.1% to 13.0%. Renewals formed 93.6% of the leases signed, with the remaining 5.3% and 1.1% coming from expansion and new leases. Leases signed were with traditional office-using sectors such as finance and insurance, administrative, advertising and legal. While rental reversions were positive with no downsizing, rent-free periods and tenant incentives increased by 20-30% for renewals and doubled for the new leases signed. WALE for new leases was also much lower at 2.7 years vs 6.4 years for those signed in FY20. Portfolio WALE was unchanged QoQ at 5.3 years. Fortunately, leases signed in 1Q21 still incorporated periodic rental escalations.
+ Rental collections remained high at 98.0%. About 2-3 out of the 16 F&B tenants in MUST’s portfolio are not fully open. Rent abatement was given to them to help them tide over reduced foot traffic.
The Negatives
- Portfolio occupancy dipped from 93.4% to 92.0% QoQ (1Q20: 96.5%). This was caused by downsizing by a tenant in the lifestyle sector which retuned one floor of space and non-renewal by a tenant who relocated to a suburban office. Still, MUST’s occupancy outperformed the Grade A market’s 82% (1Q20: 90.1%). Subleasing in its buildings remained low, inching down from 3.3% to 3.2%.
- Low physical occupancy of 5-25% to weigh on carpark income. No improvement in physical occupancy despite a 45.5% vaccination rate in the US. Carpark income contributed 7% to FY19 revenue. In FY20, carpark income took a 25% hit from remote working, which reduced physical occupancy in offices to about 15%. Remote working also lowered parking usage by the patrons of surrounding entertainment venues. Depressed physical occupancy is expected to keep FY21e carpark income in line with FY20 figures.
Outlook
Softer leasing expected, near term
Despite 1Q21’s stronger leasing, tenants are taking a longer time to make leasing decisions. Filling vacancies remains challenging. Higher market vacancy rates have resulted in a tenants’ market. Rent-free periods and tenant incentives have increased by 20-30% for renewals and doubled for the new leases signed. Lease terms have also shortened. According to rental forecasts by the CoStar Group, market rents could fall by up to 6% over the next 12 months. Minimal supply and lower subleasing in cities where MUST has assets should provide some leasing support.
Shifting focus to New Economy sectors and secondary markets
According to CBRE, tenants in the tech, healthcare and life science sectors accounted for 31% of the leasing demand in 2020. Research by JLL in April 2021 confirmed these sectors are among the top-paying tenant industries. However, these New Economy industries only account for 10% of MUST’s tenants, which has limited MUST’s ability to increase rents. Going forward, MUST’s acquisitions are expected to focus on secondary markets where these industries are frequently located. These include Seattle, Salt Lake City, Austin, Boston and Raleigh where cap rates range from 6.5% to 7.5%. MUST aims to increase its exposure to New Economy tenants to 20%. It is open to divesting, M&As and JVs to reposition its portfolio.
Maintain BUY, unchanged DDM TP of US$0.84
No change in estimates. We are forecasting a FY21e DPU yield of 8.1%. Catalysts are expected from higher take-up in leasing and asset acquisitions.
The Positives
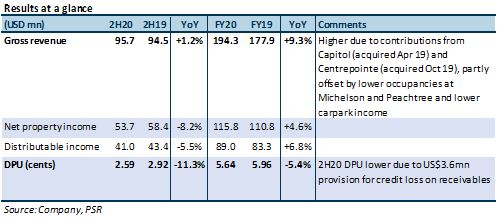
+ Rental collections improved from 94% to 97% in 4Q20. MUST booked a US$3.6mn impairment for receivables in 4Q20, mainly from one retail and several F&B leases. Half of its credit provision was attributed to this retail tenant. In February 2021, MUST managed to get the tenant to agree to repay the arrears in full. Writing back the arrears, collection rate would have been 99%.
+ Executed 279k sq ft of leases in FY20, accounting for 5.9% of NLA. Leases signed were mainly from traditional office-using sectors such as legal, real estate, information, finance and insurance. New leases, renewals and expansion accounted for 35.6%, 58.7% and 5.7% of the leases signed. One legal company at Figueroa increased space by 25.5% with positive reversions. Legal (21%), finance and insurance (18%), retail trade (14%), real estate (7%) and information (7%) contributed the most to MUST’s GRI. Unemployment rates in these sectors ranged from 2.8% to 5.9%, below the national average of 6.7%.
The Negatives
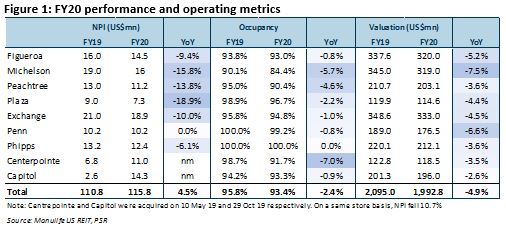
- NPI fell due to lower occupancy and carpark income. Portfolio occupancy declined YoY from 95.8 to 93.4% due to a handful of non-renewals. Occupancy at Michelson, Peachtree and Centrepointe was the most affected (Figure 1). Carpark income contributed 7% to FY19 revenue. This income took a 25% hit from remote working which reduced physical occupancy in offices to about 15% during the year. Remote working also lowered parking usage by the patrons of surrounding entertainment venues.
- Portfolio reversions flat at 0.1%, (1H20: +7.9%). The figure was dragged down by a double-digit negative reversion at Centrepointe where the lease was marked-to-market upon renewal. The tenant has been in the building for years on a lease with 2% annual rental escalations. As such, passing rents have overrun market rents, resulting in a negative marked-to-market reversion. Stripping out this lease, FY20 reversions would have been +4.7%.
Outlook
Eyeing tenants in New Economy sectors and business parks. After enlarging its AUM from US$834mn during IPO to US$1.99bn, MUST is ready for its next phase of growth. Its next acquisition will likely be a sizeable one of above US$100mn. Management wants to increase exposure to tenants in future-centric sectors by 20%. Such sectors include healthcare, life sciences, technology and new/knowledge industries. As tenants from these industries lean towards high-quality business parks, and the management is open to adding low-lying business parks of 2-3 storeys in suburban areas to the MUST portfolio.
Softer leasing expected, near term. According to JLL, subletting in the cities that MUST operates in is significantly lower, at 6.4-21.2%, versus gateway cities of San Francisco, Seattle and New York where subletting ranges 28-32%. Subleasing within MUST’s portfolio is below average level in the cities they are in. MUST’s tenants are seeking to sublease 4.8% of NLA, with 3.3% already on the sublease market. Gateway cities are experiencing higher subletting as they have larger exposure to remote-work-friendly industries. In recent years, there has also been a marked demographic shift in the US towards more affordable cities. In 4Q20, an additional 18.4mn sq ft of sublease space hit the US market, lifting total space to more than 141.5mn sq ft. This surpassed dot.com levels. Over the course of the pandemic, the sublease market has expanded by another 47.65mn sq ft or 50.7% YoY. While average vacancy rate was 17.1% at year-end, MUST’s portfolio vacancy was 6.6%. Its trophy and Class-A assets continue to attract flight-to-quality tenants taking advantage of lower rents and more generous incentives to relocate to best-in-class buildings.
Tenants also continue to opt for or renew on shorter leases. Incentive and free-rent expectations have similarly increased. Nonetheless, lease expiries in FY21 are low at 5.8% of GRI. Limited new supply, positive rental-growth forecasts averaging 1.2% in MUST’s cities and mostly below-market or at-market in-place rents in its portfolio should allow for flat to mildly positive reversions.
US$3mn interest savings expected from refinancing. About US$223.7mn or 26% of borrowings at a 3.2% interest will be up for renewal in FY21. Refinancing earlier in the year was done at 1.85%. We are expecting US$3mn p.a. in interest savings upon refinancing in FY21, and weighted average interest rate to decline to c.2.9%.
The Positives
+ Rental collections high at 94%, YTD 98%. Rent deferments and abatements were minimal at 0.3% and 0.2% YTD. Slow collections were mainly from F&B, lifestyle and retail tenants.
+ US$3mn interest savings expected from refinancing. About US$223.7mn or 26% in borrowings, at a 3.2% interest, will be up for renewal in FY21. Refinancing earlier in the year was done at 1.85%. We are expecting US$3mn p.a. in interest savings upon refinancing in FY21.
The Negative
- Decline in portfolio occupancy from 96.2% to 94.3%. This was largely due to known expiries unrelated to COVID-19, at Peachtree and Centrepointe. The tenant at Peachtree was a real-estate firm bought out by another real-estate firm. That at Centrepointe was a healthcare firm that changed its business model.
Outlook
Softer leasing expected, near term. According to JLL, the U.S. market lost 28.9mn sqft in occupancy in 3Q20, although rentals grew 0.4%. While MUST did not sign any leases in 3Q20, portfolio subletting was unchanged at 3.3%. Most leases have provisions that allow tenants to sublease, with MUST having the final approval on the type and quality of sublease tenants. Its original tenants will still be liable for the initial stipulated rents but will share upside should the sublease rents exceed the initial contracted rents.
Tenant incentives and free-rent expectations have increased. Tenants have also been renewing on shorter leases of 5-7 years instead of 10. Nonetheless, lease expiries in FY20/21 are low at 1.9% and 6.7% of GRI respectively, owing to MUST’s long WALE of 5.5 years. Below-market in-place rents at Capitol and Figueroa, in addition to an absence of new supply in these markets, should help support rents when leases expire.
Tenants exhibiting growing desire to return to office. This was seen in an uptick in physical occupancy, which increased to 13.5% in October 2020, up from 5% in March and 12% in June.
Maintain BUY with higher TP of US$0.92, up from US$0.90
Our DDM TP rises to US$0.92 from US$0.90 after incorporating lower cost of debt.
The Positives
+ Positive rental reversions of +7.9% on 217,300 sqft (4.6% of NLA) for 1H20. Of the c.217,300 sqft of leases signed, 50% were renewals, 42% were new leases and 8% were expansions. Leases signed were from the financial, legal, real estate and tech sectors. MUST’s portfolio remained resilient – no increase in subletting within their assets, and no request from tenants to right-size/downsize or relocate thus far. MUST’s long WALE of 5.7 years translates to low lease expiries of 3.5%/6.1% by GRI for FY20/21. Modest, single-digit rental reversions are still attainable as rents expiring in FY20/21 are 2% to 19% under comparable market rents. Tenants are locked in by leases, which do not have break clauses written in. While asking rates have remained stable, softer leasing activity is expected in this weaker economic environment, which may lead to more tenant incentives being offered to retain/attract tenants.
+ Only 0.3% of rental waivers and 0.3% of deferment provided, based on 1H20’s GRI. Little rental support was required due to the quality/resilience of tenants – waivers and deferments were offered mainly to the F&B tenants. MUST’s portfolio is anchored by the Legal (22.0%) and Finance and Insurance (19.9%) sectors which have been one of the more resilient sectors throughout the COVID-19 pandemic. MUST’s Top 10 tenants (excluding Finance and Legal), account for 24.2% of GRI and are mostly listed companies, government entities and/or use the premise as headquarters.
The Negatives
- Deterioration of rent collection. We note that rent collection has been on the downtrend, deteriorating from 99% in April and 97% in May, to 93% in June. Management commented that rents are still being collected, although tenants are taking a longer time to make payment.
- Portfolio valuations fell 2.9%, pushing gearing up from 37.7% to 39.1%. Asset valuations deteriorated by -1.9 to -4.7%, averaging -2.9% on a portfolio level, largely due to lower rental growth assumptions used by valuers. As a mathematical consequence, gearing edged up to 39.1%.
Outlook
While leasing activity remains weak, we remain optimistic on MUST’s resilience due to its long WALE, low expiries in FY20/21, tenant quality and tight comparable supply in the markets that MUST has a presence in. Cautious business sentiment has led to the deferment of major leasing decisions (relocations) resulting in more renewals. We also expect the densification trend to pause due to social distancing measures, hence providing support for leasing demand. Additionally, statistics for office-using sectors show that these sectors (Finance and Insurance, Legal, Professional Services and Tech) remains the most resilient amongst the sectors.
Maintain BUY with a higher TP of US$0.90 (prev. US$0.80).
We lower our beta to reflect the relative resilience of US office asset class, owing to the resilience of office-using tenants and long WALEs. Our higher TP is mainly due a lower cost of equity assumption of 9.1% (prev. 10.0%).
