The Positives
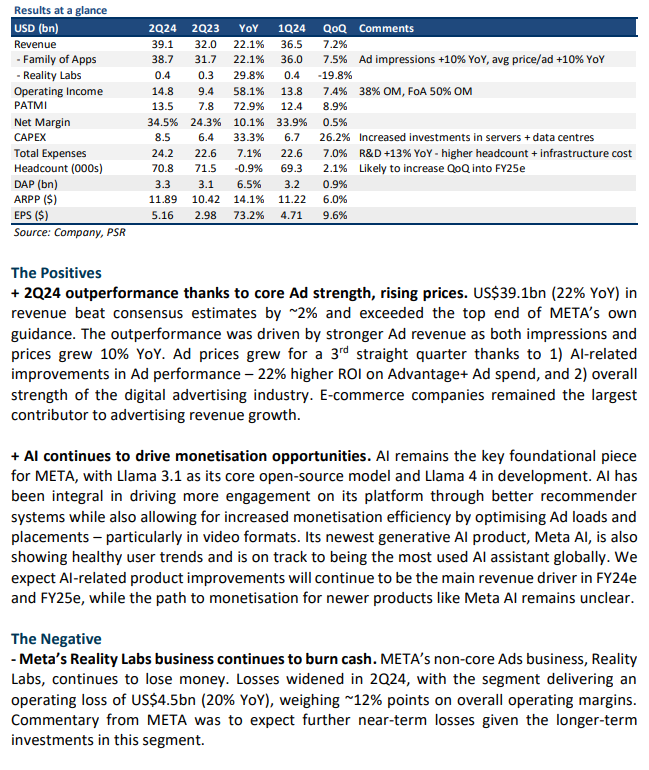
+ AI content driving greater engagement, leading to higher ad revenue. META continues to leverage its AI capabilities to improve engagement on its apps, indirectly leading to higher ad revenue (+27% YoY). META’s AI recommendation system now contributes roughly half of all content users see on Instagram, driving more value for advertisers. The demand-supply dynamics of digital ads are also improving, with META seeing healthy 20+% YoY growth in impressions and a 2nd consecutive quarter of YoY advertising price increases. E-commerce companies remained the largest contributor to advertising revenue growth.
+ Positive momentum for Video/Reels. Video engagement continues to be a bright spot for META, contributing to >60% of viewing time on both FB and IG. Reels remain the key driver for this growth, with its strong ramp throughout FY23. Reels monetisation is also improving with META leveraging AI for more optimised ad loads and placements.
The Negatives
- Higher CAPEX spending moving forward. META is doubling down on scaling its AI capabilities to develop more advanced and compute-intensive models while also scaling its training and inferencing needs (custom silicon). As a result, FY24e CAPEX guidance was raised by ~US$4bn to a range of US$35bn-US$40bn. It expects this investment cycle to take at least 2 years to complete.
- Decelerating revenue growth for 2Q24e. META guided to 2Q24e revenue growth of ~18% YoY, implying a deceleration in growth as it: 1) laps a period of tougher comparisons due to China recovery from early-FY23, 2) slower increase in Reels’ advertising load after an initial aggressive ramp, 3) ~1% YoY impact from a strengthening USD.
The Positives
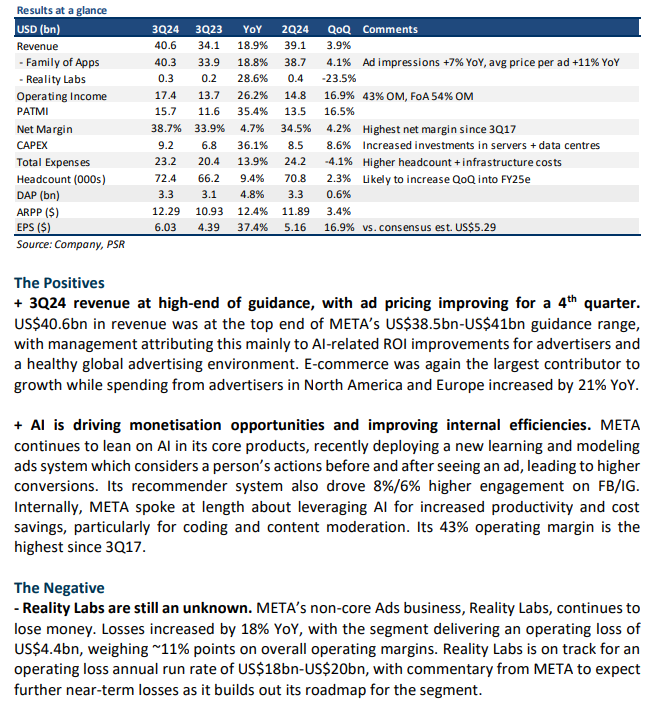
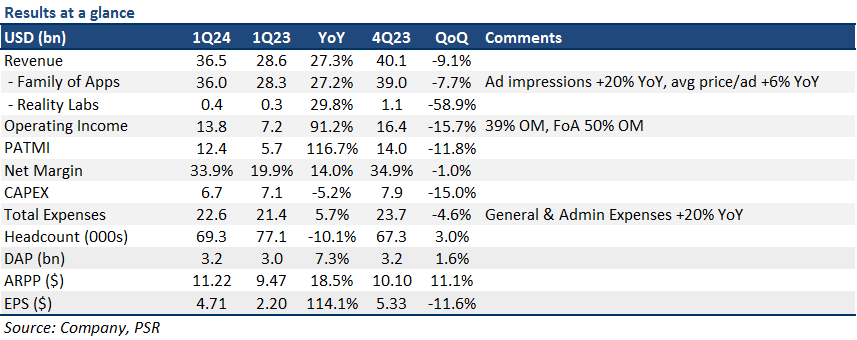
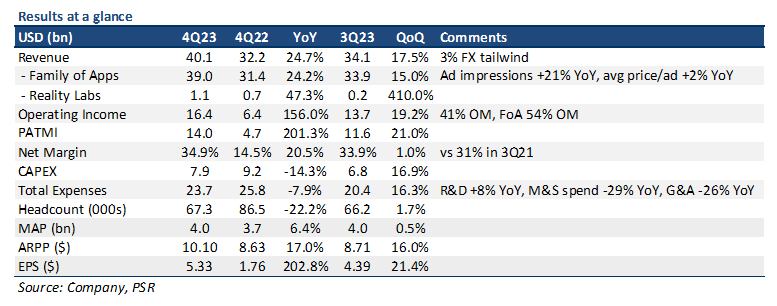
+ Beat on both top and bottom line showing year of efficiency has played out well. Revenue of US$40.1bn beat our estimates by 7%, driven by a 3% FX tailwind, a 21% YoY growth in ad impressions, and a 2% YoY increase in average price per ad (CPM). CPMs grew for the first time in 2 years, driven largely by APAC+China demand. 4Q24 PATMI increased 3x YoY to US$14.0bn, as META benefitted from strong revenue growth and a much leaner workforce – headcount/total expenses were both down 22%/8% YoY, respectively.
+ Well-positioned to build the most advanced AI products with a stockpile of GPUs. META remains focused on building out its tech infrastructure, stating that it intends to have the equivalent of ~600K H100 GPUs (350K H100s + remaining 250K of other GPUs) worth of computing power by the end of FY24e. This is enough compute to support Reels, and another Reels-sized AI service. In addition, its open-source software infrastructure should help attract top AI talent to develop Llama models and other AI products.
+ Reels commentary positive, contributing net revenue to META. In 4Q23, Reels drove >25% YoY growth in daily watch time across all video types, with Reels re-shared 3.5bn times a day. Historically, Reels growth has been a headwind to overall revenue growth due to its lower monetisation levels. However, it is starting to contribute net revenue to META, with the company further expecting Reels to leverage a unified recommendation system across all META patforms to drive further views and engagement.
The Negative
- Raised top end of FY24e CAPEX guidance. META raised the top end of its CAPEX guidance for FY24e by US$2bn, to US$30bn-US$37bn, indicating it expects the need for higher levels of server capacity to support more intense AI product development. We raise our FY24e CAPEX by 3% as a result.
The Positives
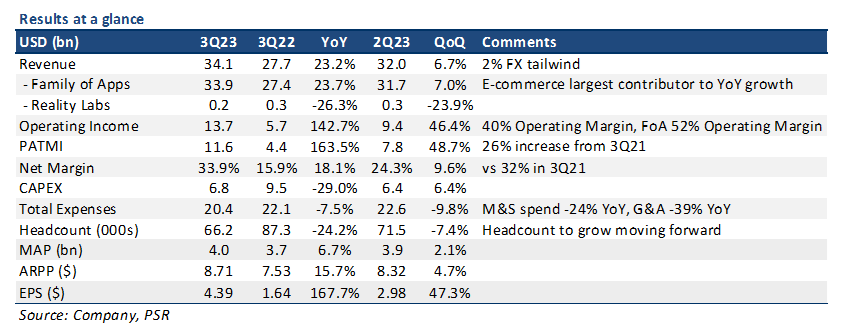
+ Advertising trends continued to accelerate. META saw a huge acceleration in digital advertising revenue (3Q23: 24% YoY vs 2Q23: 12% YoY). Much of this acceleration was contributed by e-commerce companies, particularly from outbound Chinese advertisers trying to reach other markets like the US and Brazil. We expect these trends to continue improving given a typically strong 4Q holiday season, and a general recovery in the digital advertising industry.
+ Reels monetisation no longer a headwind. Reels – which has been a near-term headwind given its lower levels of monetisation, reached an inflection point. Monetisation levels for Reels finally reached net neutral to overall revenue as a result of ranking improvements and increasing ad supply. We think that this is significant given the incremental time spent on short-form video formats like Reels vs Feed/Stories. Moving forward, we expect Reels to be a modest tailwind to revenue growth as it continues to improve its monetisation levels.
+ Earnings grew ~2.5x YoY; highest margins in >2 years. PATMI increased 164% YoY, with net margins of 34%, its highest since 2Q21. Earnings also beat consensus estimates by 21% on higher revenue growth, and a leaner cost structure after significant cost-cutting measures over the last 12 months. Headcount was down -24% YoY.
The Negative
- Uncertain growth outlook for 4Q23e, increasing expenses into FY24e. META issued a fairly wide revenue guidance for 4Q23e, with a range of US$36.5bn-40bn (implying a 13%-24% YoY growth) due to concerns over increasing volatility led by geopolitical events in the middle east. It also guided to a reacceleration in total expenses growth for FY24e (10% YoY), citing increasing AI-related investments and payroll expenses.
ddle
The Positives
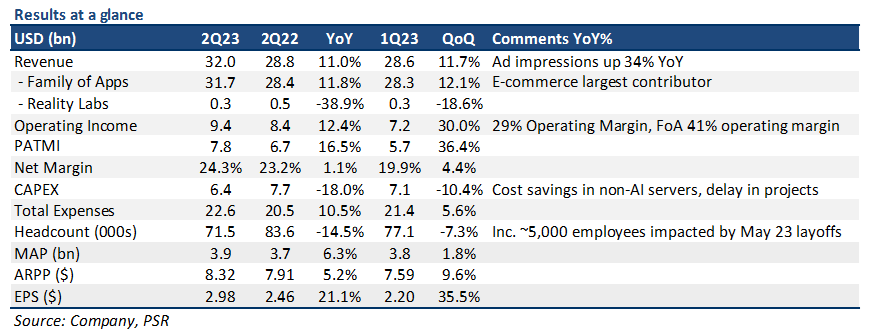
+ Double-digit ad growth for first time in 5 quarters. Advertising revenue grew 12% YoY in 2Q23, led predominantly by growth in outbound e-commerce spending from Chinese advertisers. Engagement on META’s family of platforms also saw healthy trends as ad impressions grew 34% YoY, with AI-recommendations also increasing user time spent on its platforms by 7%. On the products side, Reels monetisation saw improvements, with an annual revenue run-rate of US$10bn vs US$3bn a year ago. Reels saw >200bn daily plays, with >75% of advertisers using Reels Ads.
+ Positive forward guidance, continuation of advertising trends. 3Q23e revenue guidance implies a 20% YoY growth at the midpoint, a significant expected acceleration in revenue due to several factors: 1) improving advertiser demand; 2) Reels continuing to increase monetisation due to higher ad load and incremental time spent; 3) 3% FX tailwinds vs 1% headwind in 3Q22; and 4) weaker 3Q22 comps (-5% YoY). 4Q23e is expected to be similar to 3Q23e with advertising demand recovering, albeit with a larger FX tailwind.
The Negative
- Committed to metaverse vision, no timeline for Reality Labs profitability. Losses continue to mount for Reality Labs segment, with expenses related to the launching Quest 3 next year a big drag. Operating loss for 2Q23 stood at -US$3.7bn, with accumulated losses of around -US$40bn so far. Reality Labs is currently a 12% drag on operating margins, and we think it will continue to be a drag for the foreseeable future.
The Positives
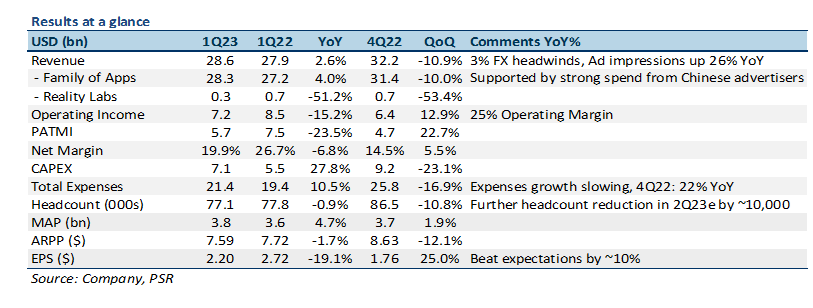
+ 1Q23 results beat on both top and bottom line. META issued 1Q23 revenue of US$28.6bn, 3% YoY (6% YoY in constant currency), beating estimates by about 3%, and the top end of its own 1Q23e revenue guidance (US$28.5bn). This outperformance was led by a 26% YoY increase in ad impressions, and strong spend from Chinese advertisers’ outbound spending. E-commerce and Healthcare were the 2 leading contributors to YoY ad revenue growth. 1Q23 EPS of US$2.20 also beat estimates by ~10% as the company continued to show improvements in cost efficiencies as expense growth slowed to 11% YoY (4Q22: 22% YoY) – Sales & Marketing expenses were down 8% YoY.
+ AI continues to drive improvement in ad tech. Investments in AI capabilities continue to be the backbone driving product improvements. AI recommendations drove >24% increase in user time spent on IG, with Reels monetisation efficiency up >30% on IG, and >40% on FB. With the help of AI, we do expect the gap between Reels monetization vs Feed/Stories to continue narrowing, with META mentioning that this could reach neutrality by early 2024.
+ 2Q23e guidance of 7% YoY revenue growth showing potential pickup in growth trends. META issued optimistic revenue guidance for 2Q23e, with a range of US$29.5bn-32bn indicating a 7% YoY growth taking the midpoint, and a 11% YoY growth taking the high end of the range – implying some acceleration in revenue trends, with FX expected to also be less of a headwind moving forward.
The Negative
- Profit declined YoY, though less than prior quarters. META announced 1Q23 PATMI of US$5.7bn, -24% YoY, as expenses continued to grow faster than revenue (10% YoY vs 3% YoY), and a slightly higher tax rate of 22% vs 16% in 1Q22. However, YoY decline in PATMI was significantly better than prior quarters (3Q22: -52% YoY, 4Q22: -55% YoY), with a resumption in earnings growth on the horizon due to significant cost efficiencies and FX headwinds neutralising.
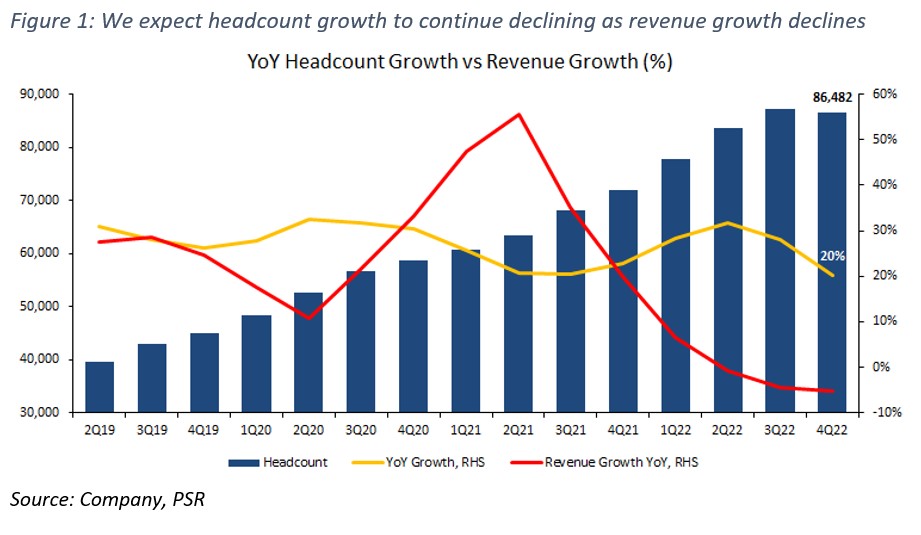
Update
Job cuts should help to further contain expenses growth. META announced that it would be laying off ~10,000 people (~12% of current workforce), and will also be eliminating another ~5,000 vacant job positions as it continues to streamline its workforce and contain its expenses. YoY headcount growth has been declining over the last 3 quarters – as YoY revenue has begun to contract, and we do expect this to drop drastically for 1Q23e as the job cuts take into effect, especially compared with 1Q22 when hiring was still rampant with headcount growth around 27%. OPEX growth is expected to drop as well, although not as significant given the anticipation of sizeable severance-related charges. META incurred restructuring charges of US$4.2bn in 4Q22 after it performed similar cost-cutting initiatives – US$3.2bn from the consolidation of facilities and restructuring of data centre assets, and US$1bn in severance-related charges.
Maintain NEUTRAL with a raised target price of US$200.00.
As a result of the planned job cuts, we reduce FY23e OPEX by ~3% to be roughly in line with FY22 levels. FY23e EBITDA margins are increased by 120bps to 37.0% due to the reduction in OPEX, offset slightly by expected severance-related charges, with net margin also increased by 100bps to 22.8%. We maintain NEUTRAL with a raised DCF target price of US$200.00 (prev. US$182.00), a WACC of 7.1%, and a terminal growth rate of 3.5%.
The Positives
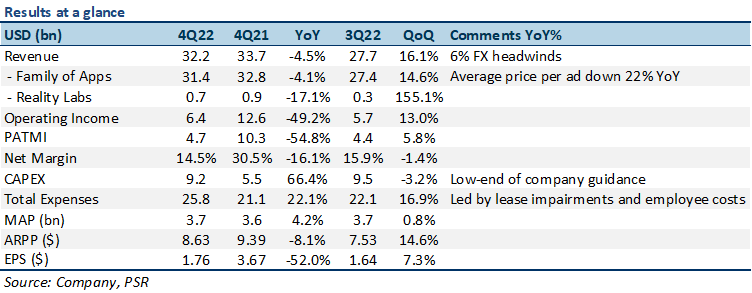
+ Revenue beat expectations on higher holiday ad sales, continued user growth. 4Q22 revenue came in at US$32.2bn, 3% above our forecasts, but still representing a decline of 4% YoY. Revenue was driven by a 23% increase in ad impressions, and strong YoY growth in the travel and healthcare verticals. Active users on Meta’s family of apps continued to grow steadily, increasing 4% YoY to 3.74bn.
+ Laser focused on controlling expenses moving forward. As mentioned during its previous 3Q22 earnings call, Meta remains fully committed to streamlining costs moving forward as it transitions from a phase of hyper growth into a phase of maturation and efficiency. The company plans on: 1) reducing CAPEX by improving its data centre architecture to be more flexible and cost effective; 2) slowing headcount growth as it looks to lean out its management layers; and 3) leveraging AI to increase efficiency and monetization of its products. The expected reduction in expenses should provide an immediate respite to the company’s shrinking margins. 4Q22 total expenses was US$26bn, a 22% YoY increase. Guidance for FY23e total expenses was reduced by 5% to a range of US$89bn-95bn, with FY23e CAPEX reduced by 12% to US$30bn-33bn.
The Negative
- Near-term digital advertising demand expected to remain weak. Meta guided 1Q23e revenue to be in the range of US$26bn-28.5bn – approx. -2% YoY contraction, indicating continued expected weakness in digital advertising demand. FX is also expected to be about a 2% YoY headwind. However, we do expect growth to expand throughout the year as Reels monetization and advertising performance continues to improve.
