DBS Group Holdings Ltd – Dividends maintained despite earnings decline
-
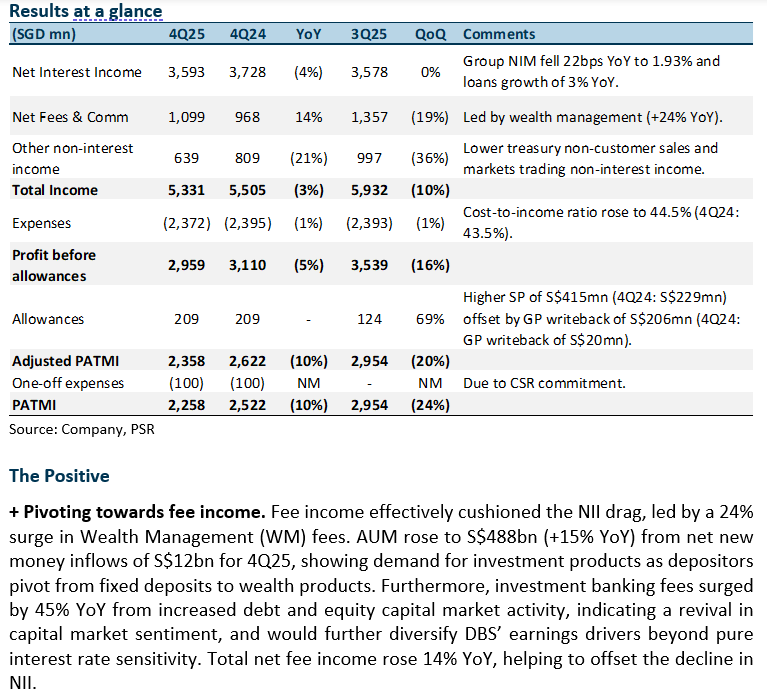
DBS’ 4Q25 adjusted earnings of S$2.4bn were slightly below our estimates, at 95% of our FY25e forecast. 4Q25 DPS raised 35% YoY to 81 cents (comprising 66 cents ordinary dividend and 15 cents capital return dividend), total FY25 DPS of S$3.06 (+38% YoY).
-
NII fell 4% YoY despite loan and deposit growth as NIMs declined 22bps YoY to 1.93%. WM fees continued to surge (+24% YoY), driving 14% growth in fee income. Higher SPs of S$451mn (+81% YoY) from a HK real estate NPL hurt earnings. DBS maintained its FY26e guidance for NII to be slightly below 2025 levels, non-interest income growth in the high single digits, credit costs to normalize at 17-20bps, and PATMI below 2025 levels from the lower interest rate environment. Capital return dividend (60cents/share per year) until FY27 and step up of 6cents/share per quarter until 3Q26 policy has been maintained.
-
Upgrade to ACCUMULATE from Neutral with a higher target price of S$60.00 (prev. S$58.00) as we roll over our valuations to FY26e, raise the terminal growth rate to 3.3% (from 3.2%), and lower the beta to 1.0 (prev. 1.1). We lower our FY26e earnings estimate by 5% from weaker NII estimates. We assume a 2.47x FY26e P/BV and a 16.3% ROE estimate in our GGM valuation. We expect non-interest income to be the main growth driver, as heightened volatility will benefit trading income and continued WM growth will stem from shifts in investor sentiment and AUM inflows. We prefer DBS among the Singapore banks given its continued capital return plans (until FY27), fixed DPS policy, and high dividend payout ratio (dividend yield FY26e: 5.7%, FY27e: 6.1%) despite lower earnings, which offer greater stability compared to its peers, which follow a floating payout ratio tied to earnings performance.
DBS Group Holdings Ltd – Capital return dividends until FY27
-
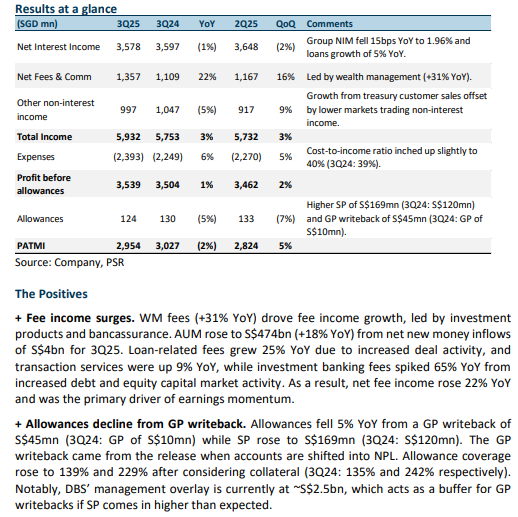
DBS’ 3Q25 earnings of S$3bn were slightly above our estimates, with 9M25 earnings at 77% of our FY25e forecast. 3Q25 DPS raised 39% YoY to 75 cents (comprising 60 cents ordinary dividend and 15 cents capital return dividend).
-
NII dipped 1% YoY despite loan and deposit growth as NIMs fell 15bps YoY to 1.96%. A surge in WM fees led fee income growth of 22%. DBS will continue its capital return plan until FY27, paying out a total of S$5bn in dividends over three years (60 cents/share until FY27). Management provided FY26e guidance for NII to be slightly below 2025 levels, non-interest income growth in the high single digits, credit costs to normalize at 17-20bps, and PATMI below 2025 levels from the lower interest rate environment.
-
Maintain ACCUMULATE with a higher target price of S$58.00 (prev. S$52.00) as we raise the terminal growth rate to 3.2% (from 2%) and increase our FY25e earnings estimate by 3% from lower provisions estimates. We assume a 2.34x FY25e P/BV and a 17% ROE estimate in our GGM valuation. We expect non-interest income to be the main growth driver, as heightened volatility will benefit trading income, and continued WM growth will stem from the shift in investor sentiment and AUM inflows. However, higher provisions and the global minimum tax would hurt PATMI in FY25. We prefer DBS among the Singapore banks given its continued capital return plans (until FY27) and its fixed dividend per share policy, which offer greater visibility and stability compared to its peers, which follow a floating payout ratio tied to earnings performance.
DBS Group Holdings Ltd – CASA growth supports NII
-
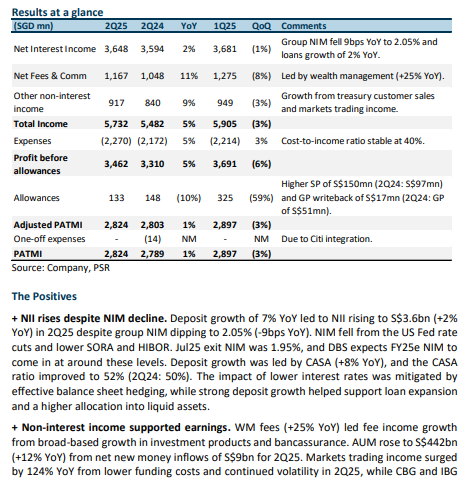
DBS’ 2Q25 earnings of S$2.8bn were in line with our estimates, with 1H25 earnings at 50% of our FY25e forecast. 2Q25 DPS raised 39% YoY to 75 cents (comprising 60 cents ordinary dividend and 15 cents capital return dividend).
-
NII rose 2% YoY from loan and deposit growth while NIM fell 9bps YoY to 2.05%. WM fees, treasury customer sales, and trading income led non-interest income growth of 11%. DBS has maintained FY25e guidance for NII at 2024 levels, non-interest income growth of mid to high single-digit, and PATMI below 2024 levels due to higher taxes.
-
Maintain ACCUMULATE with a higher target price of S$52.00 (prev. S$46.90) as we lower the beta to 1.1 (prev. 1.2) to reflect DBS’ more defensive earnings profile, strong capital position, and relatively lower sensitivity to market volatility compared to its peers. Our FY25e estimates remain unchanged. We assume a 2.09x FY25e P/BV and a 17.5% ROE estimate in our GGM valuation. We expect non-interest income to be the main growth driver, as heightened volatility will benefit trading income and continued WM growth from the shift in investor sentiment and AUM inflows. NII supported by huge deposit growth. However, higher provisions and the global minimum tax would hurt PATMI in FY25. We prefer DBS among the Singapore banks given its fixed dividend per share policy. DBS extended ordinary dividend guidance of additional 24 cents in FY26e.
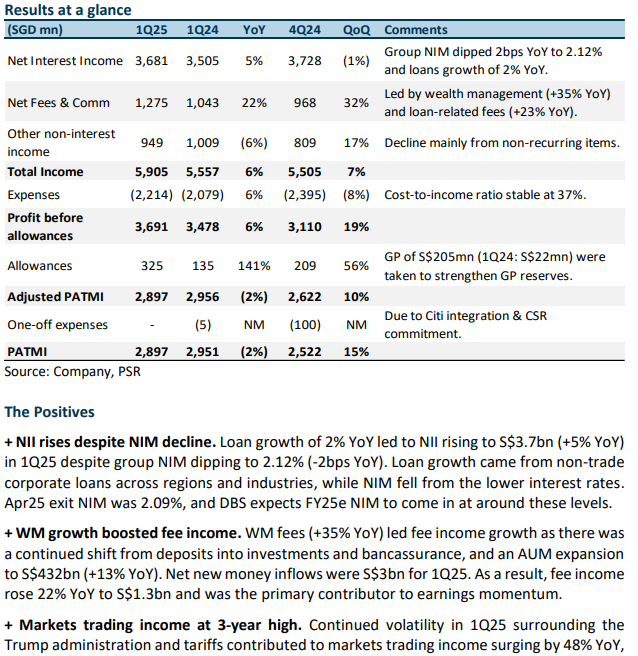
DBS Group Holdings Ltd – Fee growth offsets higher allowances
-
DBS’ 1Q2025 adjusted earnings of S$2.9bn were in line with our estimates, with 1Q25 adjusted earnings at 26% of our FY25e forecast. 1Q25 DPS raised 39% YoY to 75 cents (comprising 60 cents ordinary dividend and 15 cents capital return dividend).
-
NII rose 5% YoY from loan growth of 2% while NIM dipped 2bps YoY to 2.12%. WM fees, loan-related fees, and trading income led non-interest income growth of 8%. DBS has maintained FY25e guidance for NII at 2024 levels but lowered non-interest income growth guidance to mid to high-single-digit. PATMI will drop below 2024 levels due to higher taxes.
-
Maintain ACCUMULATE with a higher target price of S$44.50 (prev. S$43.90) as we raise FY25e earnings by ~2% from higher fee income and lower expenses. We assume a 1.79x FY25e P/BV as we raise our ROE estimate to 17.8% (prev. 17.5%) and lower risk-free rate to 2.5% (prev. 3.1%) and terminal growth rate to 1% (prev. 2%) in our GGM valuation. We expect non-interest income to be the main growth driver, as heightened volatility will benefit trading income and continued WM growth from the shift in investor sentiment and AUM inflows. However, higher provisions and the global minimum tax would hurt PATMI in FY25. The capital return initiative (24 cents annual increment, 15 cents capital return dividend per quarter, and S$3bn share buyback) and a 7% dividend yield are attractive.
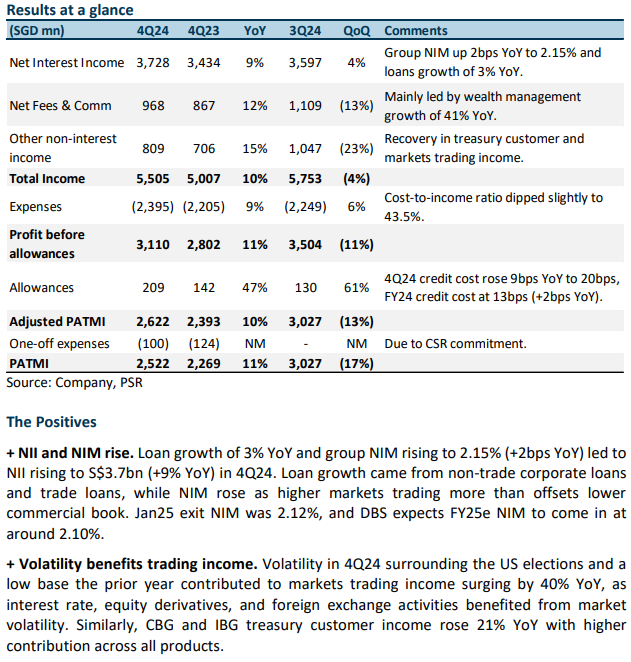
DBS Group Holdings Ltd – Capital returns begin
-
4Q24 adjusted PATMI of S$2.6bn was in line with our estimates, FY24 adjusted PATMI is 100% of our FY24e forecast. 4Q24 DPS rose 22% YoY to 60 cents and full-year FY24 DPS at S$2.22 (+27% YoY). An additional capital return dividend of 15 cents/quarter is to be given in 2025. We expect the return to sustain over the next 3 years.
-
NII rose 9% YoY from NIM rising by 2bps to 2.15% and loan growth of 3%. Non-interest income growth of 21% was led by WM fees and trading income. DBS has provided FY25e guidance for NII at 2024 levels and non-interest income growth of high-single-digit. PATMI will drop below 2024 levels from higher taxes.
-
Upgrade to ACCUMULATE with a higher target price of S$46.90 (prev. S$41.60) as we roll over our valuations. We lower FY25e earnings by ~2% from lower non-interest income and higher expenses and provisions. We assume a 1.88x FY25e P/BV and ROE estimate of 17.5% in our GGM valuation (prev. 18.3%). We expect non-interest income to be the main growth driver, as heightened volatility will benefit trading income and continued WM growth from the shift in investor sentiment and AUM inflows. However, higher expenses and provisions and the global minimum tax would hurt PATMI in FY25. The capital return initiative (24 cents annual DPS increase, 15 cents capital return dividend per quarter, and S$3bn share buyback) and a 6.7% dividend yield (including 15cents capital return dividend) are very attractive.
DBS Group Holdings Ltd – Volatility spurs trading income
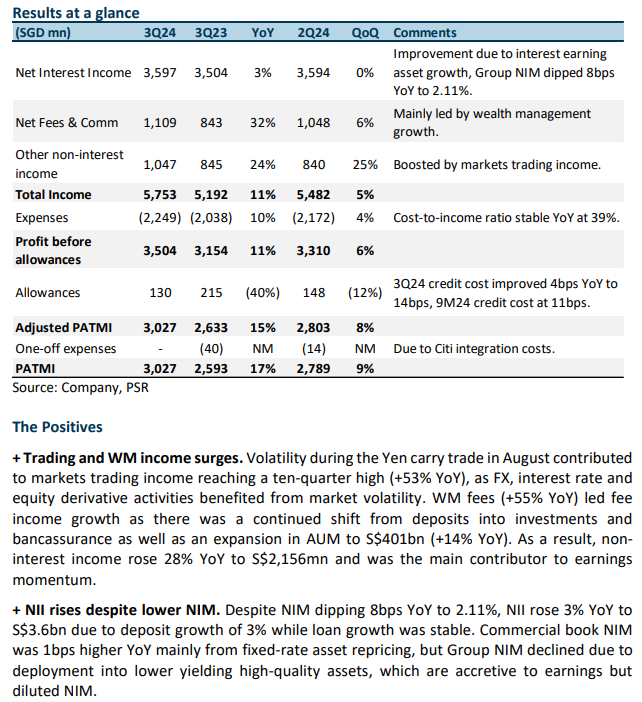
- 3Q24 adjusted PATMI of S$3.03bn was above our estimates due to higher fee income and trading income. 9M24 adjusted PATMI is 83% of our FY24e forecast. 3Q24 DPS rose 23% YoY to 54 cents.
- NII rose 3% YoY from interest earning asset growth while NIM dipped 8bps to 2.11%. Non-interest income growth of 28% was led by WM fees and trading income. DBS maintained its FY24e guidance with PATMI growth of mid to high-single digit, while providing FY25e guidance for NII at 2024 levels and non-interest income growth of high-single digit. PATMI to drop below 2024 levels.
- Maintain NEUTRAL with higher target price of S$41.60 (prev. S$38.50) as we raise our FY24e estimates. We raised FY24e earnings by ~7% from higher WM income, trading income and lower provisions. We assume a 1.98x FY24e P/BV and ROE estimate of 18.3% in our GGM valuation. We expect 4Q24 PATMI growth of ~9% YoY from stable growth in NII from the with continued fixed asset repricing and deployment of deposits into longer tenure income accretive interest earning assets, while double-digit fee and trading income growth will give a further boost to earnings. A steeper yield curve could provide tailwinds from another S$55bn of fixed assets to be repriced in FY25.
DBS Group Holdings Ltd – Fee income continues to support earnings
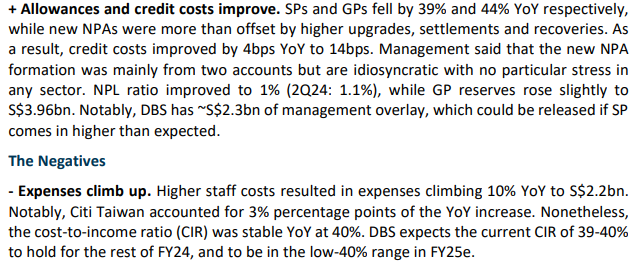
- 2Q24 adjusted PATMI of S$2.79bn was slightly above our estimates due to higher NII, fee income, and other non-interest income. 1H24 adjusted PATMI is 54% of our FY24e forecast. 2Q24 DPS raised 23% YoY to 54 cents.
- NII rose 5% YoY on loan growth of 2% YoY despite NIM dipping 2bps to 2.14%. Fee income rose 27% YoY from WM, cards and loan-related fees, while other non-interest income grew 6% YoY. DBS maintained its FY24e guidance of double-digit fee income growth (from wealth management and credit card fees) and credit cost of 17-20bps but increased its guidance for FY24e NII and PATMI to be above FY23 levels.
- Upgrade to BUY with an unchanged target price of S$38.50 as we account for recent share price performance. Our FY24e estimates remain unchanged. We assume a 1.83x FY24e P/BV and ROE estimate of 17.1% in our GGM valuation. We expect stable growth in NII from the continued fixed asset repricing and deployment of deposits into longer tenure income accretive interest earning assets, while loan growth to recover from rate cuts in 2H24. Double digit fee income growth will give a further boost to earnings.
The Positives
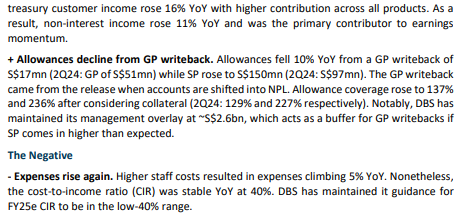
+ NII rises from loan and deposit growth. Despite NIM dipping 2bps YoY to 2.14%, NII rose 5% YoY to S$3.6bn due to loan and deposit growth of 3% and 6% respectively. Commercial book NIM was 2bps higher YoY mainly from fixed-rate asset repricing, but Group NIM dipped slightly due to deployment into lower yielding high-quality assets which are accretive to earnings but diluted NIM slightly. Management said that loan growth was broad-based but was seen more in Singapore and India, offset by Hong Kong loans shifting to mainland China.
+ WM leads fee income growth. Wealth management fees (+37% YoY) led fee income growth as there was a continued shift from deposits into investments and bancassurance as well as an expansion in assets under management (AUM). As a result, fee income rose 27% YoY to S$1,048mn. Card fees rose 32% YoY from higher spending, while loan-related fees grew 40% YoY. The consolidation of Citi Taiwan benefitted both WM and card fees. 2Q24 AUM grew 24% YoY to S$396bn while interest earning assets rose 20% YoY to S$447bn.
+ Credit cost and SPs improve YoY. SPs dipped 15% YoY to S$97mn, while new NPAs formation was more than offset by higher upgrades, settlements and recoveries. As a result, credit costs improved by 2bps YoY to 8bps. DBS said that the NPA formation was
idiosyncratic, and it did not see particular stress in any sector. However, 2Q24 total allowances rose to S$148mn (2Q23: S$114mn) as the lower SP was more than offset by higher GP of S$51mn (2Q23: write-back of S$42mn). The NPL ratio was flat at 1.1% (1Q24:
1.1%), while GP reserves grew 5% YoY to S$3.98bn. DBS has ~S$2bn of management overlay, which could be released if SP comes in higher than expected
The Negatives
- Expenses climb up. Higher staff costs due to salary increments and higher bonus accruals, as well as headcount growth including the addition of staff from Citi Taiwan resulted in expenses climbing 12% YoY to S$2,172mn. Notably, Citi Taiwan accounted for 5% points of the YoY increase. Non-staff costs were also higher from higher revenue-related expenses. As a result, the cost-to-income ratio (CIR) rose 2% points YoY to 40%. Nonetheless, this is still within DBS’ guidance of around 40%.
- CASA ratio decline continues. The Current Account Savings Accounts (CASA) ratio fell 6% points YoY to 50%, mainly due to the high-interest rate environment and a continued move towards fixed deposits (FDs). The declining CASA ratio could further increase funding cost and there could be an increased dependence on FDs, which usually comes at a higher interest rate. Nonetheless, total customer deposits grew 6% YoY to S$551bn as the growth in FDs more than offset the decline in CASA deposits.
DBS Group Holdings Ltd – NII and Fee Income boost earnings
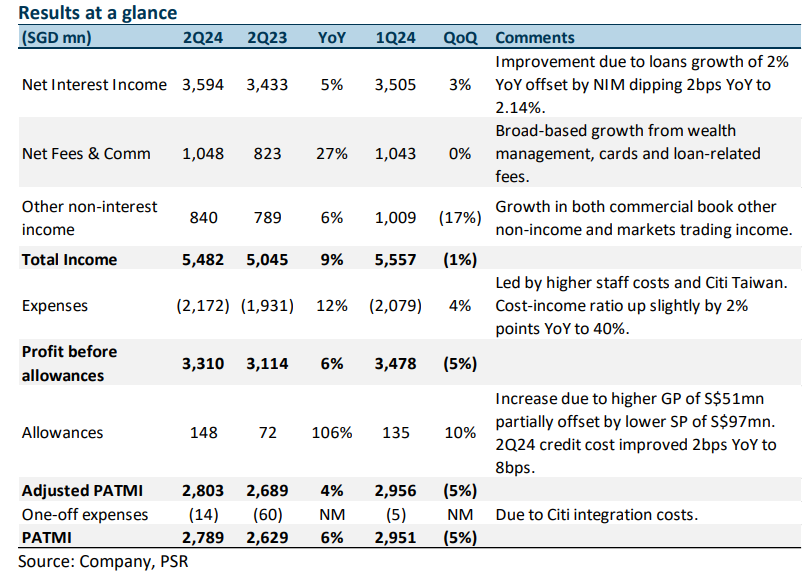
- 1Q24 adjusted PATMI of S$2.96bn was slightly above our estimates due to higher NII, fee income, and other non-interest income offset by higher expenses. 1Q24 adjusted PATMI is 28% of our FY24e forecast. 1Q24 DPS raised 29% YoY to 54 cents.
- NII rose 7% YoY on NIM expansion of 2bps and loan growth of 2% YoY. Fee income rose 23% YoY from WM and card fees, while other non-interest income grew 24% YoY. DBS has maintained its FY24e guidance of double-digit fee income growth (from wealth management and credit card fees) and credit cost of 17-20bps but increased its guidance for FY24e NII and PATMI to be above FY23 levels.
- Downgrade to ACCUMULATE with a lower target price of S$38.50 (prev. S$38.90) as we account for recent share price performance and 1-for-10 bonus share issue. We increased FY24e earnings by 2% as we increased NII estimates due to higher NIMs, fee income, and loan growth estimates. We assume a 1.83x FY24e P/BV and ROE estimate of 17.1% in our GGM valuation. Modest growth in NII from stable NIMs, low-single-digit loan growth, and double-digit growth in fee income will sustain earnings momentum.
The Positives
+ NII rises 7% YoY. NII rose 7% YoY to S$3.5bn due to a 2bps NIM increase to 2.14% (4Q23: 2.13%) as interest rates continue to remain high and loan growth grew modestly by 2% YoY. Loan growth came from higher non-trade corporate loans and the consolidation of Citi Taiwan. Management noted that loan growth was broad-based but was seen more in Singapore and India, which was offset by Hong Kong loans shifting to mainland China.
+ Fee income continues to recover. Fee income rose 23% YoY to a record level of S$1,043mn. The growth was led by wealth management (WM) fees surging 47% YoY from stronger market sentiment and an increase in assets under management (AUM). Card fees rose 33% YoY from higher spending, while loan-related fees grew 30% YoY. The consolidation of Citi Taiwan benefitted both WM and card fees. This was offset slightly by a decline in investment banking fees (-59% YoY) due to slower capital market activities while transaction services were flat YoY.
+ Other non-interest income rose 24% YoY. This growth was mainly due to higher treasury customer sales, partially offset by a decline in market trading income from higher funding costs. Notably, commercial book continues to account for the majority of other non-interest income at 62% (1Q23: 53%), while treasury markets account for 38% (1Q23: 47%).
The Negatives
- SPs and NPAs rise YoY. SPs rose 82% YoY to S$113mn, while new NPAs rose 45% YoY to S$317mn from broad-based increases across all sectors. As a result, credit costs rose from 4bps YoY to 10bps. DBS has mentioned that the NPA formation was idiosyncratic, and they do not see particular stress in any sector. Nonetheless, 1Q24 total allowances were lower by 16% YoY as the higher SP was more than offset by a lower GP of S$22mn (1Q23: S$99mn). The NPL ratio was flat at 1.1% (4Q22: 1.1%), while GP reserves grew 4% YoY to S$3.93bn. Notably, management mentioned ~S$2bn of management overlay, which could be released if SP comes in higher than expected.
- The decline in the CASA ratio continues. The Current Account Savings Accounts (CASA) ratio fell 6% points YoY to 51%, mainly due to the high-interest rate environment and a continued move towards fixed deposits (FDs). The declining CASA ratio could further increase funding cost and there could be an increased dependence on FDs, which usually comes at a higher interest rate. Nonetheless, total customer deposits grew 3% YoY to S$547bn as the decline in CASA deposits was offset by growth in FDs and a contribution of S$12bn from the Citi Taiwan consolidation.
DBS Group Holdings Ltd – Fee income recovers; strong dividend growth
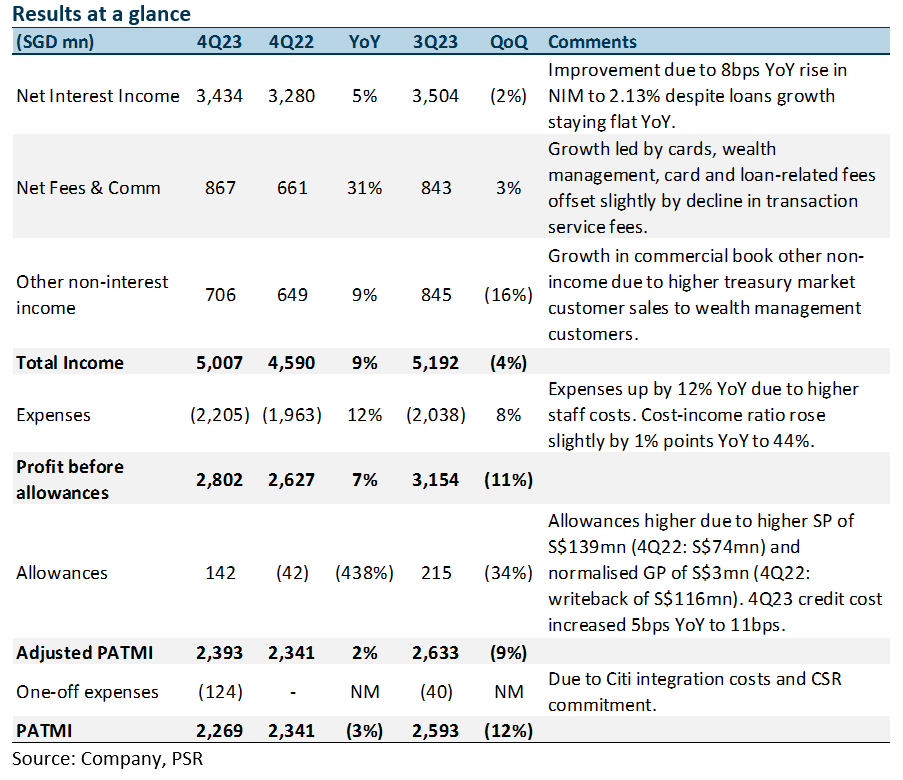
- 4Q23 adjusted PATMI of S$2.39bn was slightly above our estimates due to higher NII, fee income, and other non-interest income offset by higher allowances. FY23 adjusted PATMI is 102% of our FY23e forecast. 4Q23 DPS is raised 29% YoY to 54 cents with an additional 1-for-10 bonus issue, dividend payout ratio was higher at 48.5% in FY23 (FY22: 47.7% excluding special dividends).
- NII rose 5% YoY on NIM expansion of 8bps despite loan growth remaining flat. Fee income rose 31% YoY, while other non-interest income grew 9% YoY. DBS has maintained its FY24e guidance of double-digit fee income growth (from wealth management and credit card fees), stable NII as higher NIMs from higher-for-longer rates will be offset by lower loan growth and total allowances to normalise to 17-20bps of loans. FY24e PATMI to be maintained at around the current levels in FY23.
- Maintain BUY with a lower target price of S$38.90 (prev. S$41.60). We lower FY24e earnings by 1% as we lower NII estimates for FY24e due to lower NIMs, and increase allowances and OPEX estimates, offset by higher fees, and other non-interest income. We assume 2.14x FY24e P/BV and ROE estimate of 16.0% in our GGM valuation. Stable NII from a recovery in loan growth and double-digit growth in fee income will sustain earnings momentum.
The Positives
+ NIM and NII continue to increase YoY. NII rose 5% YoY to S$3.4bn due to an 8bps NIM increase to 2.13% (3Q23: 2.19%) as interest rates continue to remain high, despite loan growth remaining flat YoY. Loan growth was stable as higher trade and consumer loans were offset by lower non-trade corporate loans. Nonetheless, the Citi Taiwan consolidation contributed S$10bn to loans.
+ Fee income recovers strongly. Fee income rose 31% YoY to S$867mn. WM fees increased 41% YoY driven by strong net new money inflows as customers shifted deposits into bancassurance and investments, while card fees grew 27% YoY from higher spending and the integration of Citi Taiwan. Loan-related fees rose 80% YoY, while investment banking fees were up 26% YoY. These increases were moderated by a 4% YoY decline in transaction fees as trade finance slowed.
+ Other non-interest income rose 9% YoY. Other non-interest income growth was mainly due to higher treasury customer sales and gains from investment securities. Notably, commercial book accounts for a majority of other non-interest income was at 55%, while treasury markets accounts for 45%.
The Negatives
- Allowances rose 438% YoY. 4Q23 total allowances were higher 438% YoY due to normalised GP of S$3mn (4Q22: writeback of S$116mn) and higher SP of S$139mn (4Q22: S$74mn). As a result, 4Q23 credit costs rose to 11bps, with FY23 credit costs at 11bps. The NPL ratio was flat at 1.1% (4Q22: 1.1%), while GP reserves grew 4% YoY to S$3.90bn. Notably, management mentioned S$2.2bn of management overlay, which could be released if SP comes in higher than expected.
- CASA ratio decline continues. The Current Account Savings Accounts (CASA) ratio fell 8% points YoY to 52.3%, mainly due to the high-interest rate environment and a continued move towards fixed deposits (FDs). Nonetheless, total customer deposits grew 2% YoY to S$535bn as the decline in CASA deposits was offset by growth in FDs and a contribution of S$12bn from the Citi Taiwan consolidation.
DBS Group Holdings Ltd – Growth across the board offset by allowances
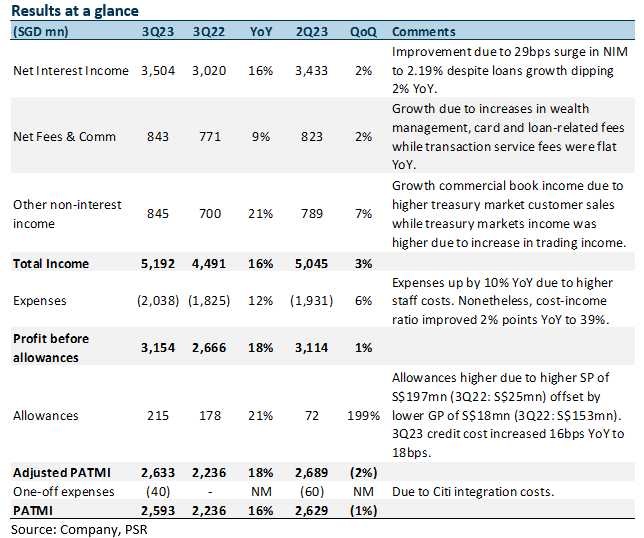
- 3Q23 adjusted PATMI of S$2.63bn was above our estimates due to higher NII, fee income and other non-interest income offset by higher allowances. 9M23 adjusted PATMI is 78% of our FY23e forecast. 3Q23 DPS is raised 14% YoY to 48 cents.
- NII rose 16% YoY on NIM expansion of 29bps despite loan growth dipping slightly. Fee income rose 9% YoY, while other non-interest income grew 21% YoY. DBS has maintained its FY23e guidance. It provided FY24e guidance of double-digit fee income growth (from wealth management and credit card fees), stable NII as higher NIMs from higher-for-longer rates will be offset by lower loan growth and total allowances to normalise to 17-20bps of loans. FY24e PATMI to be maintained at around the current levels in FY23.
- Maintain BUY with an unchanged target price of S$41.60. Our FY23e estimates remain unchanged. We assume 1.90x FY23e P/BV and ROE estimate of 16.6% in our GGM valuation. Continued NIM growth from higher-for-longer interest rates and a recovery in fee income will sustain earnings momentum.
The Positives
+ NIM and NII continue to increase YoY. NII rose 16% YoY to S$3.5bn due to a 29bps NIM increase to 2.19% (2Q23: 2.16%) as interest rates continue to remain high, despite loan growth dipping 2% YoY. Loan growth dipped due to a decline in customer and trade loans due to unattractive pricing while non-trade corporate loans were lower due to higher repayments. Nonetheless, the Citi Taiwan consolidation contributed S$10bn to loans.
+ Fee income continues to grow. Fee income rose 9% YoY to S$843mn. WM fees increased 22% YoY from higher bancassurance and investment product sales, while card fees grew 21% YoY from higher spending and the integration of Citi Taiwan. Loan-related fees rose 12% YoY, while transaction fees were flat YoY. These increases were moderated by a 16% YoY decline in investment banking fees due to slower capital market activities.
+ Other non-interest income rose 21% YoY. Other non-interest income rose 21% YoY mainly due to an increase in net trading income from higher trading gains and an increase in treasury customer sales to both wealth management and corporate customers. Notably, commercial book accounts for majority of other non-interest income was at 59%, while treasury markets accounts for 41%.
The Negatives
- Allowances rose 21% YoY. 3Q23 total allowances were higher 21% YoY due to higher SP of S$197mn (3Q22: S$25mn). Resultantly, 3Q23 credit costs rose to 18bps, with 9M23 credit costs at 11bps. The rise in SP was due to allowances being prudently taken for exposures linked to the recent money laundering case in Singapore. The NPL ratio rose slightly to 1.2% (3Q22: 1.1%), while GP reserves were stable YoY at S$3.91bn.
- CASA ratio decline continues. The Current Account Savings Accounts (CASA) ratio fell 12.5% points YoY to 47.8%, mainly due to the high interest rate environment and a continued move towards fixed deposits (FDs). Resultantly, total customer deposits were flat YoY at S$531bn as the decline in CASA deposits were partially offset by growth in FDs.
Get access to all the latest market news, reports, technical analysis
by signing up for a free account today!
Login
The full article is only available for premium content subscribers. To continue reading this article, please log in:
Not a Premium Content Subscriber yet? Sign up here!
- Home >
- Phillip Research Report
