Airbnb Inc – More than just a stay
- On 13 May 2025, Airbnb announced major upgrades in its Summer Release, including new services, expanded experiences, and an all-in-one app.
- The new business launch follows Airbnb’s planned FY25e CAPEX of US$200mn-250mn, aimed at expanding revenue beyond short-term rentals and generating significant revenue as they scale over the coming years.
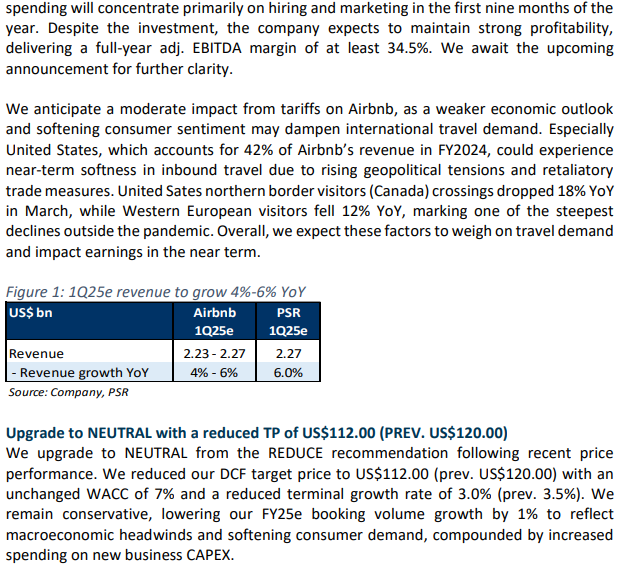
- We maintain REDUCE with an unchanged TP of US$112.00 (WACC 7%, g 3%). We expect Airbnb to deliver a full-year adjusted EBITDA margin of at least 34.5%, despite higher spending on hiring and marketing in the first nine months of FY25e, as guided earlier in the year. However, it is still too early to assess the performance of the new business, which may take time to contribute meaningfully to ABNB’s growth, likely from FY26e onward. Combined with stalled travel demand and softer consumer sentiment, especially in the US in 2Q25e amid ongoing macro uncertainty, we expect travellers to remain cautious, adopting a wait-and-see approach.

Airbnb Inc – Softer travel demand expected
- 1Q25 revenue was within expectations at 19% of our FY25e forecasts due to seasonality weakness, while earnings missed estimates coming in at 5% of our FY25e forecast on higher product development costs and lower interest income. We expect profitability in 2H25e to rebound strongly, driven by summer travel demand and higher operating leverage.
- For 2Q25e, Airbnb expects revenue to rise 10% YoY to US$3.02bn. Booking volumes are expected to moderate relative to 1Q25, due to softer U.S. travel demand amid macro uncertainty. Adj. EBITDA is expected to rise YoY, though margins may be flat to slightly lower, reflecting increased marketing spend tied to the new business investments for the Summer release.
- We downgrade to REDUCE from NEUTRAL recommendation due to recent price performance. We maintain our DCF target price of US$112.00 (WACC 7%, g 3%). Our FY25e revenue estimates remain unchanged while we nudge our PATMI lower by 3% to account for lower interest income. We believe valuations appear somewhat full at 34x FY25e P/E, with a FY25e earnings growth rate of ~8% YoY. This is also a significant premium to the market and online travel agency rivals, such as Booking Holdings (24x) and Expedia Group (12x).
Airbnb Inc – Weakening macro outlook
- Accelerating double-digit growth in emerging markets (Latin America and Asia-Pacific) has driven strong growth in new users and booking volume.
- Airbnb plans to invest US$200–250mn in new businesses launching in May 2025 while maintaining strong profitability with at least a 34.5% full-year adj. EBITDA margin (as of 13 Feb’s guidance).
-
We upgrade to NEUTRAL from the REDUCE recommendation following recent price performance. We reduced our DCF target price to US$112.00 (prev. US$120.00) with an unchanged WACC of 7% and a reduced terminal growth rate of 3.0% (prev. 3.5%). We remain conservative, lowering our FY25e booking volume growth by 1% to reflect macroeconomic headwinds and softening consumer demand, compounded by increased spending on new business CAPEX.
Airbnb Inc – Valuations remain expensive
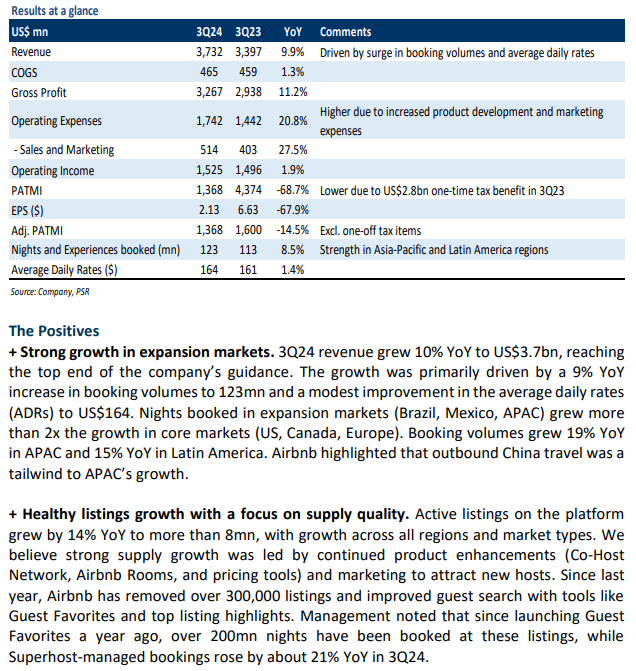
- 9M24 revenue/adj. PATMI exceeded expectations at 79%/85% of our FY24e forecasts. In 3Q24, revenue grew 10% YoY to US$3.7bn, driven by a 9% YoY increase in booking volumes due to strong summer travel demand. Adj. PATMI dropped 15% YoY to US$1.4bn due to higher marketing costs and income taxes.
- For 4Q24e, Airbnb expects revenue to rise 9% YoY to US$2.4bn. The company expects a sequential improvement in the YoY growth rate of booking volumes. However, adj. EBITDA margin is expected to contract by ~600 basis points YoY to 27%, due to higher product development and marketing expenses.
- We downgraded to REDUCE from the NEUTRAL recommendation as we account for recent share price performance. We maintain our DCF target price of US$120.00 with an unchanged WACC of 7% and a terminal growth rate of 3.5%. We nudge higher our FY24e revenue/adj. PATMI estimates by 1% to account for higher average daily rates and interest income. We believe valuations seem quite full at 31x FY25e P/E, with FY25e earnings growth rate of ~11% YoY. It is also a significant premium to the market and OTA rivals like Booking Holdings (24x) and Expedia Group (13x).
Airbnb Inc – Slowing travel demand
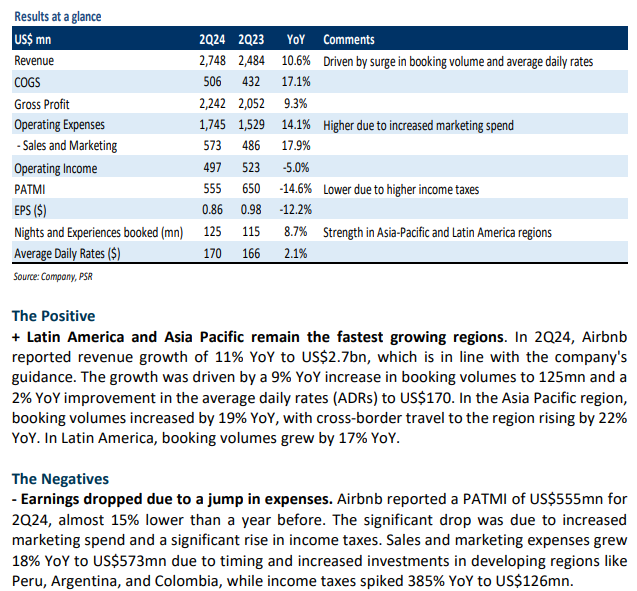
- 2Q24 revenue was within expectations due to seasonality weakness, while earnings was a miss on increased marketing spend and higher income taxes. 1H24 revenue/PATMI was at 44%/29% of our FY24e estimates. We expect PATMI to be backloaded into 2H24e driven by summer travel demand around the Olympics.
- For 3Q24e, Airbnb expects revenue to rise 9% YoY to US$3.7bn. The company expects sequential moderation in the YoY growth rate of booking volumes due to slowing travel demand in the US and shortening booking windows globally.
- We maintain NEUTRAL recommendation but lower our DCF target price to US$120.00 (prev. US$150.00). We maintain a WACC of 7.0%, but lower our terminal growth rate to 3.5% (prev. 4%) due to slowing travel demand. We cut our FY24e revenue/PATMI by 1%/9% to account for moderating travel demand and higher expenses. We expect moderating travel demand as booking patterns normalise from its post-pandemic peak.
Airbnb Inc – Solid results overshadowed by weak guidance
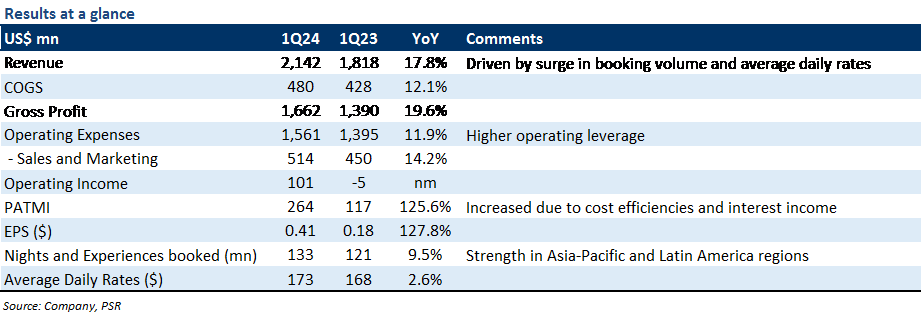
- 1Q24 revenue/PATMI was within expectations at 19%/9% of our FY24e forecasts because of seasonality weakness. Revenue growth of 18% YoY was led by a 10% YoY surge in booking volumes. We expect profitability in 2H24e to rebound strongly, driven by summer travel demand around the Olympics and higher operating leverage.
- For 2Q24e, Airbnb expects revenue to rise 9% YoY to US$2.7bn. The significant drop in growth rate is likely due to the timing of the Easter holiday this year and the unfavorable foreign exchange rates. Management reiterated its prior guidance to deliver an adj. EBITDA margin of at least 35% in FY24e (FY23: 37%).
- We maintain our NEUTRAL recommendation with an unchanged DCF target price of US$150 (WACC 7%, g 4%). Our FY24e revenue estimates remain unchanged while we nudge higher our PATMI by 2% to account for higher interest income. We expect moderating travel demand as booking patterns normalise from its post-pandemic peak.
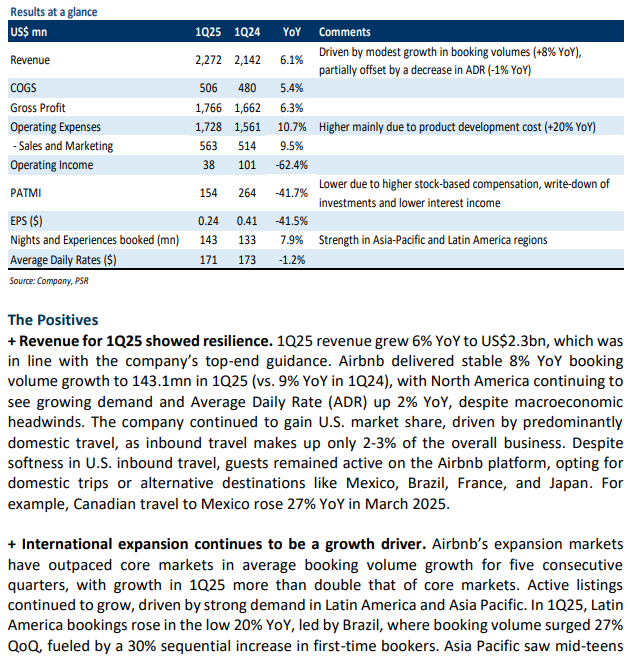
The Positives
+ Revenue for 1Q24 showed strong growth. 1Q24 revenue grew 18% YoY to US$2.1bn, which was 4% above the top end of the company guidance. This outperformance was primarily driven by a 10% YoY increase in booking volumes to 133mn, a 3% YoY improvement in the average daily rates to US$173, and a shift in the Easter holiday this year. Airbnb reported a 21% YoY growth in bookings in the Asia-Pacific region and a 19% YoY growth in Latin America. Meanwhile, the number of cross-border nights booked grew by 10% YoY, representing 46% of total booking volumes in the quarter.
+ Net margin improved on lower costs and higher interest income. Airbnb expanded its net profit margin by 6% points YoY to 12%, while PATMI more than doubled to US$264mn. The margin improvement was mainly due to top-line upside, higher operating leverage, and 38% YoY increase in interest income to US$202mn. The sales and marketing expenses grew by 14% YoY to US$514mn (1Q23: 30% YoY).
The Negative
- Soft 2Q24e revenue guidance. For 2Q24e, Airbnb expects total revenue to grow 9% YoY to US$2.7bn (2Q23: 18% YoY). The significant slowdown is mainly because of unfavourable foreign exchange rates and holiday-related stays being pulled forward to 1Q24, as the Easter holiday fell in March instead of April this year.
Airbnb Inc – Slowdown in booking volumes
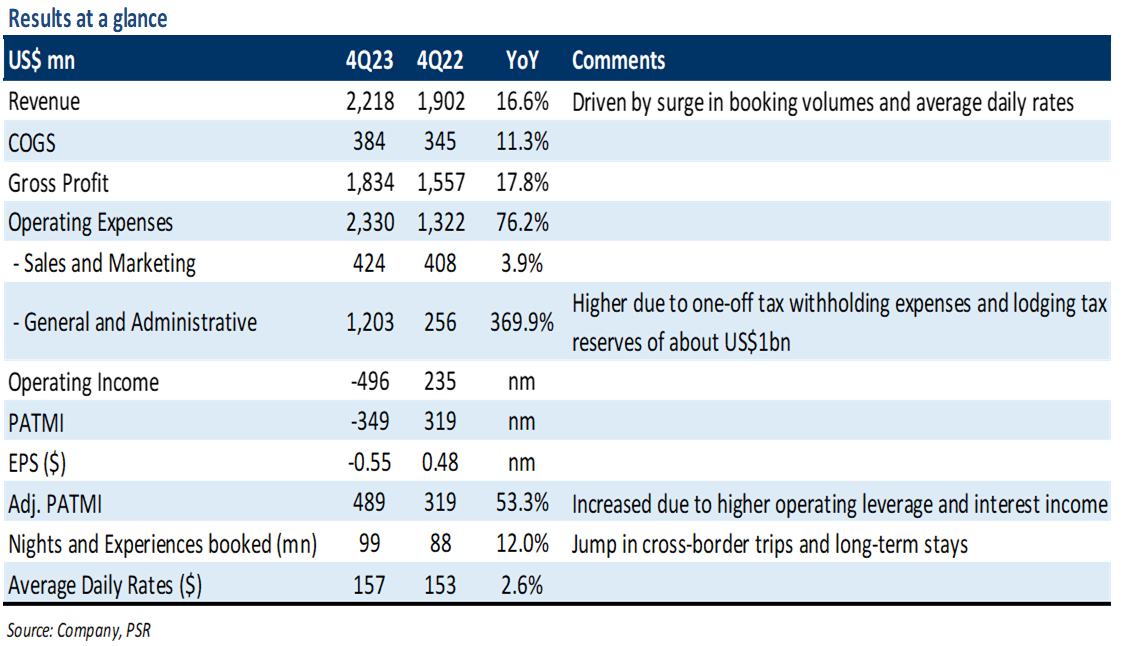
- FY23 revenue/adj. PATMI met our expectations at 101%/103% of our forecasts. 4Q23 revenue grew 17% YoY to US$2.2bn led by a 12% YoY surge in booking volumes. Adj. PATMI (excl. one-off tax items of US$1bn) grew 53% YoY to US$489mn on higher operating leverage and interest income.
- For 1Q24e, Airbnb expects revenue to rise 13% YoY to US$2.05bn. The booking volume growth rate is expected to further decelerate to high-single digits due to tough comparisons. For FY24e, Airbnb expects adj. EBITDA margins of at least 35% compared to 37% in FY23 as it plans to invest in product development and marketing.
- We downgrade to NEUTRAL from BUY recommendation after the recent jump in its stock price. We lower our DCF target price to US$150.00 (prev. US$157.00) with an unchanged WACC of 7% and terminal growth rate of 4%. We lower our FY24e revenue/adj. PATMI estimates by 1%/14% to account for moderation in travel demand and higher expenses.
The Positives
+ Revenue boosted by international and long-duration bookings. 4Q23 revenue grew 17% YoY to US$2.2bn, 2% above the top end of its own revenue guidance (US$2.17bn). This outperformance was led by a 12% YoY increase in booking volumes to 99mn, 3% YoY improvement in the average daily rates to US$157, and a 3% FX tailwind. Cross-border nights booked grew 13% YoY (strength in the Asia-Pacific and Latin America regions) and represented 44% of total nights booked, while urban nights booked increased by 11% YoY. Meanwhile, long-term stays of 28 days or more accounted for 19% of total gross nights booked, led by the flexibility granted by remote work environments.
+ Supply continues to expand. Active listings on the platform grew by 18% YoY to more than 7.7mn. The supply growth was in double-digits across all regions, with the highest growth in the Asia Pacific and Latin America regions. We believe strong supply growth was led by continued product enhancements (The Listings tab, Airbnb Rooms, and pricing tools) and marketing to attract new hosts. Airbnb reported that it now has more than 5mn hosts worldwide.
The Negative
- Further deceleration in booking volume growth. Airbnb guided 1Q24e revenue to be in the range of US$2.03bn to US$2.07bn (12%-14% YoY growth), representing a decline in topline growth. The slowdown is mainly because the YoY growth rate of nights booked is expected to further decelerate relative to 12% in 4Q23 (vs 19% in 1Q23) due to tough comparisons following the Omicron-fueled pent-up demand seen in 1Q23.
Outlook
Airbnb witnessed stable demand at the start of the year, but management noted that 1Q24e would face tough comparables. For 1Q24e, Airbnb expects total revenue to grow by 13% YoY to US$2.05bn, taking the midpoint (Figure 1). Management noted that the timing of Easter will have a positive 1% to 2% impact on 1Q24e revenue growth as holiday-related stays are pulled forward to 1Q24e. Airbnb expects the booking volume growth rate to moderate relative to 12% in 4Q23, though it expects average daily rates to be flat to slightly up compared to 1Q23.
Airbnb expects to deliver adj. EBITDA (excluding stock-based compensation expense) growth on a nominal basis in both 1Q24e and FY24e. The company also expects 1Q24e adj. EBITDA margin to expand YoY mainly due to the timing of expenses. For FY24e, Airbnb expects adj. EBITDA margins of at least 35% compared to 37% in FY23 as it plans to invest in product development and marketing. Additionally, the company announced a new share repurchase authorisation of up to US$6bn shares.
Airbnb Inc – Strong earnings growth as travel rebounds
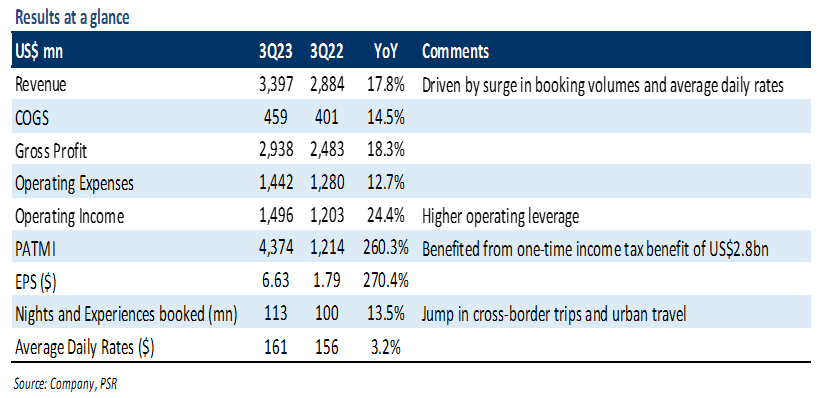
- 9M23 revenue/adj. PATMI exceeded expectations at 79%/91% of our FY23e forecasts. In 3Q23, revenue grew 18% YoY driven by a 14% YoY surge in booking volumes due to record travel demand over the summer season. Adj. PATMI spiked 32% YoY to US$1.6bn driven by higher operating leverage.
- For 4Q23e, Airbnb expects revenue to rise 13% YoY to US$2.15bn. Management also expects booking volumes growth rate to decelerate sequentially due to macroeconomic factors and geopolitical tension in the Middle East.
- We upgrade to BUY from ACCUMULATE recommendation after the recent fall in its stock price. We nudge our DCF target price to US$157.00 (prev. US$152.00) with a WACC of 7% and terminal growth of 4%. We increase our FY23e revenue/PATMI by 2%/116% to account for higher average daily rates and one-time income tax benefit. Airbnb benefits from the shift towards alternative accommodations as it offers record levels of active listings on its platform, benefits from travelers looking for long-term stays, and is more family and group travel-friendly.
The Positives
+ Booking volumes continued to accelerate. 3Q23 revenue grew 18% YoY to US$3.4bn, in line with the top end of US$3.4bn company guidance. Revenue was driven by 14% YoY growth in booking volumes to 113mn, 3% YoY improvement in the average daily rates to US$161, and a 4% FX tailwind. Cross-border booking volumes grew 17% YoY (strength in APAC regions), while urban nights booked increased by 15% YoY. Meanwhile, stays of 28 days or more accounted for 18% of total gross nights booked led by the flexibility granted by remote work environment.
+ Strong listings growth. Airbnb added about 1mn active listings this year. In 3Q23, active listings on the Airbnb platform grew by 19% YoY to more than 7mn. Active listings increased across all market types (urban and non-urban) and regions, with highest growth in APAC and Latin America regions. We believe strong supply growth was led by continued product enhancements (Airbnb Rooms, Monthly Stays, and pricing tools) and marketing to attract new hosts.
The Negative
- Cautious 4Q23e outlook. Airbnb guided 4Q23e revenue to be in the range of US$2.13bn-2.17bn (12%-14% YoY growth), representing a decline in topline growth. Management expects travel demand to slow down due to increased volatility led by geopolitical events in the Middle East and macroeconomic factors. As a result, Airbnb expects booking volumes growth rate to moderate sequentially based on QTD trends.
Airbnb Inc – Travel rebound continues
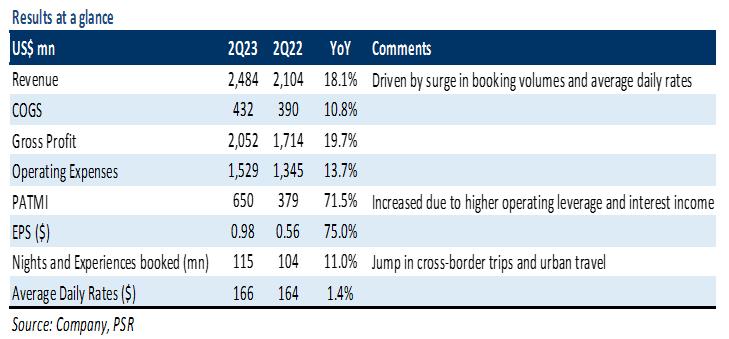
- 1H23 revenue/PATMI was within expectations at 46%/32% of our FY23e forecasts because of seasonality weakness. In 2Q23, PATMI rose 71% YoY to US$650mn. We expect Airbnb to demonstrate strong profit growth in 2H23e supported by busy summer travel and higher operating leverage.
- Airbnb expects 3Q23e revenue growth of 14% to 18% YoY. Management also guided for a modest sequential acceleration in YoY growth rate of booking volumes. For FY23e, adj. EBITDA margin is anticipated to be modestly higher than FY22 of 35%.
- We downgrade to ACCUMULATE from BUY recommendation after the recent jump in its stock price. We raise our DCF target price to US$152.00 (prev. US$143.00) with a WACC of 7% and terminal growth of 4%. We increase our FY23e revenue/PATMI by 3%/8% to account for higher average daily rates and interest income. We believe Airbnb is well-positioned to benefit from shift towards alternative accommodations as it offers record levels of active listings on its platform, benefits from travelers looking for long-term stays, and is more family and group travel-friendly.
The Positives
+ Revenue beats guidance. In 2Q23, revenue grew by 18% YoY to US$2.5bn, ahead of the company’s guidance range of 12% to 16% YoY growth. Revenue growth was mainly driven by 11% YoY surge in booking volumes and 1% YoY increase in the average daily rates, or ADRs, to US$166. Cross-border bookings grew by 16% YoY as international travel is accelerating, accounting for 45% of gross nights booked. Urban nights booked increased by 13% YoY as guests are returning to cities, representing 48% of gross nights booked. In addition, guests are staying longer, with stays of 28 days or more accounting for 18% of gross nights booked driven by the flexibility granted by remote work.
+ Listings reach record high. In 2Q23, total active listings on Airbnb platform grew by 19% YoY to 7mn. Management highlighted that the growth came across all market types (urban and non-urban), with the highest growth rates in Latin America and APAC regions. We believe strong supply growth was led by continued product improvements and marketing to attract new hosts. In May, Airbnb introduced 50+ features and upgrades as a part of its 2023 Summer Release, including Airbnb Rooms, Monthly Stays, and pricing tools that enable hosts to compare their listing prices to the average rates of smililar listings nearby.
The Negative
- Deceleration in booking volumes. In 2Q23, the nights and experiences booked grew by 11% YoY to 115.1mn compared with 19% growth rate in 1Q23 and 25% in 2Q22. The deceleration was mainly because of tough comparisons due to pent-up travel demand (post-Omicron) seen in 2Q22.
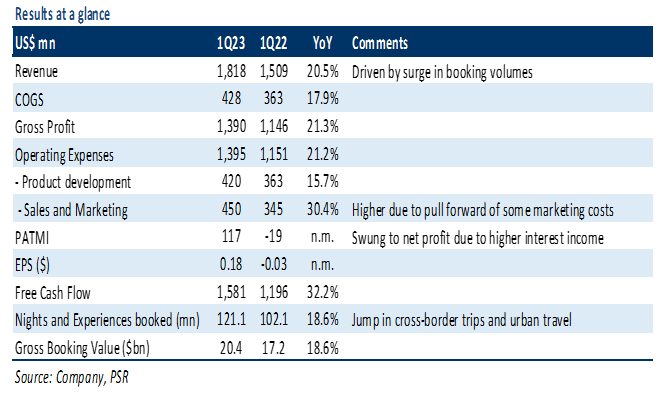
Airbnb Inc – Strong performance overshadowed by soft guidance
- 1Q23 revenue/PATMI was within expectations at 19%/6% of our FY23e forecasts because of seasonality weakness. Revenue growth of 20% YoY was led by a 19% YoY surge in booking volumes. We expect profitability in 2H23e to rebound strongly driven by summer travel demand and higher operating leverage.
- Airbnb expects 2Q23e revenue growth of 12-16% YoY. Booking volumes face pressure from tough comparisons following the Omicron-fueled pent-up demand in 2Q22. Management reiterated its adj. EBITDA margin guidance of about 35% for FY23e.
- We upgrade to BUY from ACCUMULATE recommendation after the recent fall in its stock price. We lower our DCF target price to US$143.00 (prev. US$149.00) with a WACC of 7% and terminal growth of 4%. We lower our FY23e revenue estimates by 2% due to softening travel demand, while increasing our PATMI by 13% to account for higher interest income. We believe Airbnb platform offers better non-urban location listings versus hotels, benefits travelers looking for long-term stays, and is more family and group travel-friendly.
The Positives
+ Consumer travel demand remained strong. In 1Q23, revenue grew 20% YoY to US$1.8bn despite 4% FX headwinds, implying 24% YoY growth on a constant currency basis. The significant growth was driven by record booking volumes and stable average daily rates (ADRs) of US$168. The number of nights and experiences booked jumped 19% YoY to 121.1mn driven by growth in cross-border trips (up 36% YoY) and urban nights booked (up 20% YoY). Long-term stays (28 days or more) accounted for 18% of total booking volumes driven by the flexibility granted by remote work.
+ Supply continued to accelerate. Total active listings on the platform increased by 18% YoY to an implied 7.6mn. Both urban and non-urban supply increased by 18% YoY. The supply growth is mainly due to continued product innovation to attract new hosts (Airbnb Setup, Ask a Superhost, and insurance and better tools for hosts) and more people turning to hosting to earn extra income.
The Negative
- Soft 2Q23e revenue guidance due to tough comparisons. For 2Q23e, Airbnb anticipates total revenue to be in the range of US$2.35bn to US$2.45bn (up 12-16% YoY). The slowing revenue growth is mainly because of tough comparisons following the Omicron-fueled pent-up demand seen in 2Q22 and as well as lower average daily rates (ADRs) due to the business mix shift towards urban and APAC regions.
Get access to all the latest market news, reports, technical analysis
by signing up for a free account today!
Login
The full article is only available for premium content subscribers. To continue reading this article, please log in:
Not a Premium Content Subscriber yet? Sign up here!
- Home >
- Phillip Research Report
