Investors often pay attention to tactical indicators such as VIX (CBOE Volatility Index), AAII (American Association of Individual Investors) Sentiment Survey Bull-Bear Spread and CBOE Put/Call Ratio for insights on stock market greed and fear behaviour to time possible entries and exits.
This report looks at the relationship between each of these indicators and the S&P 500, to find out if they can be lead indicators for market direction.
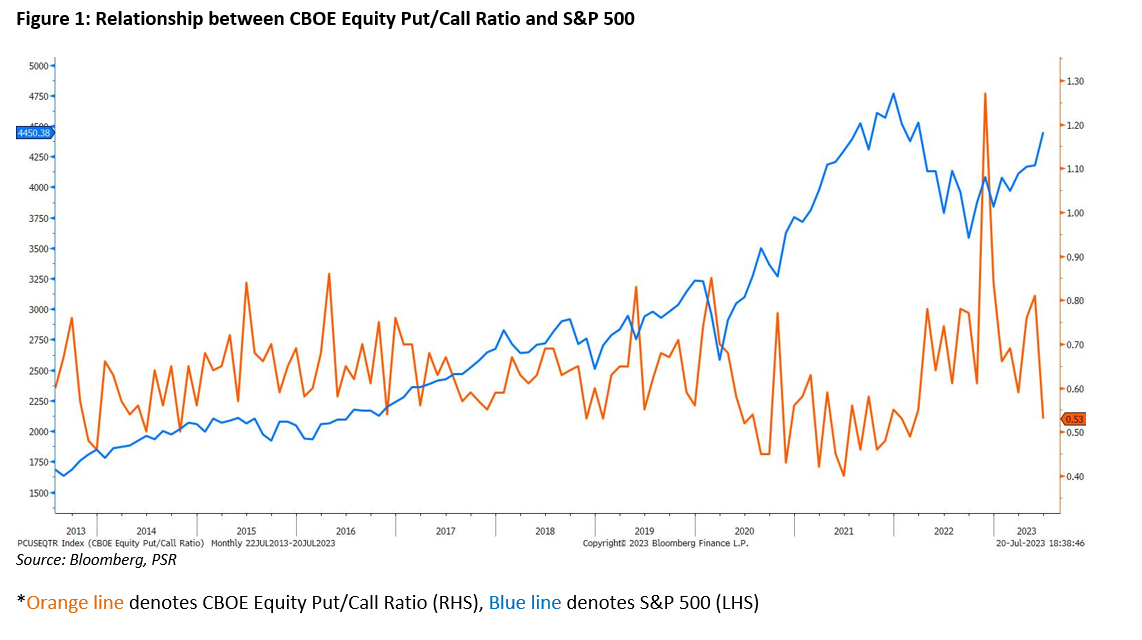
CBOE Equity Put/Call Ratio
CBOE’s equity put/call ratio looks at equity options. A high put/call ratio suggests that the market is overly bearish and stocks might rebound. Conversely, a low put/call ratio suggests that market exuberance could result in a retracement.
Looking at the chart (Figure 1), it has been a useful indicator to predict a market rebound when the ratio goes above the 0.8 level. Notably on the past three occurences in 2019, 2020 and 2022, the S&P 500 produced a V-shape rebound. It has been less reliable to predict a market reversal from the peak at the other extreme level of below 0.60 as it produced many false signals in 2021.
Thus, the put/call ratio serves as a good indicator to estimate market rebounds when the ratio hits extreme levels of bearishness but it does not function well to predict short-term peaks in the market especially during a strong bull market. One drawback to note however is that it is a poor timing signal and serves more as a coincidental indicator which moves together with the market.
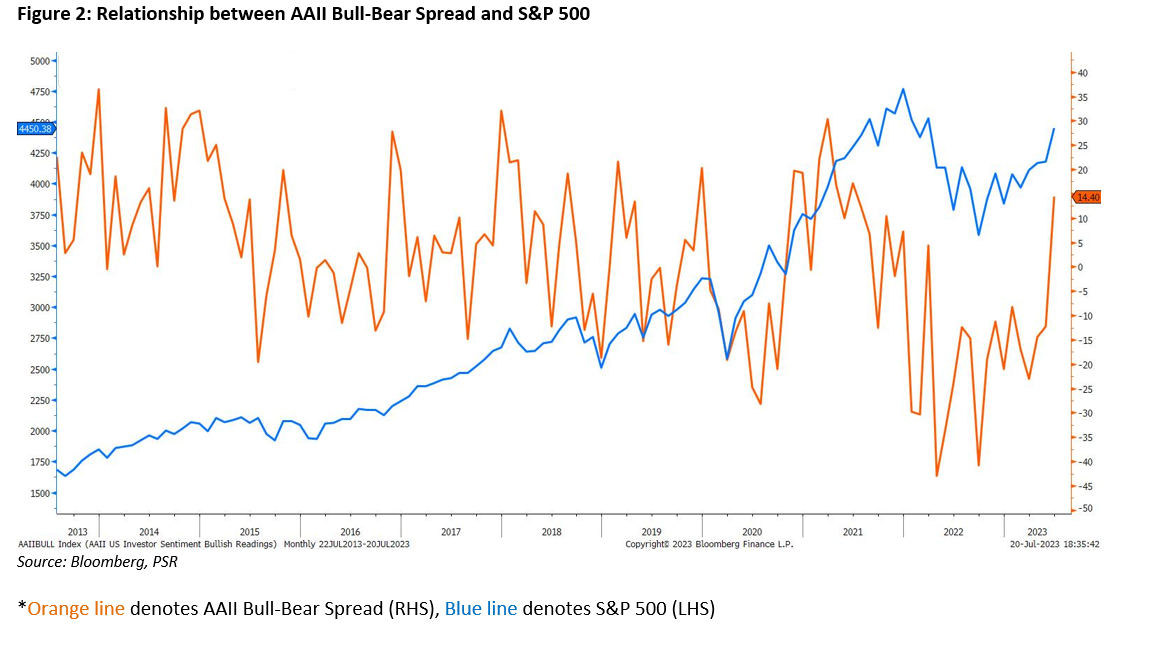
AAII Sentiment Survey Bull-Bear Spread
The AAII Sentiment Survey offers insight into the opinions of individual investors by asking them their thoughts each week on where the market is heading in the next six months – up (bullish), no change (neutral) or down (bearish). Tracking sentiment gives investors a forward-looking perspective of the market instead of relying on historical data, which tends to result in hindsight bias. The bull-bear spread is calculated by subtracting the percentage of bearish surveyees from that of bullish surveyees.
Looking at the chart (Figure 2), it does not serve as a good indicator to predict short-term market peaks at the 20-40% zone as there have been several occurences where the S&P 500 continued to rally in the following months when surveyees were more bullish than average, in 2014, 2016 and 2020. It performed better to gauge short-term rebounds below the -20% level where the S&P 500 tended to produce a V-shape bounce in 2016, 2018, 2019, 2020 and 2022.
Thus, the effectiveness of the AAII bull-bear spread is similar to the CBOE put/call ratio which is more useful to predict market rebounds than market peaks. Some limitations include that it also serves more as a coincidental indicator which moves together with the market and the reliability of survey results is more opinion-based and does not affect the market directly in fund flows unlike the CBOE put/call ratio which is calculated based on actual put and call options purchased by investors.
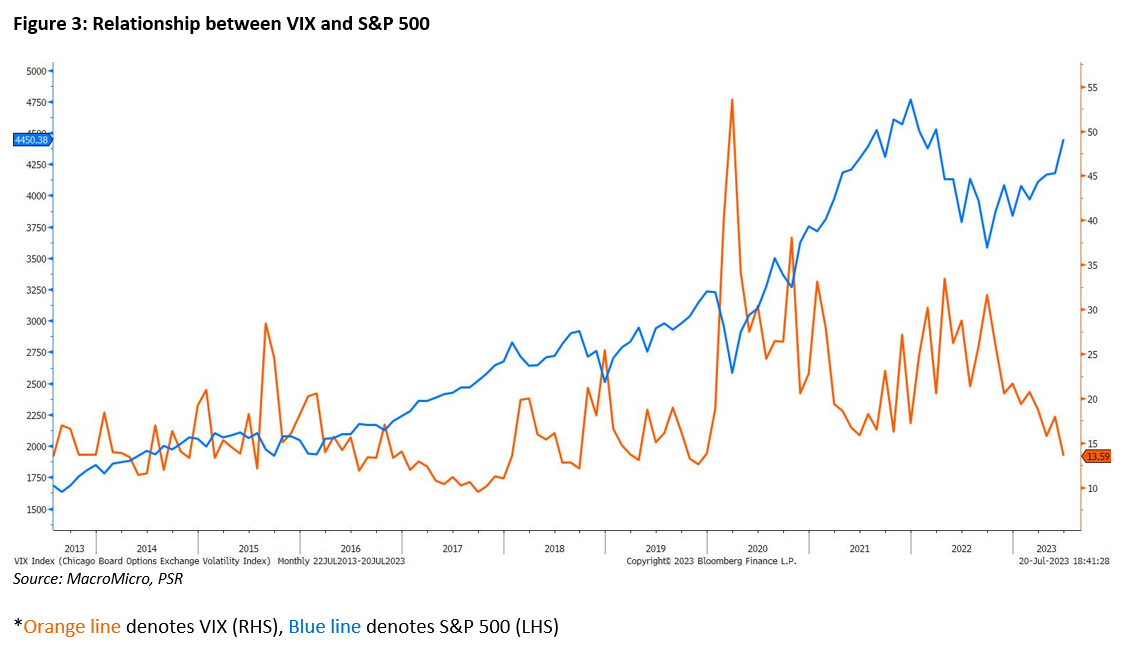
CBOE Volatility Index
The VIX Index is a calculation designed to produce a measure of constant, 30-day expected volatility of the US market, derived from real-time, mid-quote prices of S&P 500 index call and put options. It is one of the most popular and recognized measures of volatility.
Looking at the chart (Figure 3), it functioned well to predict market rebounds during periods of higher volatility above the 30 level, in 2015, 2020 and 2022. It had less utility to predict market peaks as there have been many instances when the S&P 500 continued to rally in the mid term even during periods of low volatility when VIX was below the 15 level throughout the past decade, including the market performance we are observing this year.
Thus, the effectiveness of the VIX is similar to the 2 tactical indicators, CBOE put/call ratio and AAII bull-bear spread mentioned earlier. A limitation of it is during periods of high volatility, when the VIX could surge well above the 30 level like in 2020 when it was above 50 before the market rebounded. It cannot be used to time a short-term market bottom accurately all the time.
Conclusion
Tactical indicators such as the CBOE total put/call ratio, AAII Sentiment Survey Bull-Bear Spread and CBOE VIX are some popular measures investors refer to gauge greed and fear levels in the market. They are similar in being more useful to estimate market rebounds than market peaks. However, that also comes with the limitation of not being able to act as leading indicators as they move together with the market.
The preferred tool to look at for estimating market rebounds appears to be the CBOE total put/call ratio as the extreme level of above 0.80 has been consistent with market rebounds even during periods of high volatility and extreme fear such as the 2020 Covid market crash.
Important Information
This report is prepared and/or distributed by Phillip Securities Research Pte Ltd ("Phillip Securities Research"), which is a holder of a financial adviser’s licence under the Financial Advisers Act, Chapter 110 in Singapore.
By receiving or reading this report, you agree to be bound by the terms and limitations set out below. Any failure to comply with these terms and limitations may constitute a violation of law. This report has been provided to you for personal use only and shall not be reproduced, distributed or published by you in whole or in part, for any purpose. If you have received this report by mistake, please delete or destroy it, and notify the sender immediately.
The information and any analysis, forecasts, projections, expectations and opinions (collectively, the “Research”) contained in this report has been obtained from public sources which Phillip Securities Research believes to be reliable. However, Phillip Securities Research does not make any representation or warranty, express or implied that such information or Research is accurate, complete or appropriate or should be relied upon as such. Any such information or Research contained in this report is subject to change, and Phillip Securities Research shall not have any responsibility to maintain or update the information or Research made available or to supply any corrections, updates or releases in connection therewith.
Any opinions, forecasts, assumptions, estimates, valuations and prices contained in this report are as of the date indicated and are subject to change at any time without prior notice. Past performance of any product referred to in this report is not indicative of future results.
This report does not constitute, and should not be used as a substitute for, tax, legal or investment advice. This report should not be relied upon exclusively or as authoritative, without further being subject to the recipient’s own independent verification and exercise of judgment. The fact that this report has been made available constitutes neither a recommendation to enter into a particular transaction, nor a representation that any product described in this report is suitable or appropriate for the recipient. Recipients should be aware that many of the products, which may be described in this report involve significant risks and may not be suitable for all investors, and that any decision to enter into transactions involving such products should not be made, unless all such risks are understood and an independent determination has been made that such transactions would be appropriate. Any discussion of the risks contained herein with respect to any product should not be considered to be a disclosure of all risks or a complete discussion of such risks.
Nothing in this report shall be construed to be an offer or solicitation for the purchase or sale of any product. Any decision to purchase any product mentioned in this report should take into account existing public information, including any registered prospectus in respect of such product.
Phillip Securities Research, or persons associated with or connected to Phillip Securities Research, including but not limited to its officers, directors, employees or persons involved in the issuance of this report, may provide an array of financial services to a large number of corporations in Singapore and worldwide, including but not limited to commercial / investment banking activities (including sponsorship, financial advisory or underwriting activities), brokerage or securities trading activities. Phillip Securities Research, or persons associated with or connected to Phillip Securities Research, including but not limited to its officers, directors, employees or persons involved in the issuance of this report, may have participated in or invested in transactions with the issuer(s) of the securities mentioned in this report, and may have performed services for or solicited business from such issuers. Additionally, Phillip Securities Research, or persons associated with or connected to Phillip Securities Research, including but not limited to its officers, directors, employees or persons involved in the issuance of this report, may have provided advice or investment services to such companies and investments or related investments, as may be mentioned in this report.
Phillip Securities Research or persons associated with or connected to Phillip Securities Research, including but not limited to its officers, directors, employees or persons involved in the issuance of this report may, from time to time maintain a long or short position in securities referred to herein, or in related futures or options, purchase or sell, make a market in, or engage in any other transaction involving such securities, and earn brokerage or other compensation in respect of the foregoing. Investments will be denominated in various currencies including US dollars and Euro and thus will be subject to any fluctuation in exchange rates between US dollars and Euro or foreign currencies and the currency of your own jurisdiction. Such fluctuations may have an adverse effect on the value, price or income return of the investment.
To the extent permitted by law, Phillip Securities Research, or persons associated with or connected to Phillip Securities Research, including but not limited to its officers, directors, employees or persons involved in the issuance of this report, may at any time engage in any of the above activities as set out above or otherwise hold an interest, whether material or not, in respect of companies and investments or related investments, which may be mentioned in this report. Accordingly, information may be available to Phillip Securities Research, or persons associated with or connected to Phillip Securities Research, including but not limited to its officers, directors, employees or persons involved in the issuance of this report, which is not reflected in this report, and Phillip Securities Research, or persons associated with or connected to Phillip Securities Research, including but not limited to its officers, directors, employees or persons involved in the issuance of this report, may, to the extent permitted by law, have acted upon or used the information prior to or immediately following its publication. Phillip Securities Research, or persons associated with or connected to Phillip Securities Research, including but not limited its officers, directors, employees or persons involved in the issuance of this report, may have issued other material that is inconsistent with, or reach different conclusions from, the contents of this report.
The information, tools and material presented herein are not directed, intended for distribution to or use by, any person or entity in any jurisdiction or country where such distribution, publication, availability or use would be contrary to the applicable law or regulation or which would subject Phillip Securities Research to any registration or licensing or other requirement, or penalty for contravention of such requirements within such jurisdiction.
This report is intended for general circulation only and does not take into account the specific investment objectives, financial situation or particular needs of any particular person. The products mentioned in this report may not be suitable for all investors and a person receiving or reading this report should seek advice from a professional and financial adviser regarding the legal, business, financial, tax and other aspects including the suitability of such products, taking into account the specific investment objectives, financial situation or particular needs of that person, before making a commitment to invest in any of such products.
This report is not intended for distribution, publication to or use by any person in any jurisdiction outside of Singapore or any other jurisdiction as Phillip Securities Research may determine in its absolute discretion.
IMPORTANT DISCLOSURES FOR INCLUDED RESEARCH ANALYSES OR REPORTS OF FOREIGN RESEARCH HOUSE
Where the report contains research analyses or reports from a foreign research house, please note:

I analyze the stock market and conduct technical analysis to provide investment recommendations. I look forward to having a conversation with you in our in-house seminars and presentations to identify good risk-reward trading strategies together. I graduated from Nanyang Technological University with a Bachelor of Accountancy (Honours).
