
Company Background
Founded in 2004, Facebook (FB) is the largest social-media company in the world, serving more than 3bn users and about 10m advertisers. Its portfolio includes Facebook, Instagram, Messenger, WhatsApp and Facebook Reality Labs (VR). FY20 revenue was a record US$86bn, with PATMI of US$29.1bn. Almost all FB’s US$86bn revenue in FY20 came from advertising, at 98% or US$84.2bn. Payments and Others made up 2%. Geographically, North America contributed 49% to revenue, Europe 24%, Asia-Pac 18% and the Rest of The World 9%.
Investment Merits
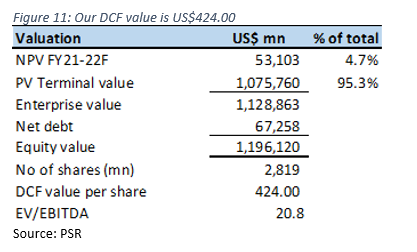
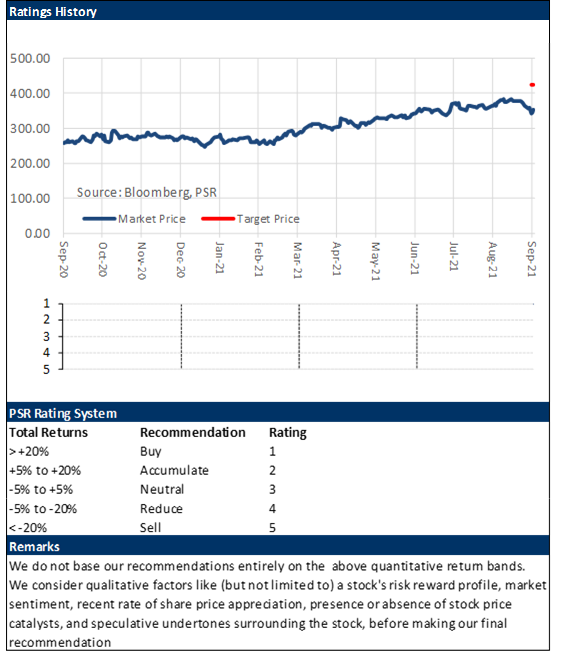
We Initiate coverage with a BUY rating and target price of US$424.00 based on DCF valuation, with a WACC of 6.7% and terminal growth of 4%.
REVENUE
The bulk of FB’s US$86bn revenue in FY20 came from advertising, at 98% or US$84.2bn. Payments & others made up 2% or US$1.8bn. FB’s advertising revenue is generated from selling ad placements to marketers using an open bid system, allowing marketers to purchase ads at a price determined by supply and demand, with the added option for marketers to place these ads on any of FB’s family of platforms.
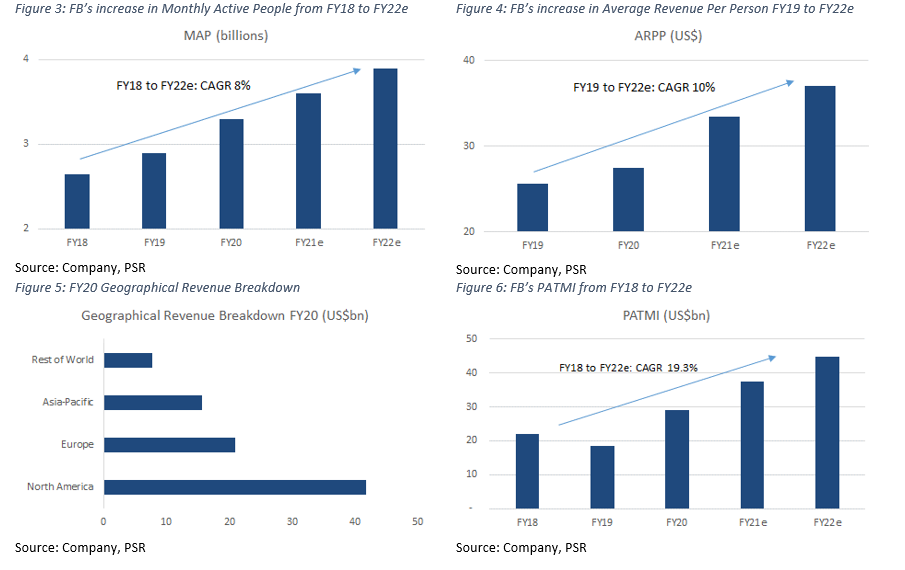
Geographically, North America contributed 49% to revenue, Europe 24%, Asia-Pac 18% and Rest of The World 9%. Even as growth rates of monthly average people in developed regions like North America and Europe start to slow down, we expect ad revenue from these two regions to increase 40+% YoY. This would be largely led by increased digital ad-spending in these regions.
We see the potential for growth from the monetisation of FB’s e-commerce products, Shops. Shops is a product to bring businesses and consumers together. It allows businesses to create a free to use an online store to display and sell merchandise to FB users, leveraging on connectivity tools such as Messenger and WhatsApp as support functions. FB is expected to use these products to generate additional revenue from 1) transactional fees; and/or 2) increased ad impressions and higher advertising prices associated with shopping directly on its platforms.
FB has also been actively developing a secondary revenue stream in the payment sector. It launched WhatsApp Pay in developing countries like India and Brazil in Q4 FY20, where its combined user base exceeds 500mn people. It wants to: 1) monetise it’s largely untapped free-to-use platform; and 2) develop its existing payment platform for future integration with its family of platforms. Revenue from payments & others was up 146% YoY Q1 FY21. Thanks to the company’s global user reach and a strong emphasis on growth in this revenue stream, we expect YoY growth to be maintained around 65% moving forward.
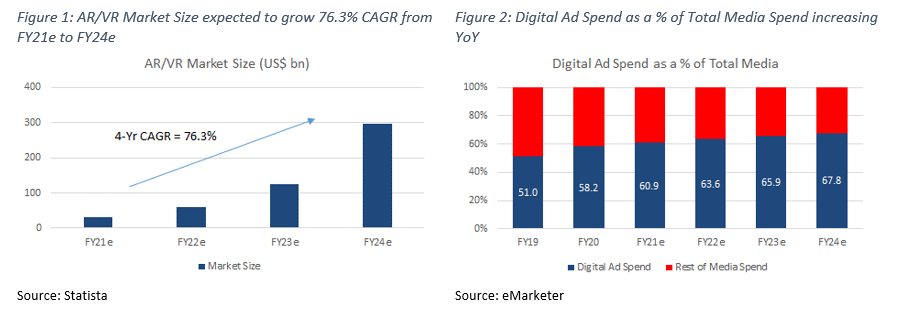
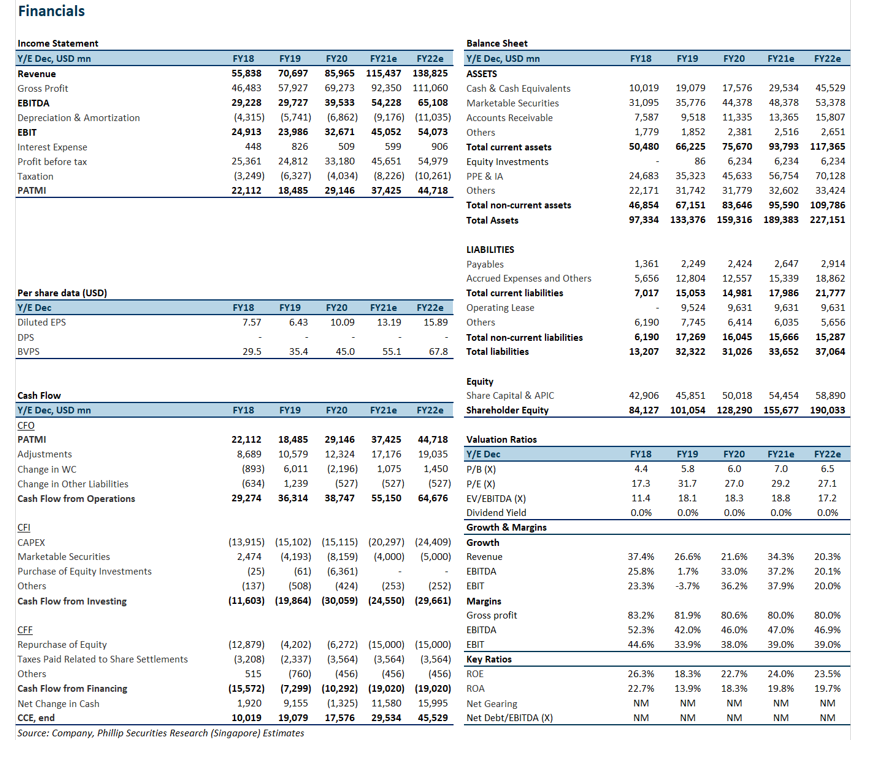
FB recorded gross profits of $69.2bn in FY20, with PATMI of $29.1bn. Revenue is expected to hit US$138bn by end-FY22e, largely due to increases in MAP. MAP is a key metric for FB as it leverages its user base to generate advertising revenue. FB recorded MAP of 3.3 billion people in FY20, and is expected to grow at a CAGR of 8% to 3.9 billion by FY22e. ARPP was US$27.51 for FY20, an 8% YoY growth, and is forecasted to hit US$37 by FY22e – CAGR 10%, on the back of increased worldwide ad spending. Worldwide digital ad-spending is expected to trend upwards as a result of behavioural shifts in advertising and marketing spending, which would benefit FB.
EXPENSES
Cost of sales grew at a 34.5% CAGR from FY16 to FY20, above revenue CAGR of 25.5%. Operating expenses include research and development (21.5% of revenue), sales and marketing (13.5%), and general and administrative (7.6%). Expenses have remained fairly stable over the last 5 years, except for general and administrative expense in FY19 which hit 14.8% of revenue – due to US$5bn FTC settlement. Depreciation and amortization for FY20 was US$6.9bn (8% of revenue), a 19.5% YoY increase from FY19. D&A expenses are expected to increase significantly over the next 2 years on the back of increased capital expenditure in tech infrastructure.
MARGINS
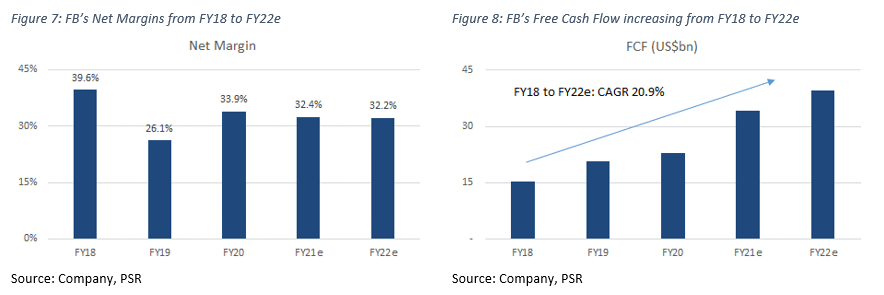
Gross margins hit 80% in FY20, slightly below the 5-year average of 84%. The high margins are attributed to its minimal overhead costs, mostly spent on facility and server depreciation, salaries and content & traffic acquisition costs.
Net margins in FY20 were 34%, up from 26% the previous year. Led by 37%/36% YoY drops in G&A expenses and tax. G&A expense decreased from US$10.5bn to US$6.60bn given the absence of a US$5bn Federal Trade Commission settlement in 2019. Cost of revenue, R&D expenses and G&A expenses are expected to increase due to business expansion, but net margins should remain stable at 32-33% due to increased revenue.
BALANCE SHEET
Assets: Cash, cash equivalents and marketable securities increased by about US$7bn YoY in FY20, largely due to increased purchases of marketable securities. Equity Investments increased US$6.1bn, following a US$5.8bn investment in Jio Platforms – a holding company for India’s largest mobile network provider. Plant Property Equipment & Intangible Assets rose US$10bn, reflecting continued capex on buildings and network equipment. We expect cash & cash equivalents to increase in FY21e from US$17.5bn to US$29.5bn, from operational cash flows and lower net marketable securities and purchases of equity investments. We also expect PPE & IA to increase significantly, in line with increased capex of US$20bn, up US$5bn YoY.
|
BUSINESS MODEL Facebook builds products that enable people to connect and share with friends and family through mobile devices, personal computers, VR headsets, and in-home devices. Through these products, Facebook enables people to share opinions, ideas, photos, videos, and other activities with a wide array of audiences. Their range of products includes Facebook, Instagram, Messenger, WhatsApp, and Facebook Reality Labs.
The bulk of revenue is generated from selling advertising placements to marketers, enabling marketers to reach people based on factors like age, gender, location, interests, behaviours, through targeted ads. Purchased ads can appear on a range of places including Facebook, Instagram, Messenger, and other third-party applications or websites.
|
|
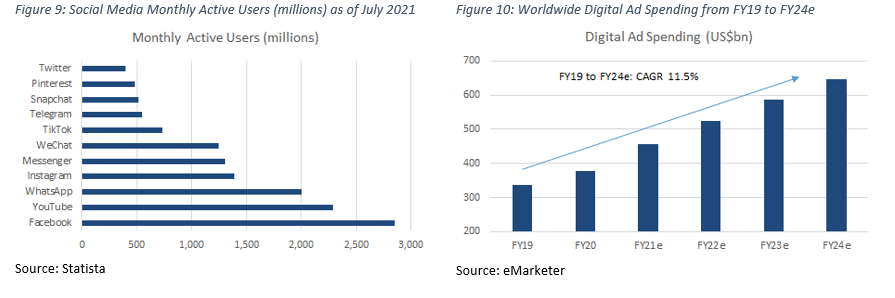
INDUSTRY The social media industry is largely dominated by Facebook and Google. Aside from WeChat, which is predominately used in China, Facebook and Google are the only companies with platforms exceeding one billion monthly active users – as of July 2021. However, competition to build and develop new and innovative tools within the social media industry is still very high, as companies look to continue attracting new and existing users onto its platforms.
According to eMarketer, worldwide digital ad spending is expected to increase from $335bn in FY19 to $645bn in FY24e, with a CAGR of 11.5%. We expect this trend of increased digital ad spending to provide tailwinds for the overall industry moving forward.
|
RISKS
VALUATION
We initiate coverage on Facebook Inc. with a BUY rating and a price target of US$424.00. Our valuation is based on DCF valuation, using a 6.7% WACC and 4% terminal growth rate.
Important Information
This report is prepared and/or distributed by Phillip Securities Research Pte Ltd ("Phillip Securities Research"), which is a holder of a financial adviser’s licence under the Financial Advisers Act, Chapter 110 in Singapore.
By receiving or reading this report, you agree to be bound by the terms and limitations set out below. Any failure to comply with these terms and limitations may constitute a violation of law. This report has been provided to you for personal use only and shall not be reproduced, distributed or published by you in whole or in part, for any purpose. If you have received this report by mistake, please delete or destroy it, and notify the sender immediately.
The information and any analysis, forecasts, projections, expectations and opinions (collectively, the “Research”) contained in this report has been obtained from public sources which Phillip Securities Research believes to be reliable. However, Phillip Securities Research does not make any representation or warranty, express or implied that such information or Research is accurate, complete or appropriate or should be relied upon as such. Any such information or Research contained in this report is subject to change, and Phillip Securities Research shall not have any responsibility to maintain or update the information or Research made available or to supply any corrections, updates or releases in connection therewith.
Any opinions, forecasts, assumptions, estimates, valuations and prices contained in this report are as of the date indicated and are subject to change at any time without prior notice. Past performance of any product referred to in this report is not indicative of future results.
This report does not constitute, and should not be used as a substitute for, tax, legal or investment advice. This report should not be relied upon exclusively or as authoritative, without further being subject to the recipient’s own independent verification and exercise of judgment. The fact that this report has been made available constitutes neither a recommendation to enter into a particular transaction, nor a representation that any product described in this report is suitable or appropriate for the recipient. Recipients should be aware that many of the products, which may be described in this report involve significant risks and may not be suitable for all investors, and that any decision to enter into transactions involving such products should not be made, unless all such risks are understood and an independent determination has been made that such transactions would be appropriate. Any discussion of the risks contained herein with respect to any product should not be considered to be a disclosure of all risks or a complete discussion of such risks.
Nothing in this report shall be construed to be an offer or solicitation for the purchase or sale of any product. Any decision to purchase any product mentioned in this report should take into account existing public information, including any registered prospectus in respect of such product.
Phillip Securities Research, or persons associated with or connected to Phillip Securities Research, including but not limited to its officers, directors, employees or persons involved in the issuance of this report, may provide an array of financial services to a large number of corporations in Singapore and worldwide, including but not limited to commercial / investment banking activities (including sponsorship, financial advisory or underwriting activities), brokerage or securities trading activities. Phillip Securities Research, or persons associated with or connected to Phillip Securities Research, including but not limited to its officers, directors, employees or persons involved in the issuance of this report, may have participated in or invested in transactions with the issuer(s) of the securities mentioned in this report, and may have performed services for or solicited business from such issuers. Additionally, Phillip Securities Research, or persons associated with or connected to Phillip Securities Research, including but not limited to its officers, directors, employees or persons involved in the issuance of this report, may have provided advice or investment services to such companies and investments or related investments, as may be mentioned in this report.
Phillip Securities Research or persons associated with or connected to Phillip Securities Research, including but not limited to its officers, directors, employees or persons involved in the issuance of this report may, from time to time maintain a long or short position in securities referred to herein, or in related futures or options, purchase or sell, make a market in, or engage in any other transaction involving such securities, and earn brokerage or other compensation in respect of the foregoing. Investments will be denominated in various currencies including US dollars and Euro and thus will be subject to any fluctuation in exchange rates between US dollars and Euro or foreign currencies and the currency of your own jurisdiction. Such fluctuations may have an adverse effect on the value, price or income return of the investment.
To the extent permitted by law, Phillip Securities Research, or persons associated with or connected to Phillip Securities Research, including but not limited to its officers, directors, employees or persons involved in the issuance of this report, may at any time engage in any of the above activities as set out above or otherwise hold an interest, whether material or not, in respect of companies and investments or related investments, which may be mentioned in this report. Accordingly, information may be available to Phillip Securities Research, or persons associated with or connected to Phillip Securities Research, including but not limited to its officers, directors, employees or persons involved in the issuance of this report, which is not reflected in this report, and Phillip Securities Research, or persons associated with or connected to Phillip Securities Research, including but not limited to its officers, directors, employees or persons involved in the issuance of this report, may, to the extent permitted by law, have acted upon or used the information prior to or immediately following its publication. Phillip Securities Research, or persons associated with or connected to Phillip Securities Research, including but not limited its officers, directors, employees or persons involved in the issuance of this report, may have issued other material that is inconsistent with, or reach different conclusions from, the contents of this report.
The information, tools and material presented herein are not directed, intended for distribution to or use by, any person or entity in any jurisdiction or country where such distribution, publication, availability or use would be contrary to the applicable law or regulation or which would subject Phillip Securities Research to any registration or licensing or other requirement, or penalty for contravention of such requirements within such jurisdiction.
This report is intended for general circulation only and does not take into account the specific investment objectives, financial situation or particular needs of any particular person. The products mentioned in this report may not be suitable for all investors and a person receiving or reading this report should seek advice from a professional and financial adviser regarding the legal, business, financial, tax and other aspects including the suitability of such products, taking into account the specific investment objectives, financial situation or particular needs of that person, before making a commitment to invest in any of such products.
This report is not intended for distribution, publication to or use by any person in any jurisdiction outside of Singapore or any other jurisdiction as Phillip Securities Research may determine in its absolute discretion.
IMPORTANT DISCLOSURES FOR INCLUDED RESEARCH ANALYSES OR REPORTS OF FOREIGN RESEARCH HOUSE
Where the report contains research analyses or reports from a foreign research house, please note:

Jonathan covers the US technology sector focusing on internet companies. Formerly a national and professional athlete, he graduated from the University of Oregon with a Bachelor’s Degree in Social Sciences.
